

Built on Prometheus & OpenTelemetry
No vendor lock-in
Every minute of downtime erodes customer trust and revenue. Get full visibility into your servers, databases, APIs, and uptime — before your customers notice a problem.
15-day free trialNo credit card requiredNo long-term commitment
No vendor lock-in
Data stays in EU · GDPR compliant
Across Europe and beyond
The problem
The average cost of IT downtime is $5,600 per minute for mid-size companies. For a SaaS product, it's not just lost revenue — it's churned customers, broken integrations, and SLA penalties. A single prolonged outage can undo months of customer acquisition.
Setting up Prometheus, Grafana, Alertmanager, and long-term storage takes weeks. Then you need to maintain it, upgrade it, and write alert rules for every service. That's engineering time not spent building your product.
Bleemeo gives you complete infrastructure monitoring — servers, databases, web servers, caches, message queues, and uptime — in 10 minutes, with zero configuration. Know about problems before your customers open a support ticket.
Whether you're running a monolith on a single server or a microservices architecture across multiple clouds, Bleemeo adapts to your stack automatically. You get server metrics, database performance, cache efficiency, and external uptime monitoring — all from one agent and one dashboard, with alerts that work out of the box.
Setup
Your engineering team can set this up during a coffee break.
One command per server. Bleemeo's Glouton agent auto-discovers your entire SaaS stack: web server, application runtime, database, cache, message broker, and search engine.
wget -qO- 'https://get.bleemeo.com?accountId=...'Run this on each server in your stack. The agent detects everything running on the machine — no configuration file to write.
SaaS stacks evolve fast — new services get deployed, containers get replaced, dependencies change. Manually configuring monitoring for each component means hours of YAML and the constant risk of blind spots. Bleemeo detects every service on your machine in seconds, so nothing falls through the cracks — even as your architecture evolves.
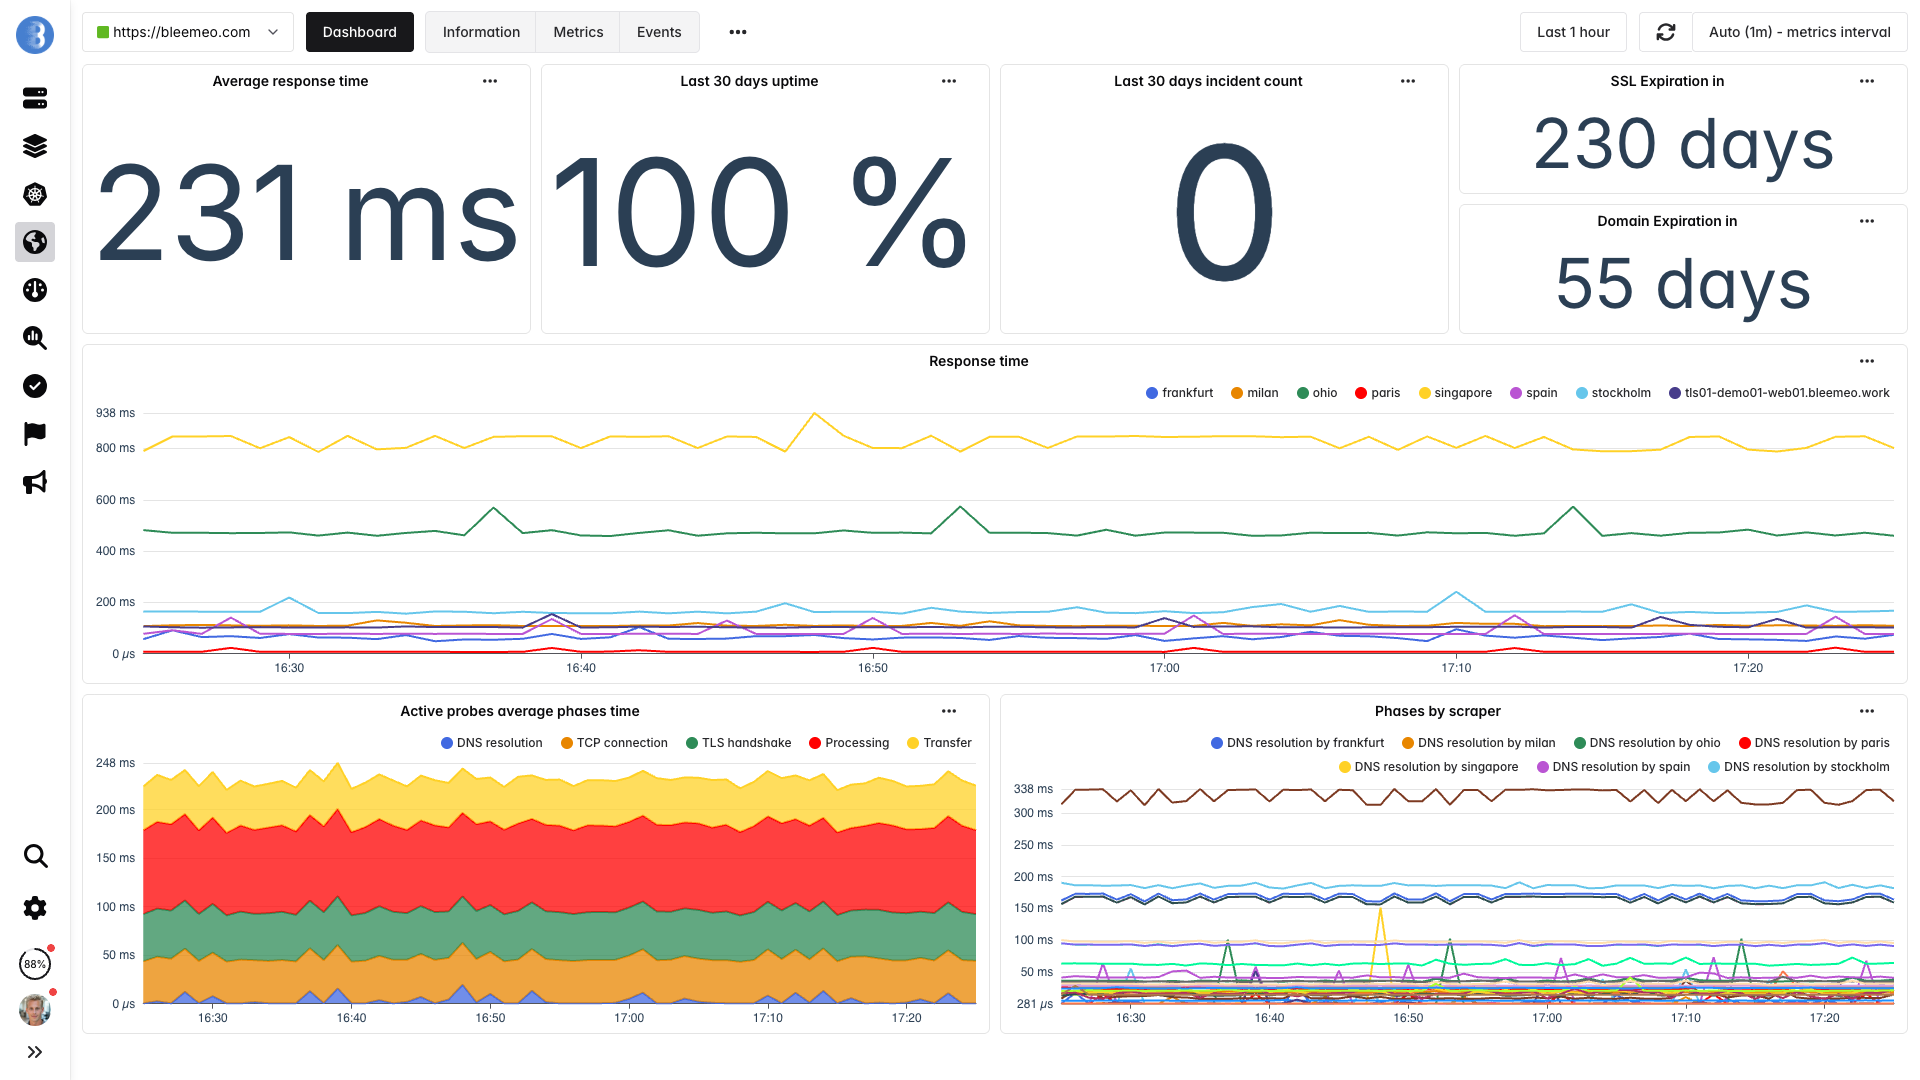
Monitor your most important URLs from 7 global locations. Bleemeo checks availability, response time, SSL certificate expiration, and content validation every 60 seconds.
Learn more: Uptime Monitoring Features
Your servers might show green across the board, but a DNS issue, CDN misconfiguration, or certificate expiry can still block customers from reaching your product. Monitoring from 7 global locations sees what your customers see — and catches problems that internal health checks miss.
Default alert rules are active immediately. Route notifications to where your team works — whether it's 2 PM or 2 AM.
Writing effective alert rules requires deep knowledge of each service's failure modes. Bleemeo ships with battle-tested thresholds for every auto-detected service — so you're protected from minute one, without spending hours tuning alert conditions that might still miss the problem that actually matters.
Your stack
Every layer of your infrastructure, covered automatically.
A SaaS product is a chain — and it's only as strong as its weakest link. A slow database query makes your API crawl. A full disk crashes your worker processes. A cache eviction spike hammers your database during a traffic surge. Bleemeo monitors every layer so you can see where problems start, not just where they surface.
This is what your customers experience. If your API is slow or your login page is down, you need to know immediately — not from a support ticket an hour later.
Your web server and application runtime handle every request. A misconfigured worker pool or a memory leak here affects every user of your product.
Impact
For a SaaS with $50K MRR, even 1% downtime costs $500/month in direct SLA credits — not counting the customers who quietly churn. Bleemeo detects outages in under 60 seconds from 7 global locations, so you can start fixing in minutes, not hours.
Research shows 53% of users abandon a service if it takes more than 3 seconds to respond. Track response times across your API endpoints, web app, and webhooks — and get alerted before latency degrades to the point where customers look for alternatives.
Monitoring 10 servers with Bleemeo costs €109.90/month. That's less than the engineering time wasted debugging a single blind outage. Try the cost calculator.
No DevOps
Bleemeo is built for engineering teams that need to ship features, not maintain monitoring infrastructure. There's no Prometheus to configure, no Grafana dashboards to build, no alerting rules to write. Your team can set it up during a coffee break and get back to building the product your customers pay for.
Most SaaS companies run lean engineering teams. The same people who build product features also manage infrastructure, handle deployments, and respond to incidents. Bleemeo takes monitoring off that plate entirely — you get production-grade observability without hiring a dedicated SRE or spending weeks on tooling that isn't your core business.
See How It WorksEngineers and CTOs trust Bleemeo to monitor their infrastructure
We need our teams focused on our core business — digital signage — rather than on infrastructure monitoring. Bleemeo monitors our entire environment, from bare metal to Azure, and frees our teams from useless alerts while guaranteeing our quality of service.

Bleemeo has supported us for years: simple, reliable monitoring that is essential to the quality of service we owe our customers.

On-premise or in the cloud, Bleemeo monitors my clients' Kubernetes clusters without any complexity. A tool I recommend for its simplicity and the clarity it brings.

Customer since day one, I'm thrilled with Bleemeo. It's easy to install, efficient, and just keeps getting better!

During a short lunch break we installed Bleemeo, created a custom metric, tested alerts, and were ready for production. The speed of deployment is remarkable.

Bleemeo support is simply legendary — fast, knowledgeable, and always there when we need it.

Bleemeo was incredibly fast to deploy. In about an hour we rolled it out across more than 100 servers and immediately gained full visibility into our infrastructure.

We set up monitoring for all our servers in just a few hours. The dashboard is clear, powerful, and genuinely enjoyable to use.

We deployed Bleemeo across our server infrastructure in only a few hours. Uptime monitoring now alerts us instantly whenever a service encounters an issue.

Get complete SaaS monitoring in 10 minutes. Know about problems before your customers do.
15-day free trial · No credit card required · Cancel anytime
Most teams go from zero to full monitoring in under 10 minutes. Create an account, run one install command per server, and dashboards and alerts activate automatically as services are discovered.
No. Bleemeo automatically creates dashboards for every discovered service — databases, web servers, caches, message brokers, and more. You get production-ready dashboards from minute one without writing any configuration.
Bleemeo monitors servers, containers, Kubernetes clusters, databases (PostgreSQL, MySQL, MongoDB, Redis), web servers (Nginx, Apache), message brokers (RabbitMQ, Kafka), and 100+ other services. It also provides uptime monitoring and log management.
Yes. Install the agent on servers in any region or cloud provider. All data flows to the same Bleemeo dashboard, giving you a unified view across AWS, GCP, Azure, on-premise, and hybrid environments.
Bleemeo provides uptime monitoring from 7 global locations, real-time alerting, and historical availability data. You can track response times, set thresholds aligned with your SLA targets, and get alerted before breaches happen.
Yes. Glouton, Bleemeo's monitoring agent, is fully open source under the Apache 2.0 license. You can audit the code, contribute, and verify exactly what data is collected.
Bleemeo sends alerts via email, Slack, Microsoft Teams, PagerDuty, and webhooks. You can configure different channels for different severity levels, so critical issues reach on-call engineers immediately.
Yes. Set up HTTP monitors for any URL — API endpoints, health checks, webhooks. Bleemeo checks availability and response time from multiple global locations every 60 seconds and alerts you if performance degrades or endpoints go down.
Bleemeo charges per server per month with no long-term commitment. As you scale up, add agents to new servers with a single command. Scale down by simply removing them. You only pay for what you actively monitor. See pricing details.
Yes. Bleemeo exposes a PromQL-compatible query interface, so you can keep your existing Grafana dashboards. It also integrates with Slack, Teams, PagerDuty, and provides a REST API for custom integrations into your CI/CD pipelines.