
Most PostgreSQL dashboards graph queries per second and cache hit ratio, and most PostgreSQL outages are caused by neither. They are caused by a connection pool that filled up, a transaction somebody left open, autovacuum falling behind, or — the classic — transaction ID wraparound that nobody was watching until the database refused writes.
This guide covers what to watch and why, then how to collect it with Bleemeo.
What PostgreSQL is, briefly
PostgreSQL — Postgres to most people — is the most widely used open-source relational database, first released in 1996 out of the University of California, Berkeley. Apple, Red Hat and Cisco run it, and so does most of the modern application stack.
It is also unusually honest about its own internals: nearly everything below comes from views Postgres exposes itself, which means you can monitor it well without any extension.
The metrics that matter
Connections, and the ones that are lying to you
max_connections is a hard ceiling. Reach it and new connections are refused — including,
memorably, the one your monitoring uses and the one you were about to open to investigate.
Watch used connections as a share of max_connections, and alert well before the ceiling.
But the more interesting number is in pg_stat_activity, broken down by state:
active— actually doing work. This is your real concurrency.idle— a pooled connection at rest. Harmless.idle in transaction— a client opened a transaction and wandered off. This one is a problem, and it is the one nobody graphs.
An idle in transaction session holds its locks and, worse, pins the oldest transaction ID
in the system. That single forgotten transaction prevents autovacuum from cleaning up dead
rows across the whole database, and it is how a small application bug becomes a
table-bloat incident three days later. Alert on any session in that state for more than a
few minutes.
Transaction ID age, the alert nobody sets
Postgres numbers transactions with a 32-bit counter. If the oldest unfrozen transaction gets too far behind the newest, the database shuts down writes rather than risk losing data — and recovering means a single-user-mode vacuum that can take hours on a large table.
This is entirely preventable. age(datfrozenxid) per database, compared against
autovacuum_freeze_max_age (200 million by default), tells you how much runway you have.
Alert at around 50% of the limit. It is the rare metric where the right response time is
“this week”, not “right now”, which is exactly why it gets forgotten.
Autovacuum, and the debt it is not paying down
Postgres never overwrites a row in place; updates and deletes leave dead tuples behind, and autovacuum reclaims them. When it cannot keep up, tables bloat, indexes bloat with them, and the planner starts choosing worse plans because its statistics no longer describe reality.
From pg_stat_user_tables:
n_dead_tup, ideally as a ratio againstn_live_tup. A large table sitting at 20% dead is asking for attention.last_autovacuumandlast_autoanalyze. A hot table that has not been vacuumed in a week is either configured wrong or blocked by a long-running transaction — see above.
Memory pressure, read properly
Cache hit ratio from pg_stat_database — blks_hit / (blks_hit + blks_read) — sits above
99% on almost any healthy OLTP database. It is a reassuring graph and a poor signal: it stays
high right up until it doesn’t.
temp_bytes is the better one. It counts bytes written to temporary files, which happens
when a sort or a hash join does not fit in work_mem and spills to disk. A climbing
temp_bytes is a direct measurement of queries that got slower because memory ran out —
far more actionable than a hit ratio in the high nineties.
Locks and deadlocks
pg_locks entries with granted = false are sessions waiting on someone else. A handful
transiently is normal; a sustained queue means contention worth chasing.
deadlocks in pg_stat_database should be flat. Postgres resolves deadlocks by killing
one side, so your application sees an error and probably retries — meaning deadlocks are
invisible to users right up to the point where they are not. Any non-zero rate is a bug
somewhere in transaction ordering.
Checkpoints and WAL
From pg_stat_bgwriter, compare checkpoints_timed with checkpoints_req. Timed
checkpoints are the scheduled kind; requested ones happen because WAL filled up first. If
requested checkpoints outnumber timed ones, max_wal_size is too small, and you are paying
for it in I/O spikes that look like mysterious latency.
Replication
On a primary, pg_stat_replication gives you write_lag, flush_lag and replay_lag per
standby. replay_lag is the one that matters if you route reads to replicas: it is how stale
those reads are. A replica that has stopped replaying while still answering queries is
serving old data confidently, which is worse than being down.
Commits, rollbacks and the ratio between them
xact_commit and xact_rollback in pg_stat_database. A rollback rate that jumps after a
deploy is a fast, cheap signal that something in the new code is failing its transactions —
often before the error rate surfaces anywhere else.
Collecting it with Bleemeo
After installing PostgreSQL from your distribution’s packages and installing the Bleemeo agent, the agent auto-discovers PostgreSQL and starts port checks for service availability.
In a Docker container, POSTGRES_USER and POSTGRES_PASSWORD are picked up automatically.
Outside a container you tell the agent how to connect. Create
/etc/glouton/conf.d/99-postgresql.conf:
service:
  [...]
  # For a PostgreSQL running outside any container
  - type: "postgresql"
    username: "USERNAME"
    password: "PASSWORD"
    address: "127.0.0.1"
    port: 5432
Then restart the agent with systemctl restart glouton. Collection starts immediately.

Give the monitoring user only what it needs — pg_monitor is the built-in role for exactly
this, and it is enough for the statistics views above without granting access to your data.
Every configuration option is in
the documentation.
The service dashboard you get for free
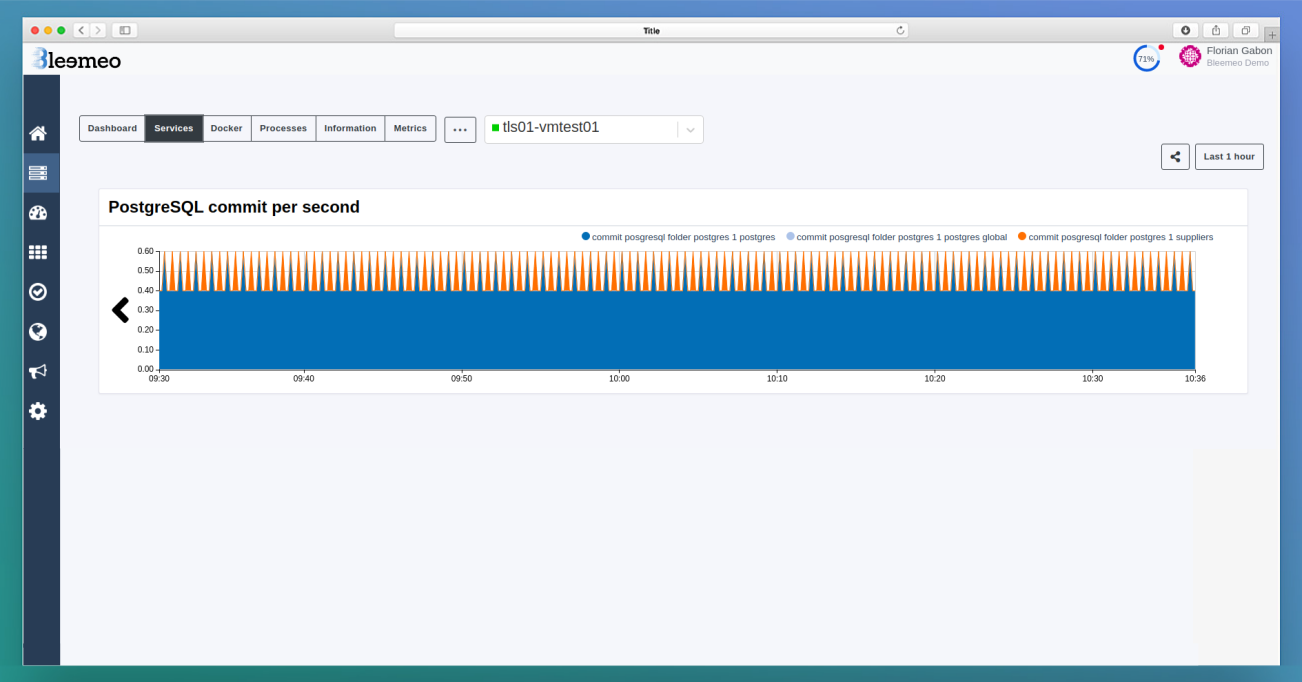
Once the agent can reach PostgreSQL, a service dashboard appears in the server’s “Services” tab:
Building the dashboard you actually want
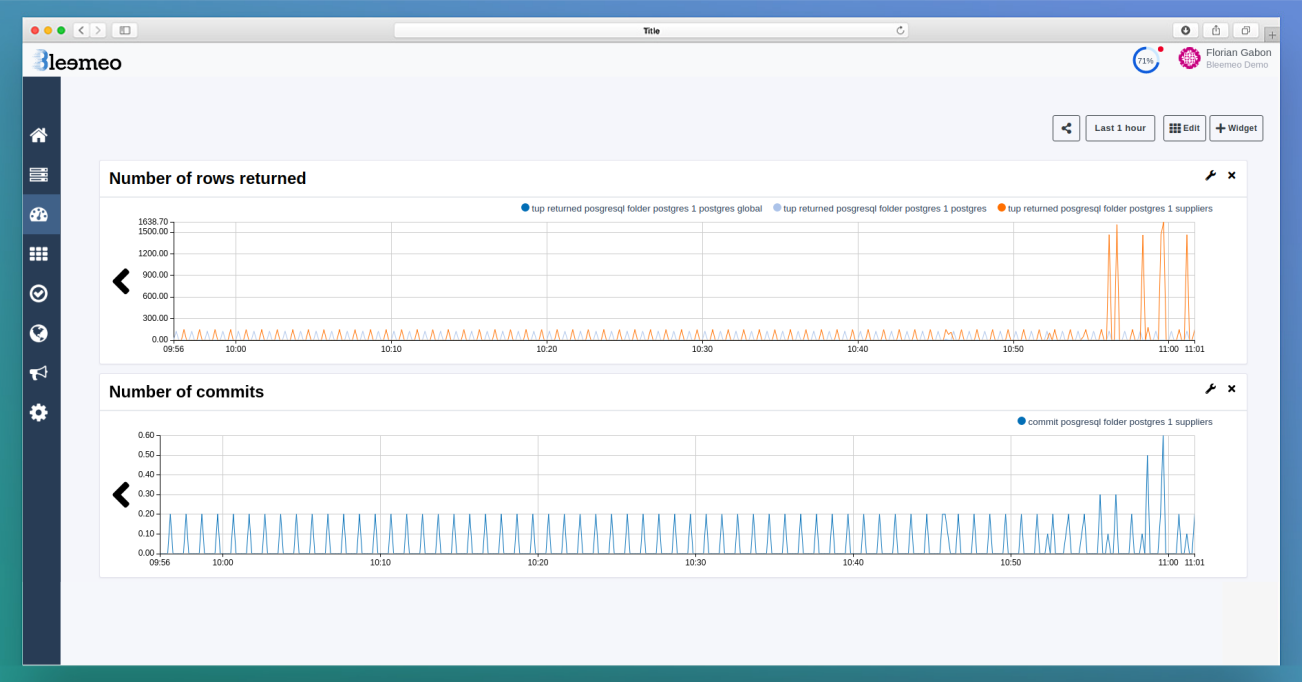
Add a custom dashboard for the metrics the default one does not graph — and, usefully, for business metrics alongside them, so a drop in checkouts sits next to the database numbers that might explain it. The example below graphs:
- Number of commits per second
- Number of rows returned per second
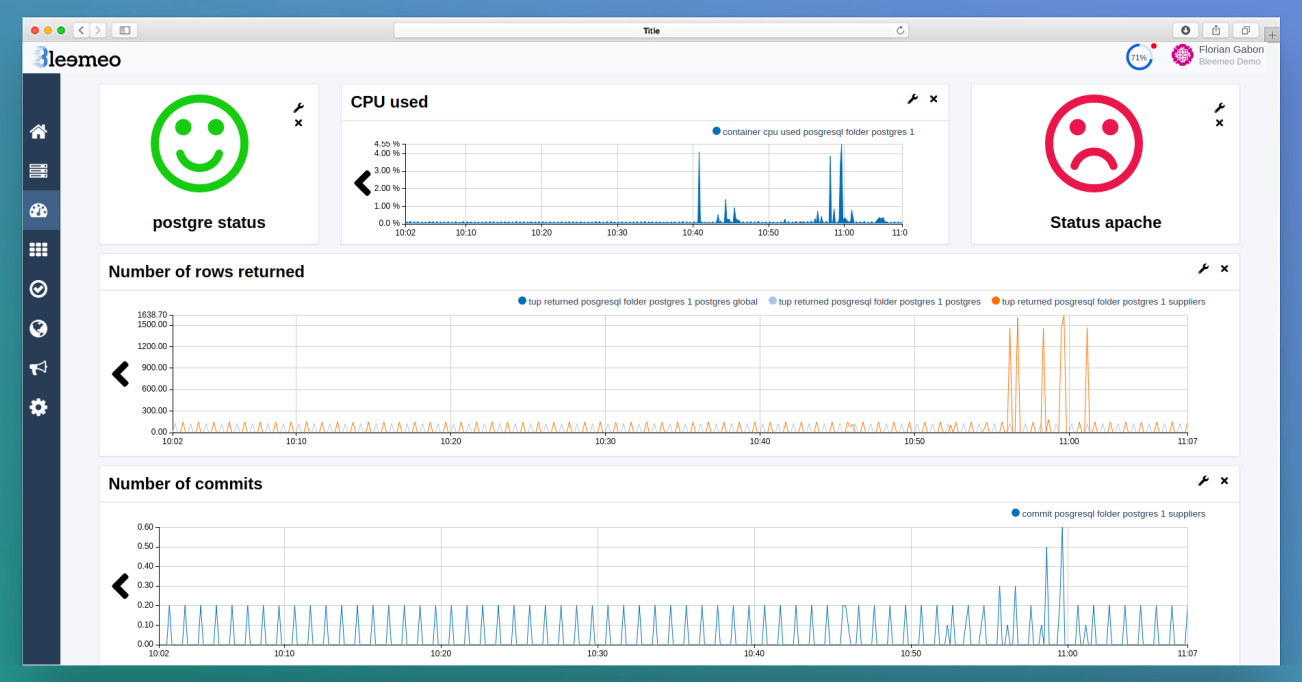
Every metric available for PostgreSQL is listed in the documentation, and you can mix in anything else Bleemeo collects. For a containerised database, the container’s own numbers are what turn a slow query into an explanation:
- Status of the Postgres container
- CPU used by the Postgres container
- Memory used by the Postgres container
Which of these deserve an alert
| Alert on | Why |
|---|---|
Connections above 80% of max_connections |
At 100% you cannot connect to investigate |
Any session idle in transaction for minutes |
Blocks autovacuum database-wide |
age(datfrozenxid) past half of autovacuum_freeze_max_age |
Weeks of warning before writes stop |
deadlocks rate above zero |
A transaction-ordering bug, silent to users |
replay_lag on a read-serving replica |
Stale reads answered confidently |
| Requested checkpoints outnumbering timed ones | max_wal_size too small; I/O spikes follow |
Queries per second and cache hit ratio belong on the dashboard, not in the alerting rules. Both track your traffic more than your database’s health, and both look identical whether your application is idle or broken.
PostgreSQL monitoring FAQ
What is a good PostgreSQL cache hit ratio?
Above 99% is normal for an OLTP workload, which is exactly why it is a weak alert. It stays comfortably high until the moment it doesn't, and by then you have other symptoms. temp_bytes — bytes spilled to temporary files because a sort or hash join outgrew work_mem — measures memory pressure far more directly.
Why does my table keep growing after I delete rows?
PostgreSQL marks deleted rows dead rather than removing them, and autovacuum reclaims the space later. If n_dead_tup stays high and last_autovacuum is old, autovacuum is either tuned too conservatively for that table's write rate or blocked by a long-running transaction holding the oldest transaction ID open.
What is transaction ID wraparound and do I need to worry?
Transactions are numbered with a 32-bit counter. If the oldest unfrozen transaction falls too far behind, PostgreSQL stops accepting writes rather than risk data loss, and recovery means a single-user vacuum that can take hours. It is completely preventable: alert when age(datfrozenxid) passes roughly half of autovacuum_freeze_max_age and you will have weeks of notice.
Which privileges does the monitoring user need?
The built-in pg_monitor role. It grants read access to the statistics views and functions monitoring needs, without any access to your tables — which is the right trade for a credential that lives in a config file on every host.