Glouton:a single-binary monitoring agent that just works.
Auto-discovery, an embedded TSDB, and a status-first local panel — out of the box.
The agent we use at Bleemeo to run our SaaS monitoring product, released as open source. Battle-tested on Linux servers, Docker and Kubernetes.
Quick start
The fastest way to see Glouton in action
No account, no signup.
docker run -d --name=glouton \
  -v /var/lib/glouton:/var/lib/glouton \
  -v /var/run/docker.sock:/var/run/docker.sock \
  -v /:/hostroot:ro \
  -e GLOUTON_BLEEMEO_ENABLE=false \
  --pid=host --net=host \
  --cap-add SYS_PTRACE --cap-add SYS_ADMIN \
  bleemeo/bleemeo-agent
Then open http://localhost:8015. With Bleemeo disabled the on-disk TSDB starts automatically, so the dashboard's longer time ranges (24 h, 7 d, 30 d) work out of the box.
What those Docker flags do
| Flag | Why |
|---|---|
-v /var/lib/glouton:/var/lib/glouton | Persist the state file, TSDB and registration data across container restarts. |
-v /var/run/docker.sock:/var/run/docker.sock | Discover and read stats for the containers running on the host. |
-v /:/hostroot:ro | Read-only access to the host filesystem (mounts, disks, kernel cmdline, /proc/<pid> of host processes). |
--pid=host | See host processes for the process explorer and per-service discovery. |
--net=host | Read network interface metrics that match what the host sees, not the container's namespace. |
--cap-add SYS_PTRACE | Inspect process working sets and open file descriptors. |
--cap-add SYS_ADMIN | Read namespaced filesystem and cgroup information. |
For a hardened setup (no host PID/net sharing, narrower bind mounts) follow the installation documentation.
On each start Glouton posts one anonymous payload: a random per-install ID, the Glouton version and install format, OS and kernel version, CPU and memory, and the timezone. No metric values, no service names, no hostnames, no IP addresses. Opt out with GLOUTON_AGENT_TELEMETRY_ENABLE=false.
Local panel
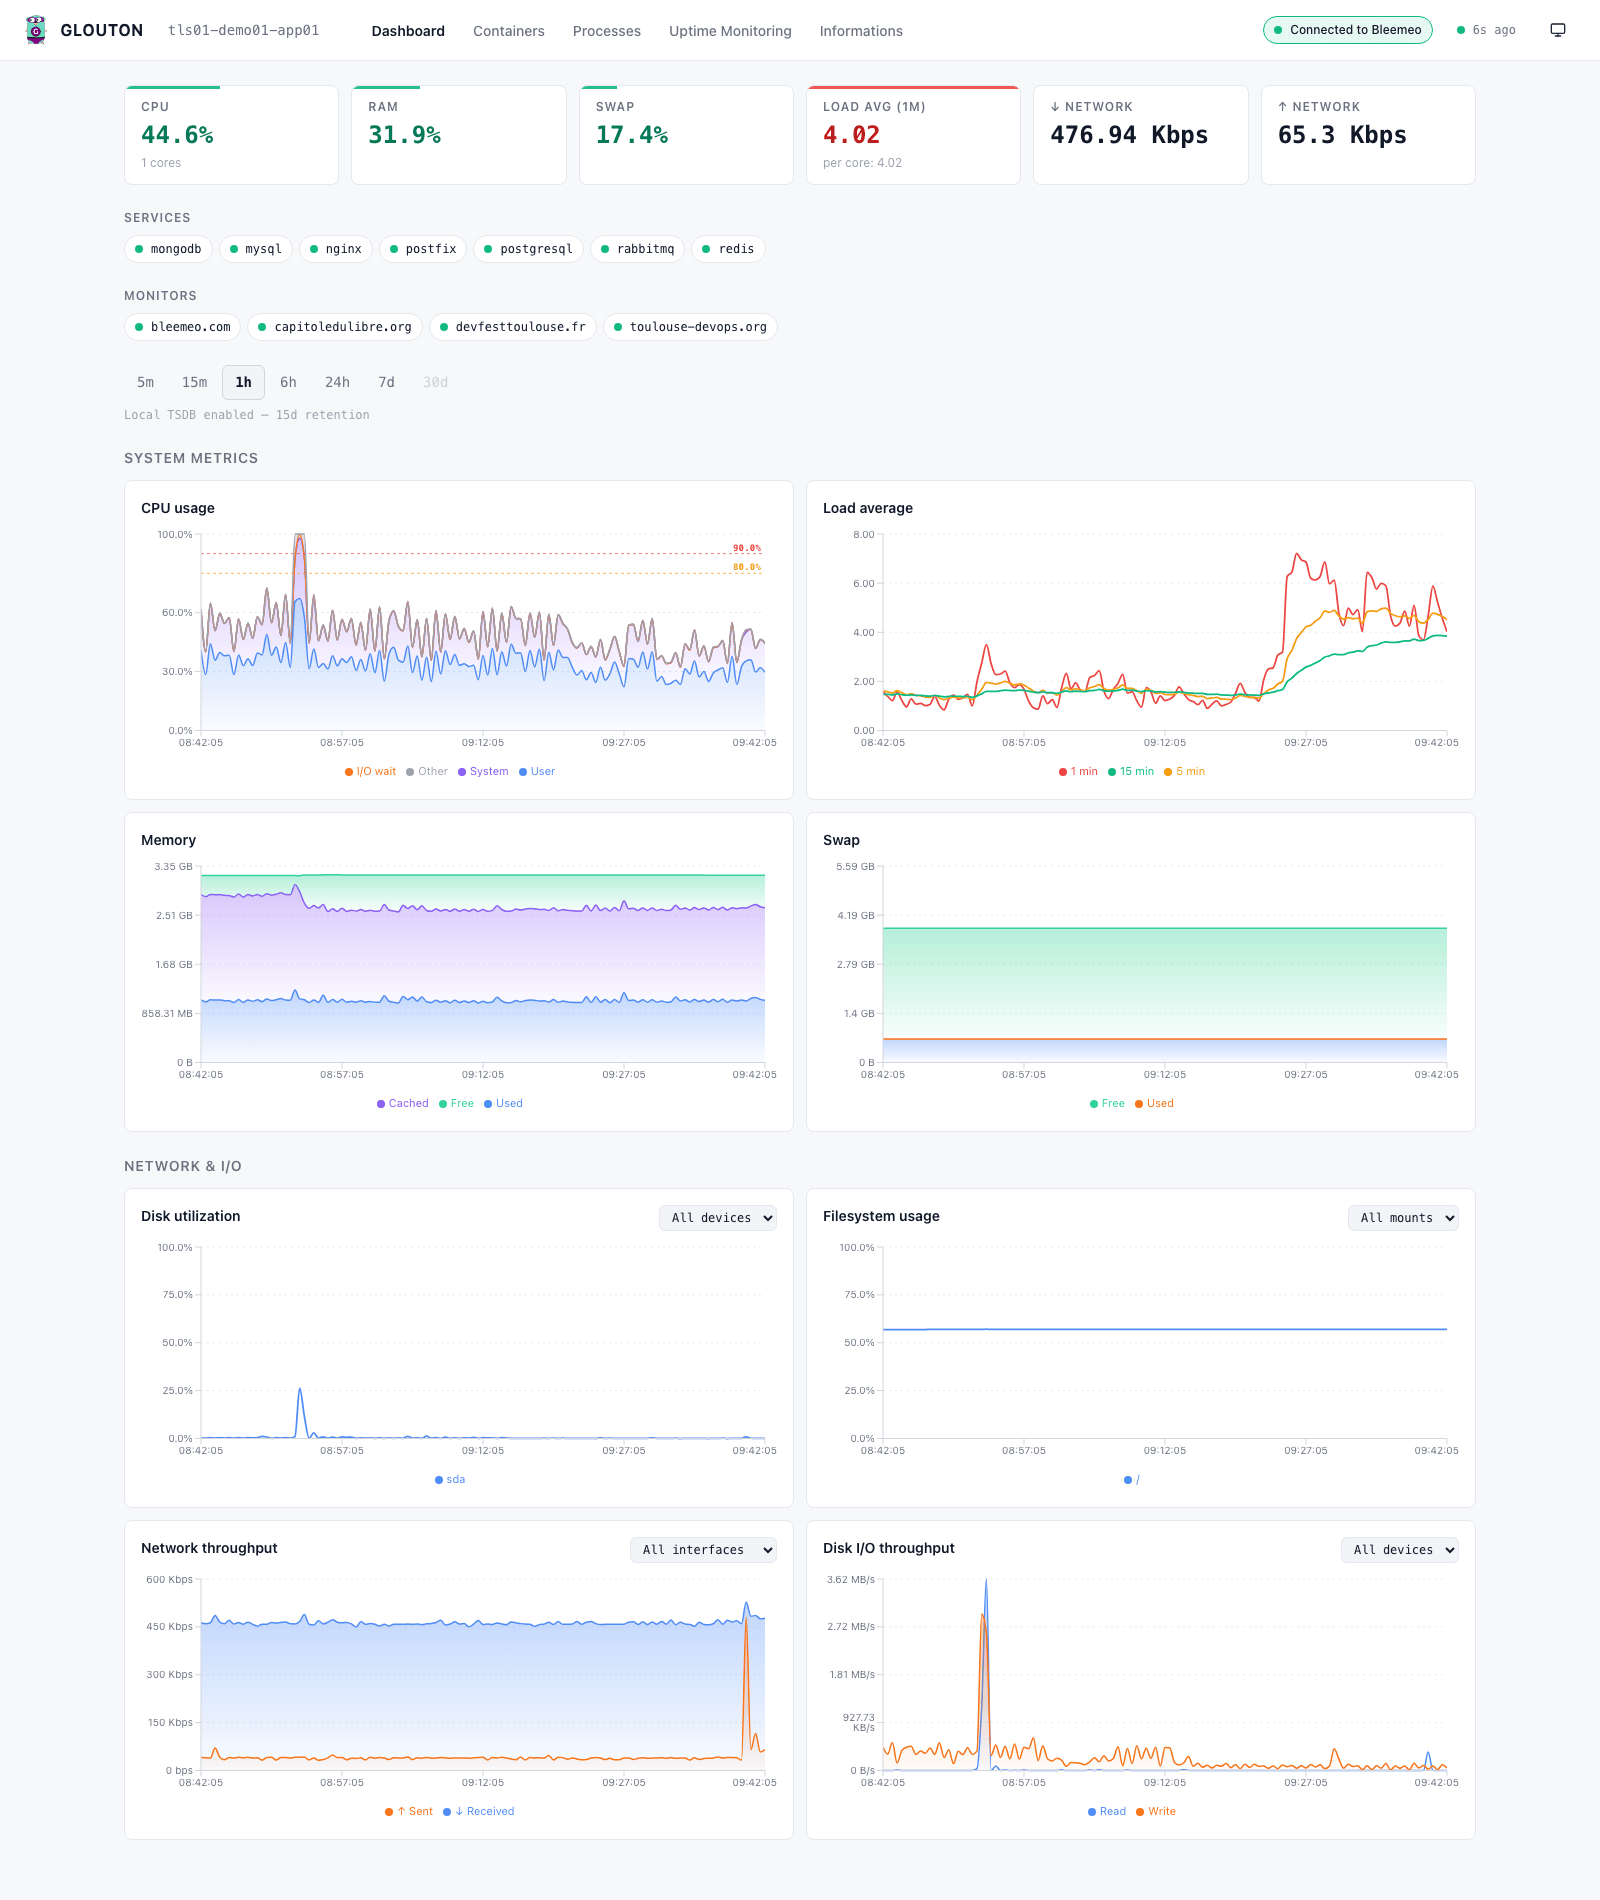
A live panel at localhost:8015
KPI cards, the discovered-services row, and status-coded charts for system metrics, network and I/O — with range-aware history from the built-in TSDB. Drag to zoom on any chart, filter filesystems and disks per device or mount, and the theme follows your system.
What it does
One binary: collect, store, surface
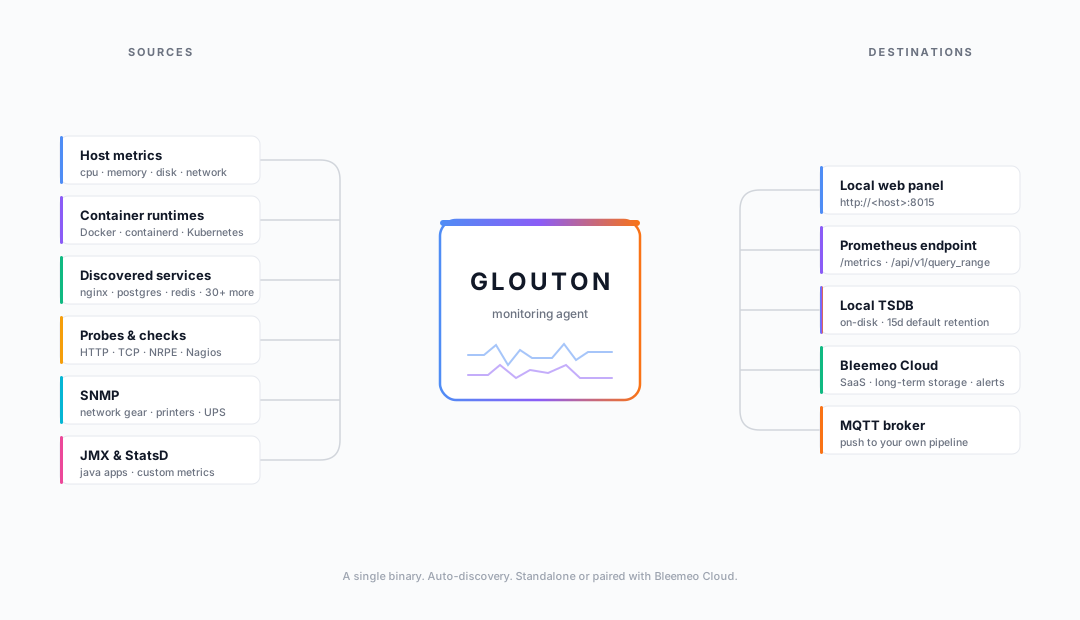
Glouton auto-discovers what is running on your host or in your containers, collects the right metrics and checks, stores them locally, and surfaces everything in a panel and a Prometheus-compatible API. Forwarding anywhere else is optional.
The TSDB head accounts for roughly half of the resident memory and stays bounded by metric cardinality, not by retention — keeping more history on disk does not cost RAM.
Collect
- Auto-discovery of running services with curated metric sets — 50+ apps and protocols (nginx, postgres, redis…).
- Container runtimes: Docker (including Docker Desktop on macOS, auto-detected), containerd, Kubernetes.
- Application metrics: scrape any Prometheus endpoint, JMX for Java apps, StatsD for custom counters and gauges.
- Log-derived metrics: parse journald, syslog, auditd or container logs through an OpenTelemetry pipeline and emit counters. The lines themselves are not stored or forwarded.
- Probes and checks: HTTP/HTTPS, TCP, custom Nagios-style scripts, NRPE.
- Network and hardware: SNMP, SMART, IPMI, NVIDIA.
- Kubernetes-native: per-pod metrics and checks driven by the cluster's own labels.
Store
- Built-in TSDB — Prometheus' on-disk engine, embedded. 15-day default retention, configurable, no extra process.
- Auto-enabled when running without Bleemeo, so the panel history works straight after docker run.
- Prometheus endpoint at /metrics for any external scraper.
- Range queries in PromQL at /api/v1/query_range, in the same shape a Prometheus server answers. Instant queries and the label endpoints are not served, so a dashboard tool still wants a real Prometheus in front.
Surface
- Status-first local panel with KPI cards, discovered services and drag-to-zoom charts.
- Per-container detail page with its own historical charts.
- Live agent logs embedded in the panel, with search and severity colouring.
- Diagnostic bundle downloadable from the UI for support cases.
Install
Every target, one agent
The same binary, the same configuration keys, whichever way you deploy it.
Docker
The quick start command above. A Docker Compose layout with jmxtrans alongside Glouton lives in the repository.
Linux packages
Officially built .deb (Debian, Ubuntu) and .rpm (RHEL, CentOS, Fedora) packages. The guide targets Bleemeo users but works just as well without an account once you set bleemeo.enable: false.
Kubernetes
kubectl apply -f k8s.yaml from the repository root gives you a default DaemonSet and its RBAC. The Helm chart and per-cluster options are in the documentation.
Windows
An MSI installer, built from packaging/windows/ in the repository and covered by the same installation documentation.
macOS has no packaged installer yet: use the published Docker image, or build from a clone (go run .). Docker Desktop and Colima sockets are auto-detected, so your containers show up without any extra config.
Staying standalone on a packaged install
Out-of-the-box defaults work for most cases. Opting out of the Bleemeo connector takes two lines — drop them into /etc/glouton/conf.d/30-install.conf on a packaged install, or pass -e GLOUTON_BLEEMEO_ENABLE=false with the Docker image.
# /etc/glouton/conf.d/30-install.conf
bleemeo:
  enable: false
The other knob people reach for is how much history the embedded TSDB keeps:
agent:
  local_store:
    retention: 15d
On Linux packages, glouton-auto-upgrade.timer is enabled by default and pulls fresh packages from the configured repository. If you would rather bump versions yourself, mask it with systemctl disable --now glouton-auto-upgrade.timer. For Docker, docker pull bleemeo/bleemeo-agent && docker restart glouton, or pin a CalVer tag.
Documentation:InstallationConfiguration referenceDiscovered services & metrics
Scope
What Glouton is not
Setting expectations honestly.
Not a log shipper
Glouton can derive metrics from application logs, and it surfaces its own runtime logs in the panel for debugging, but it does not store, index, or forward log lines themselves. Use Vector, Fluent Bit, or the OpenTelemetry collector if that is what you need.
Not a tracing / APM agent
No spans, no transaction tracking. Pair it with an OpenTelemetry SDK on your application side if you need that.
Not a Prometheus replacement on its own
Glouton serves a Prometheus-compatible endpoint and ships an embedded TSDB suitable for a single host, but for a cluster-wide setup you still want a real Prometheus, a Mimir/Thanos backend, or Bleemeo Cloud.
Outputs
Three ways out of the agent
Everything lands on local disk first. Where it goes next is your call — all three paths are first-class.
Prometheus & Grafana
Scrape /metrics with your own Prometheus, then point Grafana — or Dashglass, our own single-binary dashboard app — at that Prometheus. A ready-to-run Compose stack lives in examples/prometheus.
MQTT & SquirrelDB
Publish to any broker you control on v1/agent/<fqdn>/data as zlib-compressed JSON, and pair it with SquirrelDB Ingestor for a self-hosted, long-term Prometheus store.
Bleemeo Cloud
Forward to our SaaS for long-term retention, alerting, notifications and account-wide dashboards across every agent you run.
Questions we get about Glouton
Running it on its own, and how it relates to the tools you already have.
Can I use Glouton without a Bleemeo account?
Yes — that is the default this page starts from. Set bleemeo.enable: false (or GLOUTON_BLEEMEO_ENABLE=false with Docker) and the agent runs entirely on its own: it discovers services, collects metrics, keeps 15 days of history in its embedded TSDB, and serves both the local panel and the Prometheus endpoint. No metric value ever leaves the host — the only outbound call left is the anonymous start-up payload described in the quick start, and that switches off too.
Is Glouton really open source?
Apache License 2.0, on GitHub, and it is the same agent we run for the Bleemeo Cloud fleet — not a cut-down community edition. The Bleemeo connector is one optional output among several, not the point of the binary.
Does Glouton need an internet connection?
No. The panel, the TSDB and the Prometheus endpoint are all local to the host. Outbound traffic happens only when you enable an output — the Bleemeo connector or an MQTT broker — or leave the anonymous telemetry on.
How is it different from node_exporter or Telegraf?
It ships both: node_exporter provides the host metrics and Telegraf inputs the per-service collection, as libraries inside the one binary. What Glouton adds on top is the discovery layer that decides what to collect and check, the embedded TSDB, and the panel — one process to install instead of an exporter per service plus a Prometheus to store the result.
Can it keep more than 15 days of history locally?
Yes, agent.local_store.retention is configurable. The TSDB head stays bounded by metric cardinality rather than retention, so a longer history costs disk space, not RAM.
Which platforms are supported?
Linux through official .deb and .rpm packages, Windows through an MSI installer, Kubernetes as a DaemonSet or through the Helm chart, and Docker anywhere. macOS has no packaged installer yet: use the Docker image, or build from source — Docker Desktop and Colima sockets are auto-detected either way.
Built on tools you already trust
Glouton ships several open source projects as libraries: Prometheus for the TSDB engine, PromQL and the data model, node_exporter for host metrics, Telegraf for per-service inputs, the Blackbox exporter for HTTP/TCP/DNS probes and certificate expiry, the OpenTelemetry collector for the log-processing pipeline, and gopsutil for cross-platform process and host inspection.