Real-Time Dashboards
Visualize your infrastructure metrics with beautiful, customizable dashboards that update in real-time. Get instant insights into system performance, application health, and resource utilization across your entire stack — servers, containers, Kubernetes clusters, cloud services, and network devices — all from a single pane of glass. With 10-second metric resolution and 13 months of retention, you can debug issues as they happen or analyze long-term capacity trends.

Overview
What Makes Bleemeo Dashboards Different
Most monitoring platforms treat dashboards as an afterthought, handing you a blank canvas and leaving you to figure out what to display. Bleemeo takes a fundamentally different approach. From the moment the Glouton agent connects to a server, Bleemeo automatically creates a rich Agent Dashboard populated with seven dedicated tabs covering System overview, CPU, Memory, Disk, Network, Processes, and Services. You get immediate, meaningful visibility without writing a single query or dragging a single widget. For teams that need to move fast during incidents, this zero-configuration starting point is invaluable.
Data flow
How Data Flows to Your Dashboards
Near-real-time data
Behind the scenes, Bleemeo collects metrics at a 10-second resolution, which means dashboards reflect what is happening in your infrastructure right now rather than what happened minutes ago. This near-real-time granularity matters when you are diagnosing a CPU spike, tracking a memory leak, or watching a deployment roll out across a Kubernetes cluster. The data streams continuously into the Bleemeo Cloud, where it is stored for a full 13 months. That long retention window lets you zoom out from a 15-minute incident view all the way to a year-long capacity trend without switching tools or tiers.
PromQL in the editor
For advanced users, Bleemeo offers full PromQL support directly within the dashboard editor. If you already know Prometheus query language, you can write sophisticated aggregation, filtering, and transformation queries to build highly tailored visualizations. Combine PromQL flexibility with the convenience of pre-built Agent Dashboards and you have a platform that serves both quick-glance operators and deep-dive engineers equally well.
sum by (instance) (
  rate(node_cpu_seconds_total{mode="user"}[5m])
) * 100
Annotations
Bleemeo dashboards also support annotations, a feature that lets you mark specific time ranges directly on any chart. Use annotations to document deployments, configuration changes, planned maintenance windows, or incident timelines. When you return to a dashboard days or weeks later, those markers provide immediate context about what happened and why metrics shifted. Annotations transform dashboards from passive displays into living records of your infrastructure's history.
Capabilities
Dashboard Features
Real-Time Updates
Metrics are collected at 10-second resolution and streamed to your dashboards automatically, so you always see what is happening right now. There is no manual polling or page refresh needed. Whether you are watching a deployment roll out or tracking a sudden load spike, the data appears within seconds of being generated on your servers.
Fully Customizable
Use the intuitive drag-and-drop editor to place, resize, and rearrange widgets until the layout matches your workflow exactly. Start from one of the pre-built templates to get going quickly, or build a dashboard from scratch for full creative control. There is no limit on the number of custom dashboards you can create, so every team or project can have its own dedicated view. Organize dashboards with tags and use the search function to find any dashboard instantly across your account.
Rich Visualizations
Choose from a wide range of widget types to present data in the most meaningful way: line charts for time-series trends, bar graphs for comparisons, gauges for threshold monitoring, counters for single-value KPIs, tables for detailed breakdowns, and heatmaps for visualizing event density over time. Mix and match visualization types on a single dashboard to tell a complete story about your infrastructure.
Team Collaboration & Sharing
Share any dashboard with team members through role-based permissions that control who can view and who can edit. Organize dashboards with tags so teams can quickly find the views relevant to their services. Shared views ensure that during an incident, everyone from on-call engineers to management is looking at the same real-time data. Use dashboard templates to standardize monitoring views across your organization.
Mobile Optimized
Dashboards are fully responsive and adapt fluidly to any screen size, from wide desktop monitors and wall-mounted TV displays to compact phone screens. Bleemeo also offers native iOS and Android applications that provide a dedicated mobile monitoring experience with push notifications for critical alerts. Check your infrastructure health on the go without sacrificing readability or functionality — every chart, widget, and metric is fully interactive on touch devices.
Multi-Service View
Bring together metrics from bare-metal servers, Kubernetes clusters, cloud services, network devices, and application-level instrumentation into a single unified dashboard. This cross-stack visibility lets you correlate a database slowdown with a network saturation event or a pod eviction, dramatically reducing the time it takes to identify root causes.
Out of the box
Pre-Built Dashboards
Get started instantly with our pre-configured dashboards for common use cases
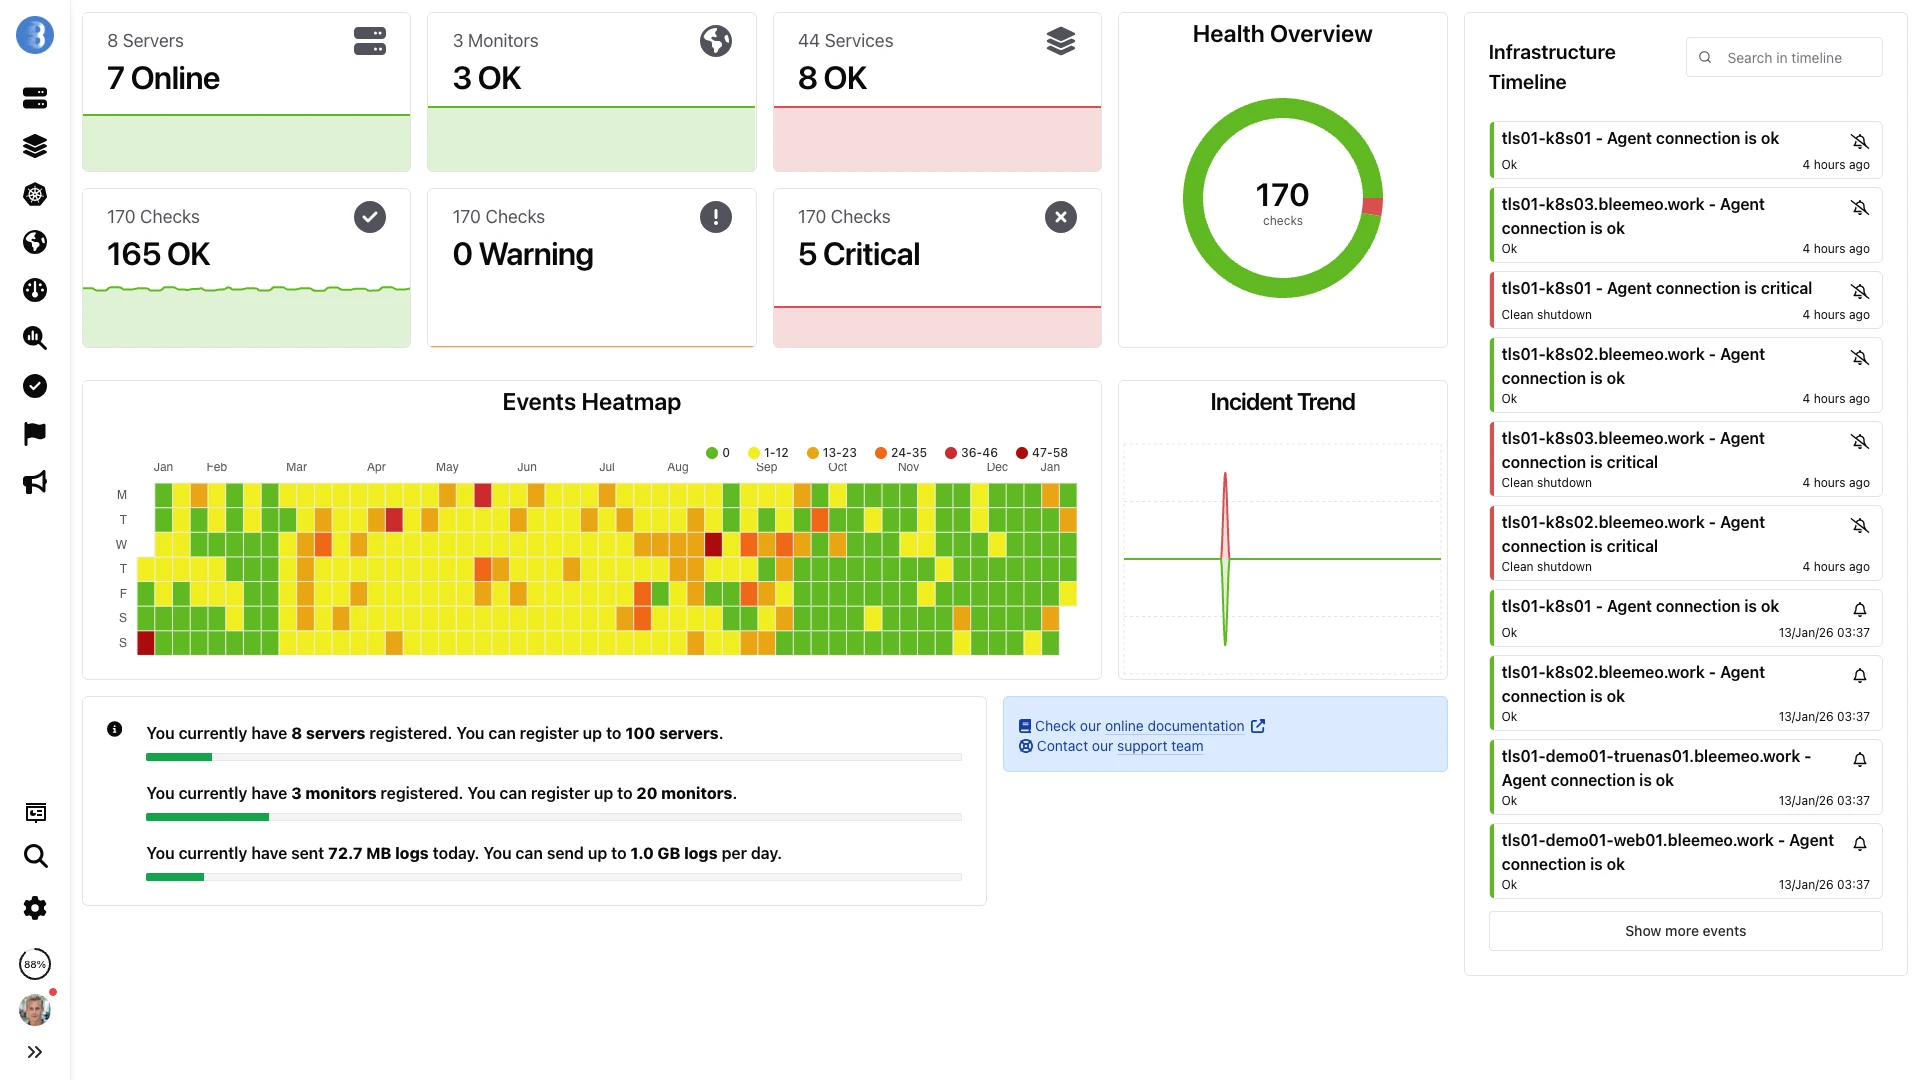
Infrastructure Overview
High-level view of your entire infrastructure health, capacity, and performance. See aggregate health scores at a glance, track capacity trends over time, and instantly identify the top resource consumers across all your monitored hosts.
- Total server count and status
- Aggregate CPU and memory usage
- Network traffic overview
- Top resource consumers
- Service health summary
- Active alert count
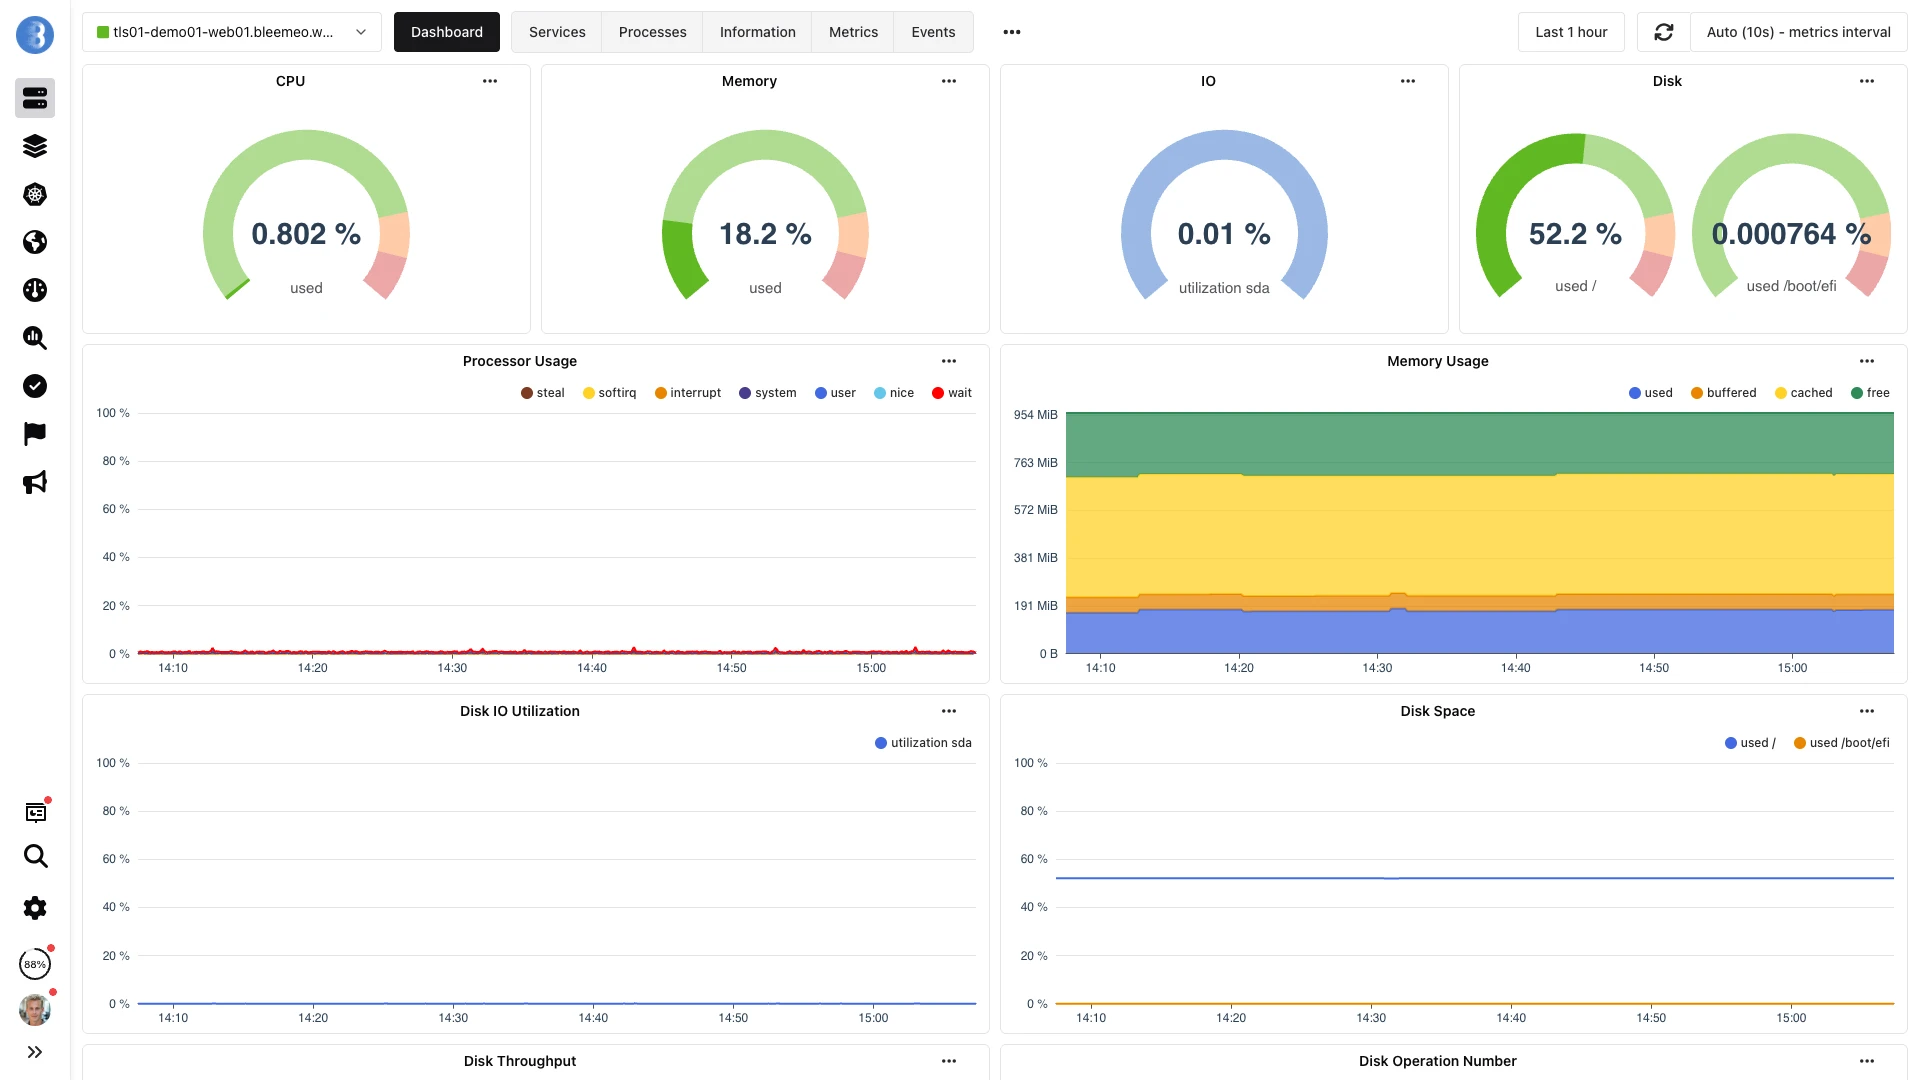
Server Details
Deep dive into individual server metrics and performance characteristics. Each Agent Dashboard is automatically organized into 7 tabs (System, CPU, Memory, Disk, Network, Processes, and Services) so you can navigate from a high-level summary to granular details in a single click.
- CPU cores utilization
- Memory usage breakdown
- Disk I/O and space
- Network interfaces
- Process list and resource usage
- Service discovery results
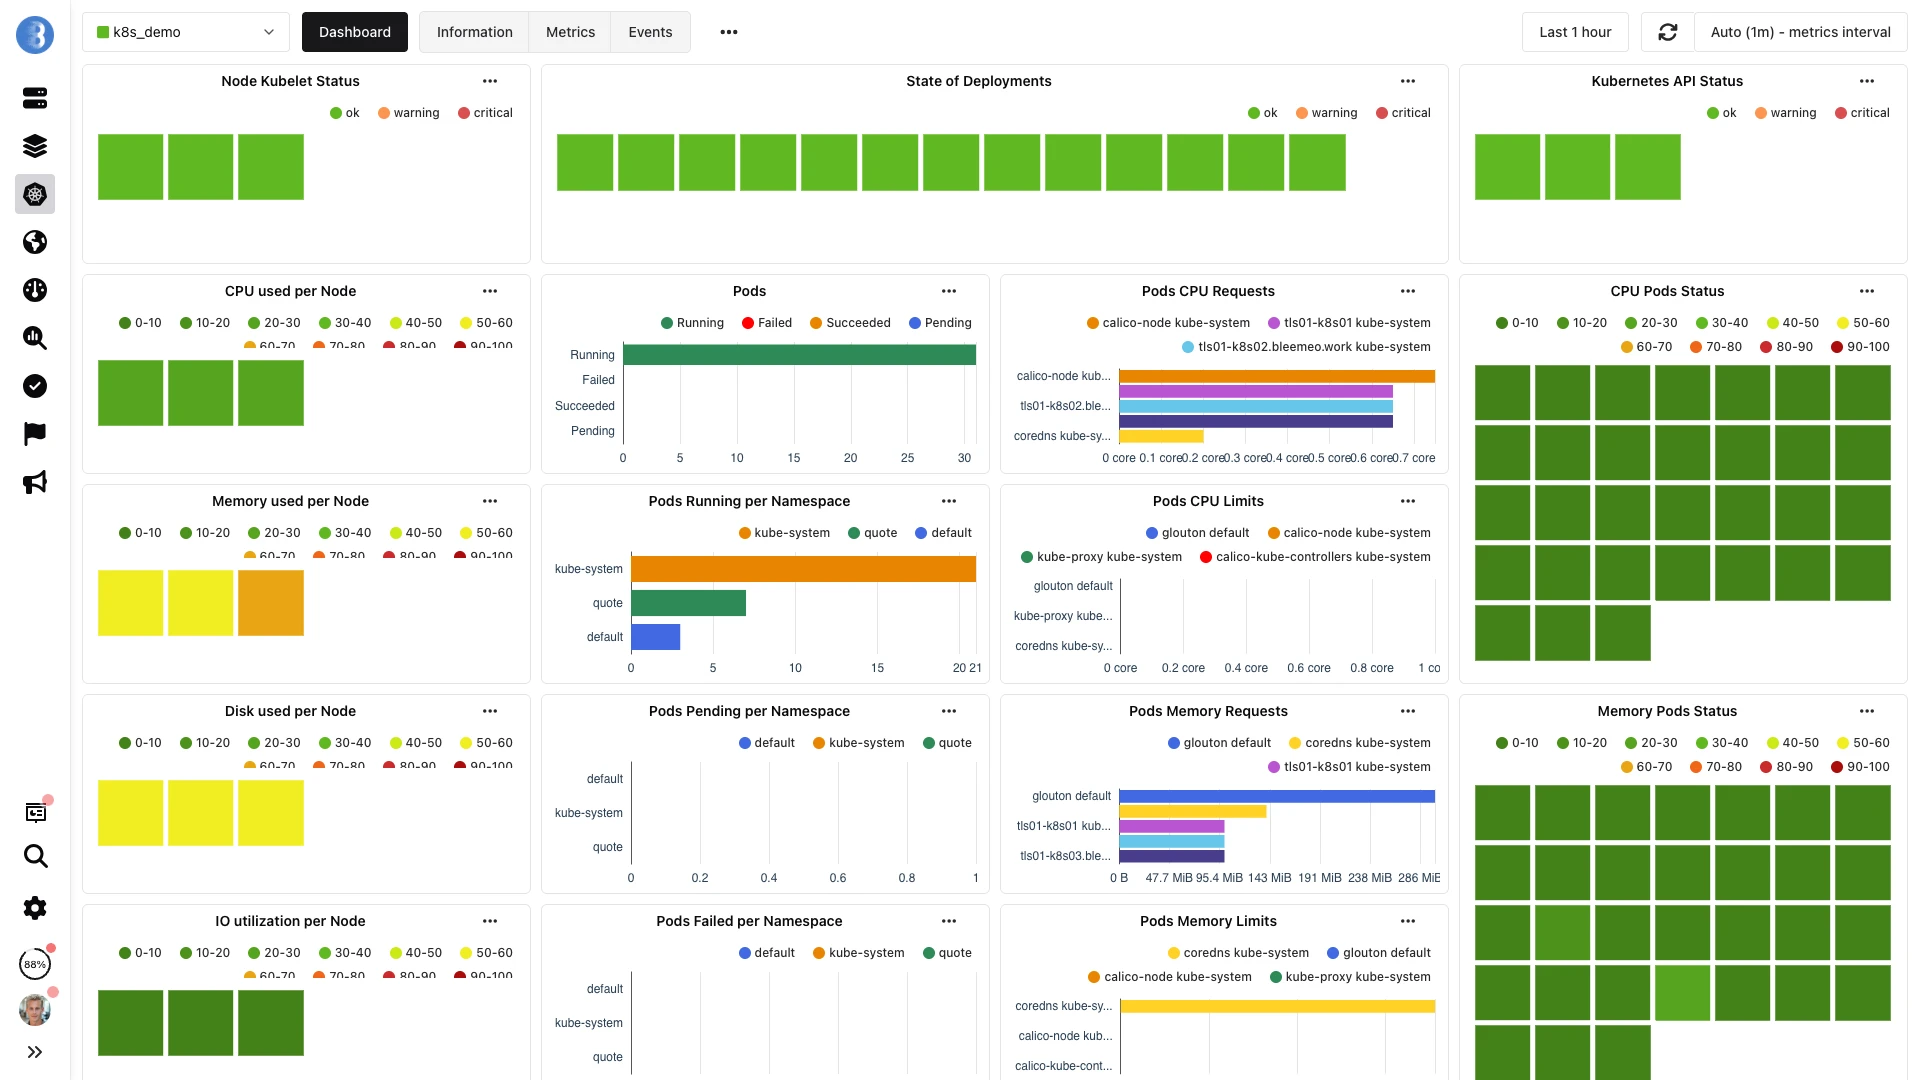
Kubernetes Cluster
Monitor your Kubernetes infrastructure with cluster-specific metrics. View pod status broken down by namespace, track node resource allocation and scheduling pressure, and monitor container restart counts to catch crashloop issues before they impact users.
- Node status and resources
- Pod health and restarts
- Container metrics
- Service endpoints
- Deployment rollout status
- Namespace resource quotas
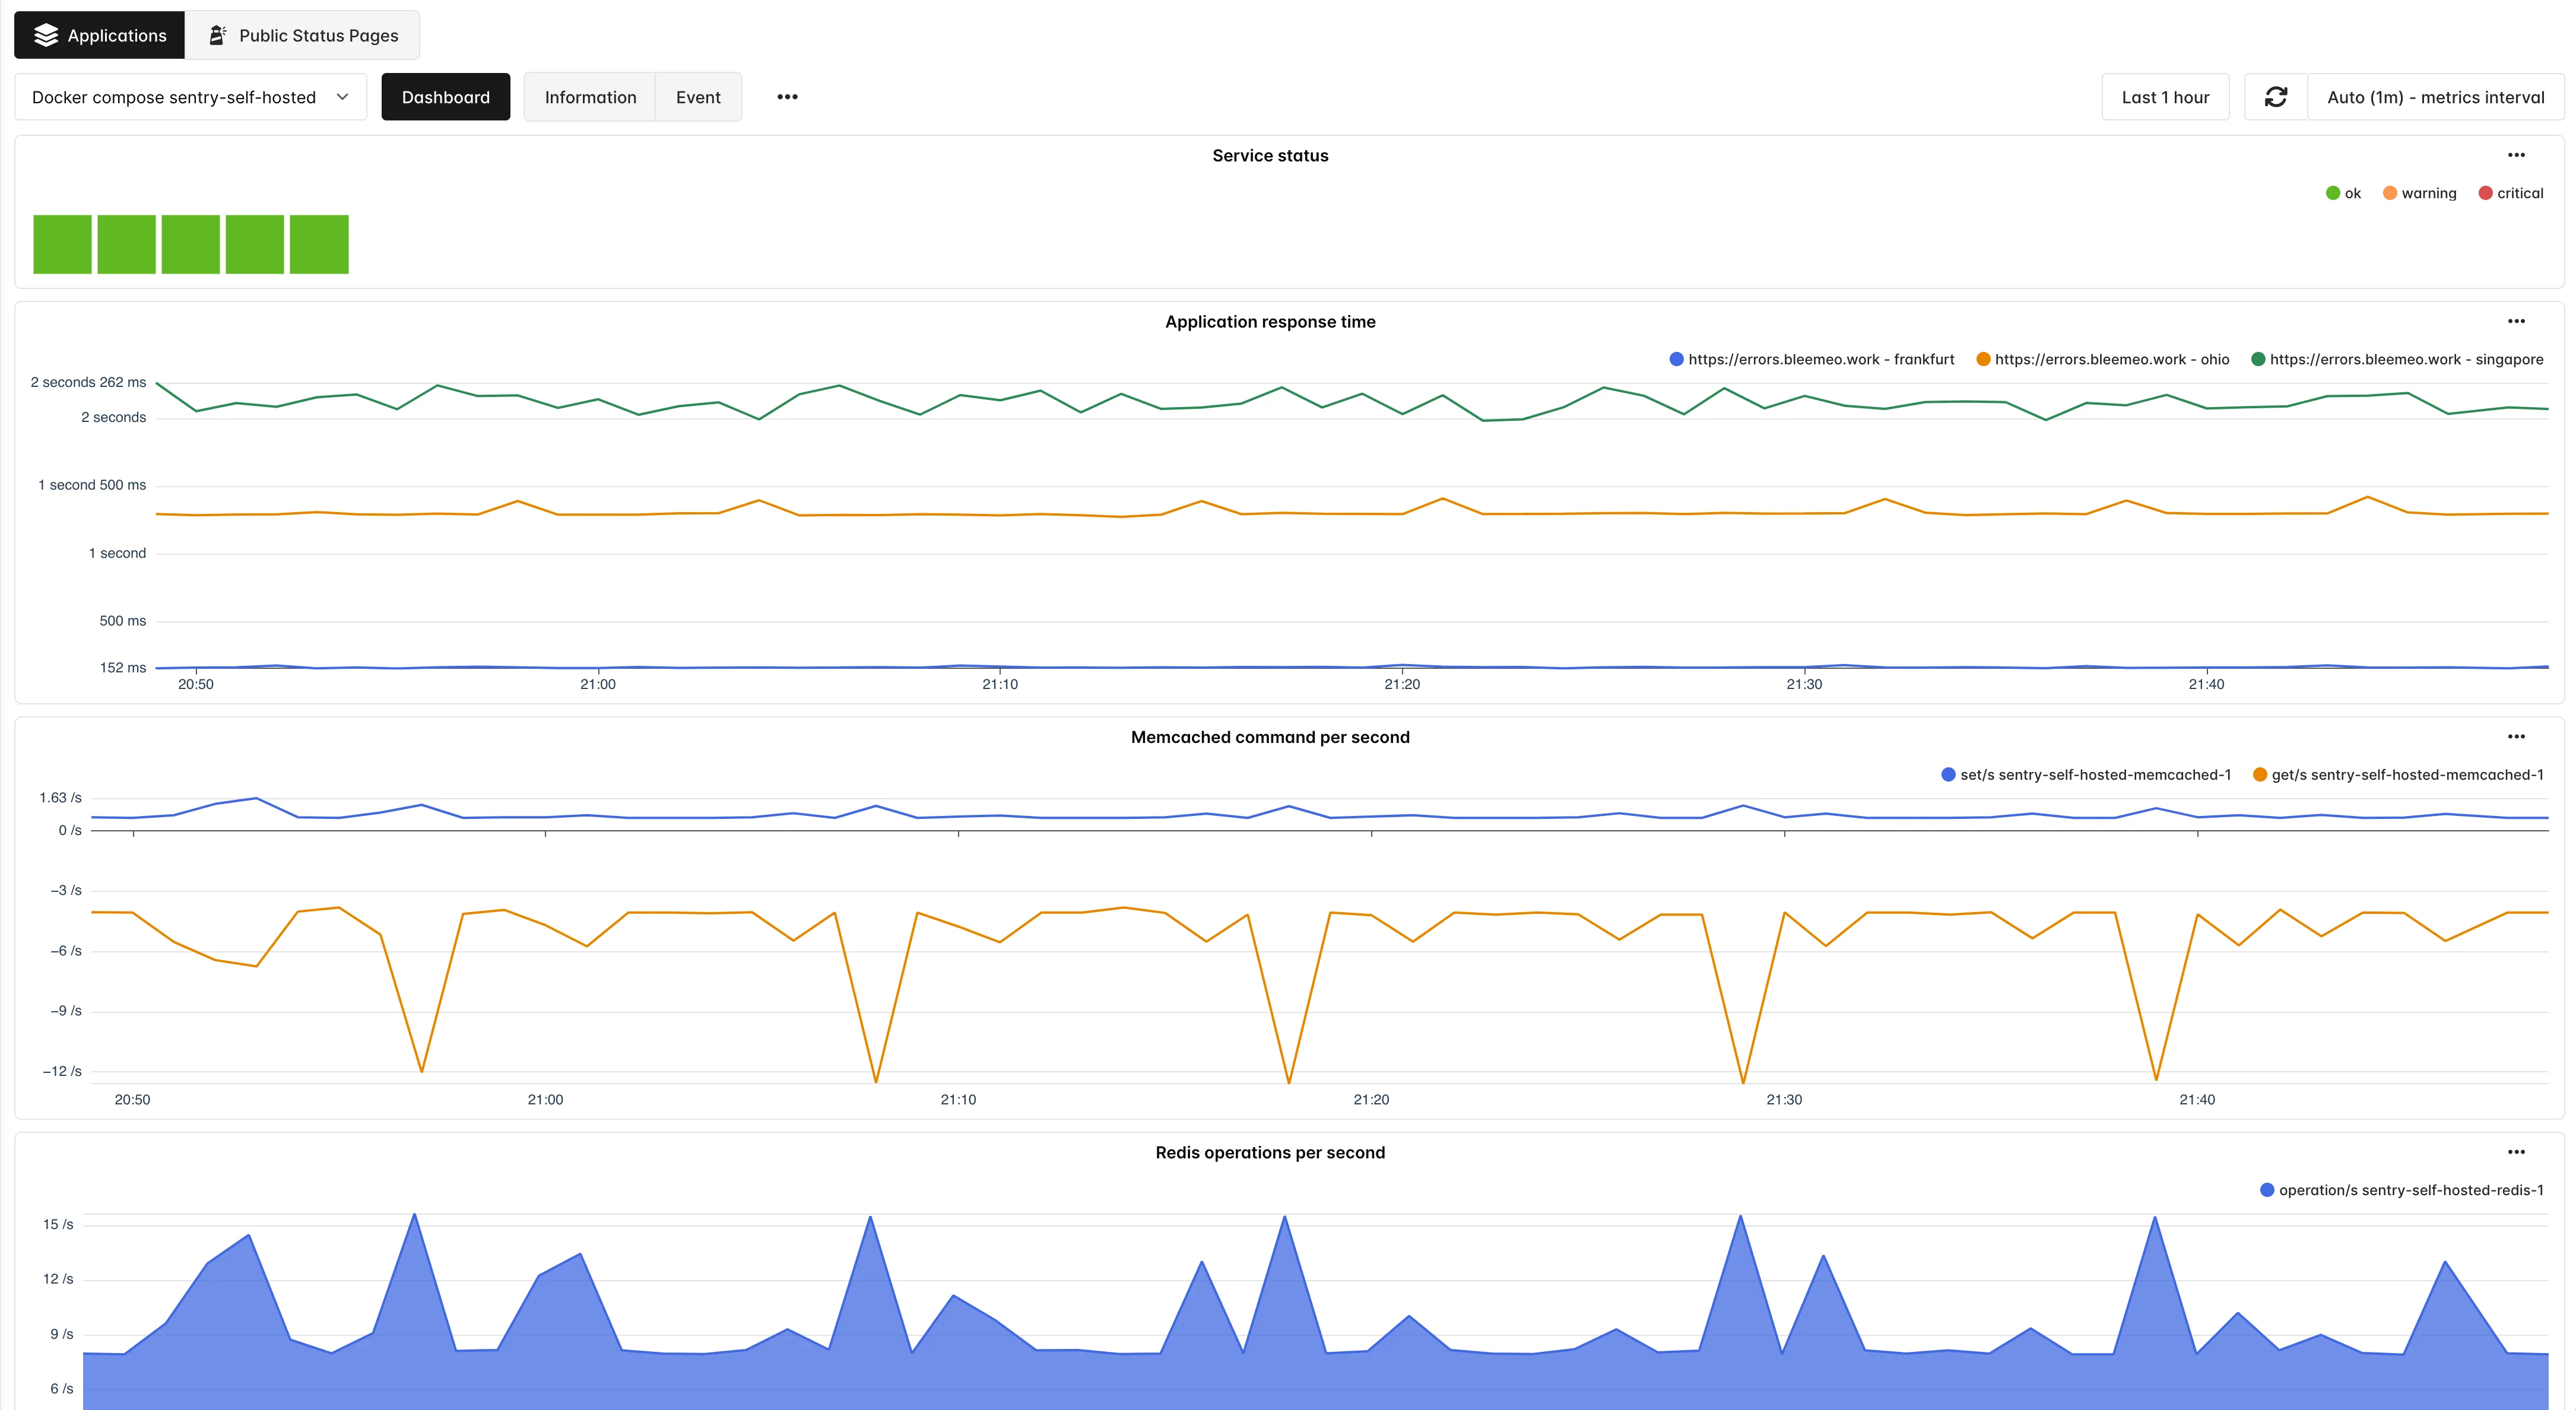
Application Services
Track application-specific metrics for auto-discovered services including databases, web servers, message queues, and caches. Monitor response time percentiles (p50, p95, p99) alongside error rate trending so you can spot degradation patterns before they escalate into outages.
- Response times
- Request rates
- Error rates
- Queue depths
- Connection pool usage
- Cache hit/miss ratios
Specialized views
Beyond Pre-Built: Dashboard Templates & Status Pages
Dashboard Templates
Bleemeo goes beyond standard dashboards with specialized views designed for different workflows. Dashboard Templates let you define a standard layout once and apply it across your infrastructure — create a template for your web servers, and every new web server automatically gets a dashboard with the same metrics and layout. This ensures consistency across teams and environments without manual duplication.
Status Dashboards
Status Dashboards provide a consolidated view of all current issues across your infrastructure. Instead of checking multiple dashboards, your team sees a single page showing which servers, services, and monitors have active problems, ordered by severity. This is the first page most on-call engineers check when they start their shift.
Health Check Dashboards
Health Check Dashboards go one step further by providing proactive recommendations. They analyze your monitoring configuration and highlight areas where coverage could be improved — missing alerts, servers without specific service monitoring, or dashboards that haven't been reviewed in months.
Customization
Build Your Perfect Dashboard
Start from pre-built templates designed for common use cases like server monitoring, Kubernetes clusters, or application performance, or build a dashboard entirely from scratch with full creative control. The intuitive drag-and-drop interface lets you place, resize, and rearrange widgets in seconds without writing any code. Dashboards can combine metrics from different sources — servers, Kubernetes, cloud providers, and network devices — into a single unified view, giving your team cross-stack visibility from one screen.
- Widget Library
Choose from dozens of pre-built visualization widgets including line charts, bar graphs, gauges, counters, tables, and heatmaps. Each widget supports PromQL queries for advanced data transformation.
- Flexible Layouts
The grid-based system adapts to any screen size automatically, from large wall-mounted displays to mobile devices. Drag and resize panels to create the exact layout your team needs.
- Time Range Selection
View metrics from the last 15 minutes for real-time debugging to the last 13 months for capacity planning and trend analysis. Compare any two time periods side by side to identify changes.
- Alert Integration
Active alerts appear directly on dashboards with severity indicators and timestamps. Click any alert to see the triggering metric, threshold details, and a link to the full event history.

PromQL
Custom widgets, driven by PromQL
Stack response rate, total volume and latency in a single PromQL-driven dashboard. Each widget is a query, each query is preserved across the 13 months retention window.

Want to go further? Learn how to create custom dashboards, configure widgets with PromQL queries, and build dashboard templates for your team.
Read the DocumentationFrequently Asked Questions
Everything you need to know about Bleemeo's dashboards
How often do dashboards update?
Bleemeo dashboards update in real-time, typically refreshing every few seconds. Metrics are collected at 10-second intervals from your infrastructure, and dashboards reflect this data as soon as it's received. There's no need to manually refresh - changes in your infrastructure appear automatically.
Can I create custom dashboards?
Yes, Bleemeo offers fully customizable dashboards. You can start from scratch or use pre-built templates. The drag-and-drop interface lets you add, resize, and arrange widgets freely. Choose from various visualization types (line charts, bar graphs, gauges, counters), select which metrics to display, and configure time ranges. You can create unlimited custom dashboards.
What types of visualizations are available?
Bleemeo provides multiple visualization types: Line charts for time-series data and trends, Bar graphs for comparisons, Gauges for current values against thresholds, Counters for single metrics, Tables for detailed data views, and Heatmaps for event density. You can combine multiple visualization types in a single dashboard.
Can I share dashboards with my team?
Yes, dashboards support team collaboration. You can share dashboards with team members who have access to your Bleemeo account. Role-based permissions control who can view or edit dashboards. This enables teams to collaborate on monitoring strategies and ensures everyone has visibility into the metrics that matter to them.
Do dashboards work on mobile devices?
Yes, dashboards are fully responsive and optimized for all screen sizes. Whether you're using a phone, tablet, or desktop, the dashboard layout adapts automatically. You can also use the Bleemeo mobile app (iOS and Android) for dedicated mobile monitoring with push notifications for alerts.
What pre-built dashboards are available?
Bleemeo includes pre-built dashboards for common use cases: Infrastructure Overview (aggregate health and capacity), Server Details (individual server metrics), Kubernetes Cluster (nodes, pods, containers), Application Services (databases, web servers, queues), and dashboards for specific integrations. These are automatically populated when you add monitored resources.
How far back can I view historical data?
Bleemeo retains 13 months of metric data by default. Dashboards support flexible time range selection - from the last 15 minutes for real-time debugging to last year for trend analysis. You can also select custom date ranges to investigate specific incidents or compare performance across different time periods.
Can I combine metrics from different sources?
Yes, this is a key strength of Bleemeo's unified platform. A single dashboard can display metrics from multiple servers, Kubernetes clusters, cloud services, network devices, and applications together. This multi-service view enables correlation of metrics across your entire infrastructure for faster troubleshooting.
Are alerts shown on dashboards?
Yes, dashboards integrate with the alerting system. Active alerts are displayed directly on relevant dashboards, showing current status and severity. You can see which metrics triggered alerts and their history. This integration provides immediate context when investigating issues - you don't need to switch between dashboard and alert views.
Can I use PromQL queries in dashboards?
Yes, Bleemeo supports PromQL queries for custom metrics visualization. If you're familiar with Prometheus query language, you can create advanced queries to aggregate, transform, and filter metrics. This is particularly useful for creating custom business metrics or complex infrastructure views that go beyond pre-built widgets.