A field guide to the open monitoring protocols — Prometheus, OpenMetrics, OpenTelemetry, StatsD, Graphite and NRPE — what each does and when to use it.
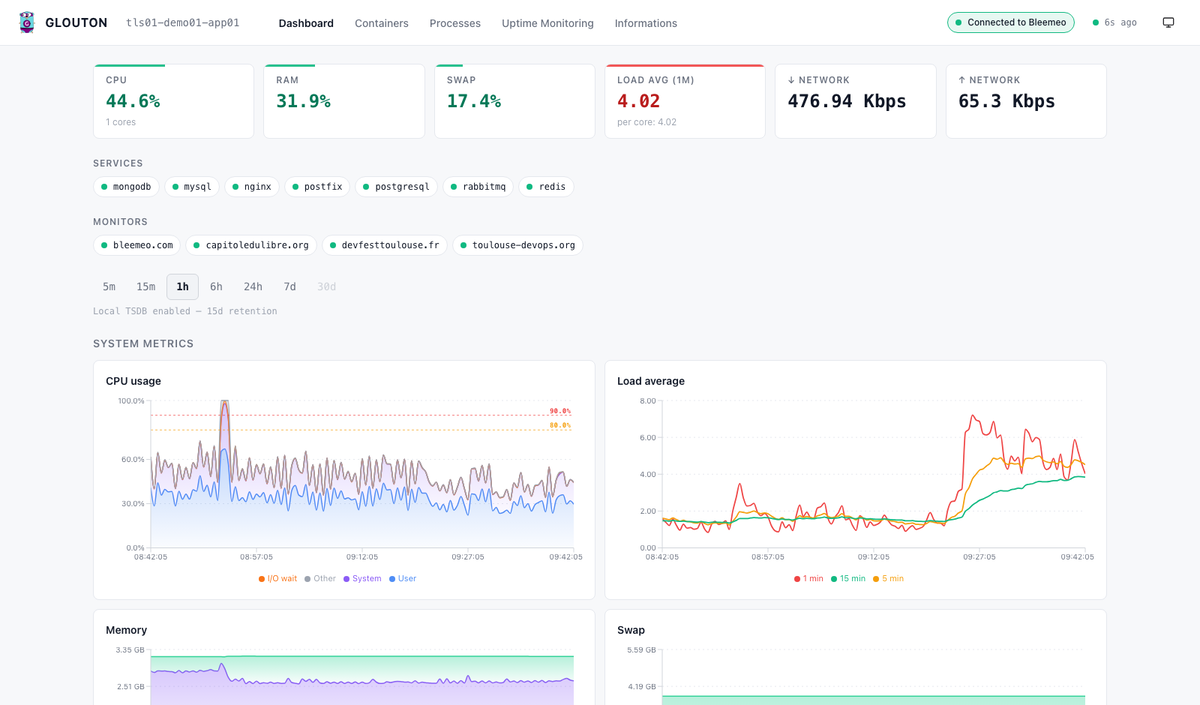
Monitor a single server with Glouton: one open-source binary that exposes Prometheus /metrics, auto-discovers services, and ships a built-in dashboard.
Start monitoring your infrastructure with the Bleemeo Community Edition and get a scalable Prometheus compatible monitoring solution supporting data push.