 Published on 08 February 2017 by Lionel Porcheron
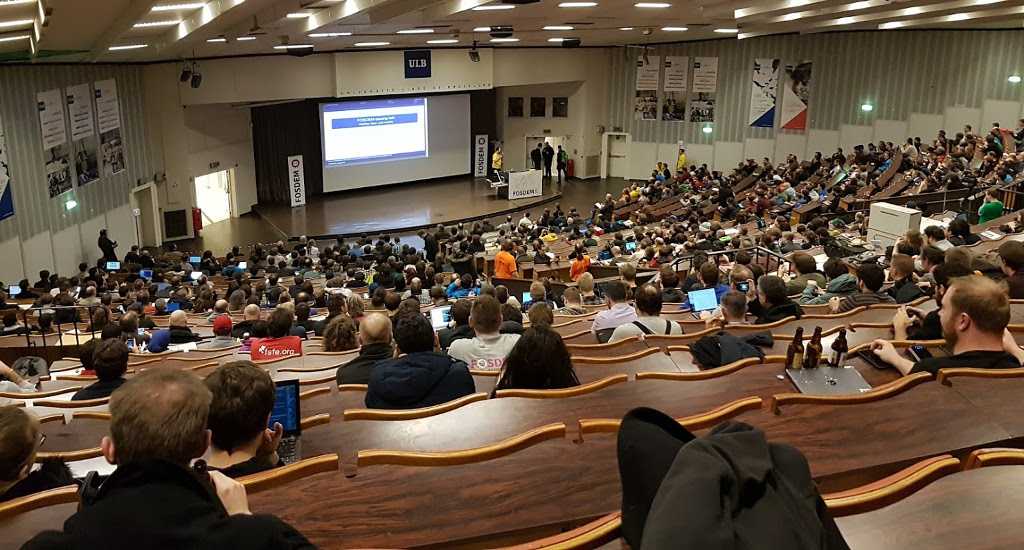
Last weekend, we were attending FOSDEM, in Brussels for one of the largest and maybe the largest open source conference over the world with about 8000 attendees from all over the world. Here is our recap.
We attended several sessions, with a particular interest on Sunday developer room "Monitoring and Cloud". On Saturday, we attended a couple of conferences on Containers and Cloud. First observation, we did not hear the word "swarm" over the weekend, but most of the conferences we attended talked about "Kubernetes"... Brandon Philips, CTO of CoreOS gave a great keynote on Kubernetes. Our saturday was also dedicated to meet old friends and speakers of Capitole du Libre, and grab feedback and ideas for next edition.
We will go in details of the "Monitoring and Cloud" sunday track.
Bingo buzzwords winners: Kubernetes & Prometheus
Our two Buzzwords for the weekend are definitely Kubernetes and Prometheus. This FOSDEM, was definitely the consecration for those two tools.
Quick survey of monitoring tools in the audience
During a time out period (issue with the video projector), the devroom organizers made a quick survey of tools used by the persons in the room (it was supposed to be a Prometheus talk at that time). But the results were surprising compared to what we have seen in other talks (Toulouse DevOps or OpenStack Day France). In the audience, we had :
- 30% Nagios users
- 30% Icinga users
- 30% Prometheus users
For comparison, at Toulouse DevOps and OpenStack Day similar survey, we had something like 80% of Nagios users and no one using Prometheus.
Talks in the "Monitoring and Cloud" devroom
Trace Everything, When APM meets SysAdmins
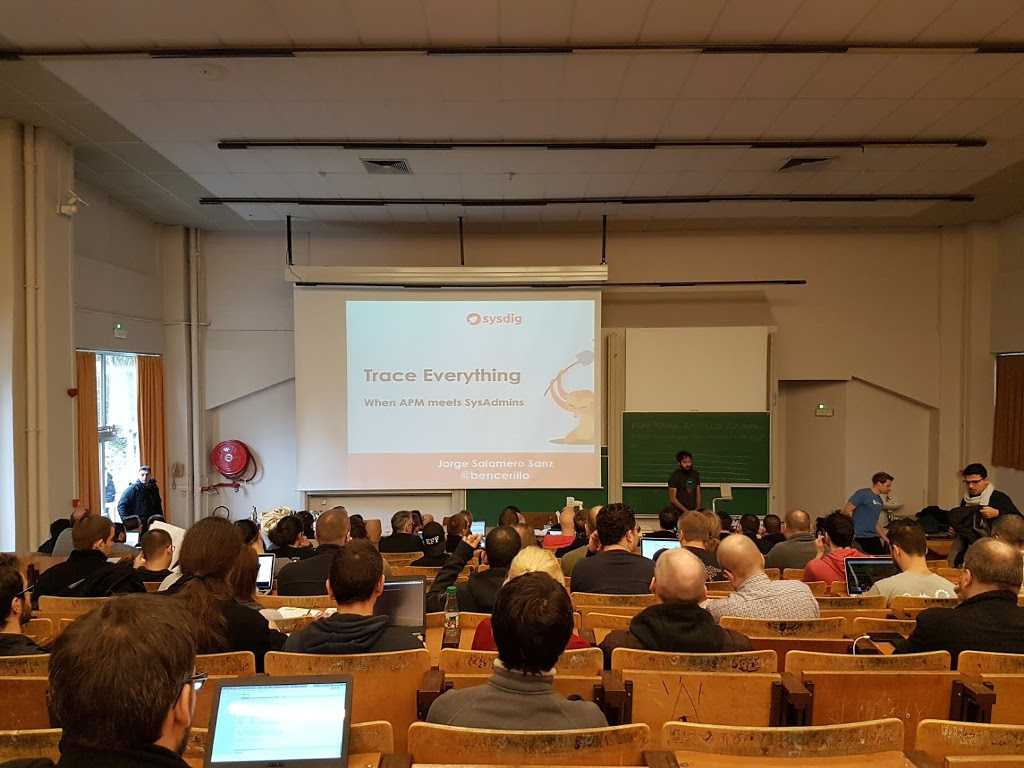
This talk was a presentation of sysdig and how to use the tool for tracing everything. sysdig aims to be the "tcpdump of the systems", you can capture all systems calls and filter what you are collecting. Like for tcpdump, you can store your capture in a file and you need a good visualizer (a ncurse visualizer is provided by default).
Over the week-end there were a couple of talks about sysdig, including a talk WTF my container just spawned a shell with falco project to detect unexpected behaviours from a container.
Graphite@Scale or How to store millions metrics per second
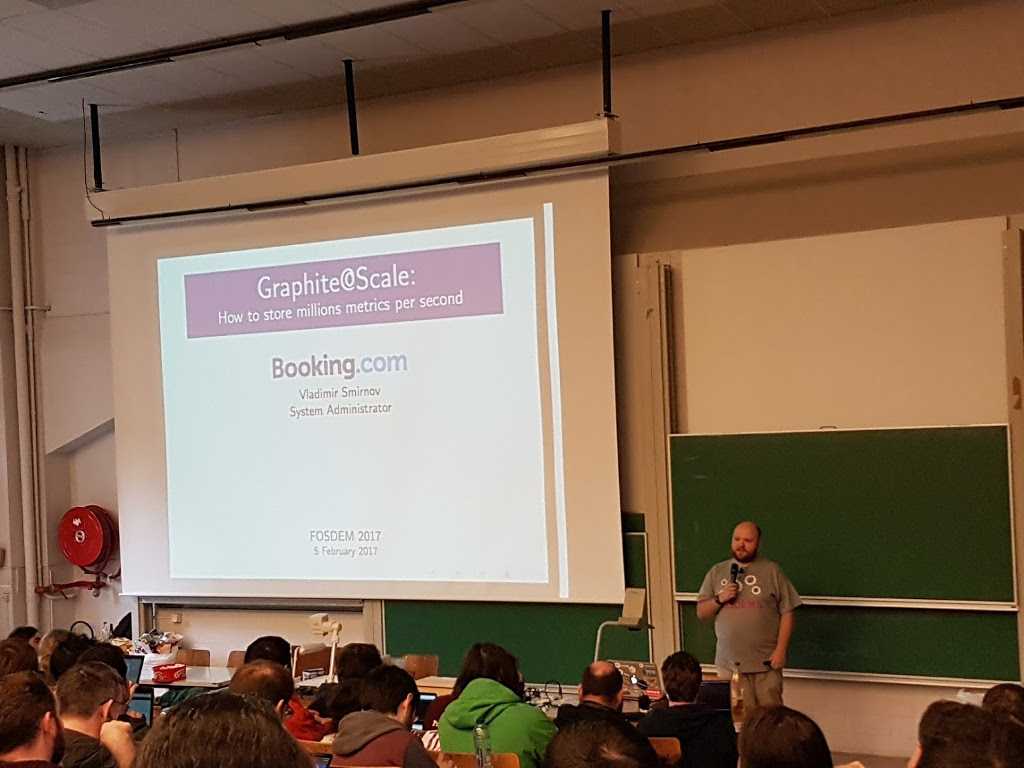
This was one of the most popular talk of the day. Graphite is the project that initiated modern and metric centric monitoring.
Vladimir Smirnov presented their usage of Graphite at booking.com. Their infrastructure is really impressive (200 storage nodes and 32 Graphite frontends !) for storing 2.5M metrics per seconds. They face performances issues on most of Graphite components and have been progressively replacing all components by compatible but optimized components (most of them are written in... Go). They are still using Whisper for the storage.
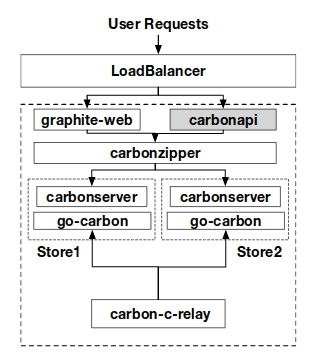
They are using:
- carbonzipper a component designed to make union of metrics and avoid hole in graphs (missing points due to replication between backends) and improve performances
- go-carbon a rewrite of carbon component in Go
- carbon-c-relay in place to avoid the graphite-relay SPOF
- carbonapi API written in Go
- carbonsearch allow to search in metrics not only with their name/path.
Their final architecture is:
Slides and video of the Vladimir talk are available on the FOSDEM website.
Alerting with Time Series (Fabian Reinartz)

Fabian Reinartz from CoreOS gave a presentation on how to have effective alerting with a time series database. Idea is to provide alerting on global issues (for example when your HTTP error rate or your response time increase) and no more on "database server is down".
Fabian explain in details how to use the alerting system included in Prometheus to generate alerts on metrics. For example, for disk filling alert, you can define:
ALERT
   DiskWillFillIn4Hours
IF
   predict_linear(node_filesystem_free{job='node'}[1h], 4*3600) < 0
FOR
   5m
ANNOTATIONS
  {
     summary     = “device filling up”,
     description = “{{$labels.device}} mounted on {{$labels.mountpoint}} on
       {{$labels.instance}} will fill up within 4 hours.”
  }
Fabian also presented the Alert Manager of Prometheus that can route alert and avoid duplicated and useless alerts.
Slides and video of the Fabian talk are available on the FOSDEM website.
While all Prometheus looks very flexible and allow to do very very powerful things here, it also appears that a complex configuration work is needed to reach an efficient and working system. But Prometheus seems to be the consensus regarding modern open source monitoring system.
Grafana - Past, present and future
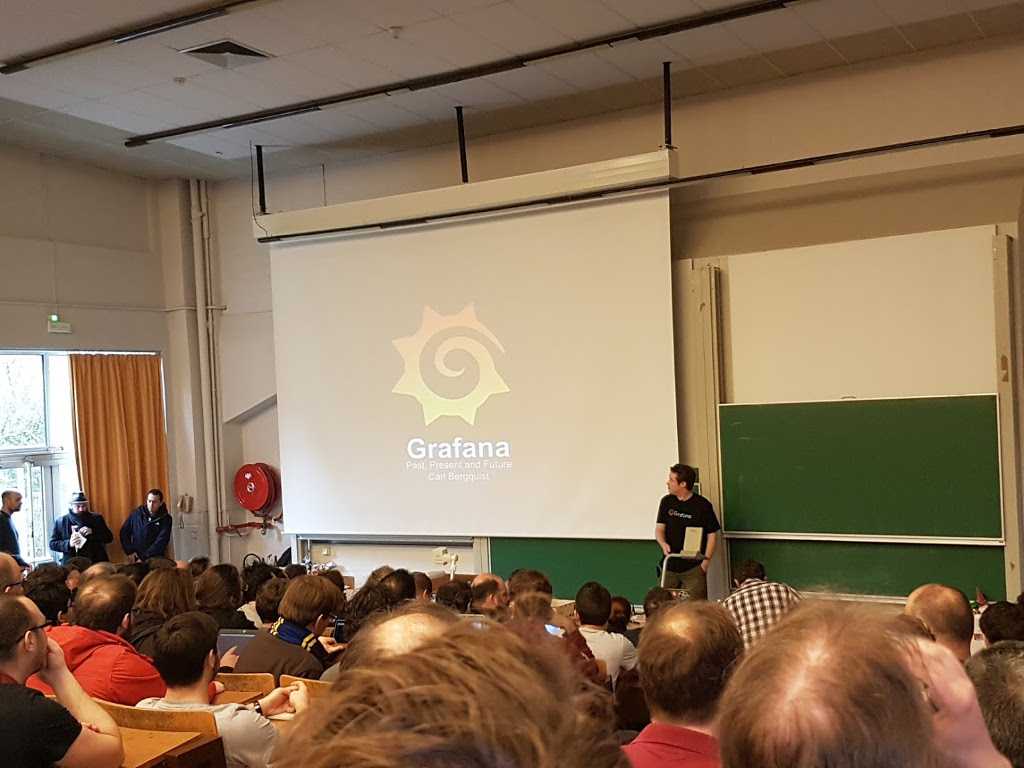
Carl Bergquist from raintank provided an overview of current Grafana features, latest features like alerting. The room was full for this talk!
Grafana project was initialy created for an internal need and has grown up to its own company since a few years. Check the slides for nice screenshots and animation of current Grafana capabilities. Project has changed a lot over the last 2 years integrating its own backend and going from v1 to v3.
For the future, Grafana is going to integrate dashboard folders (a lot of people are using organization to do that which was not expected), improve alerting (with silencing, group definition)
Slides of Carl talk are available
Monitoring Kubernetes with OMD Labs Edition and Prometheus
Michael Kraus who is a monitoring consultant guy who used to deploy Nagios provided feedback on deploying Promethus on a Kubernetes cluster for the first time.
He selected Prometheus for being open source and capable to integrate with elastic infrastructure. Documentation was fine, and he found good examples, but he faced some issues with alerting and had challenges on what to do when his Kubernetes was down as Prometheus was located on the Kubernetes cluster. He end up with two Kubernetes cluster with two Prometheus federated instances.
Slides and video of the Michael talk are available on the FOSDEM website.
This talk show that Prometheus is still young and reference architecture need to be defined. Moving from Nagios perspective to Prometheus and elastic infrastructure can be challenging.
Social aspects of change
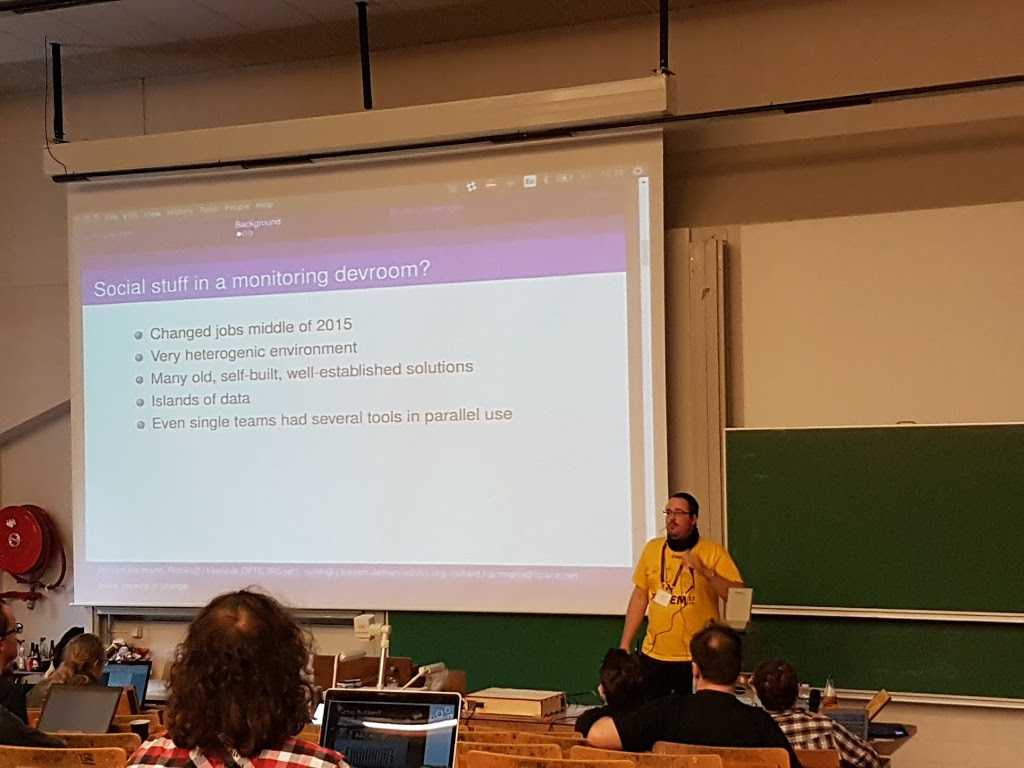
Richard Hartmann presented the non-technical challenges moving from a traditional and old infrastructure to a modern monitoring system involving non-technical staff like product owners, marketing, management.
Slides of a similar talk are available
Deploying Prometheus at Wikimedia Foundation
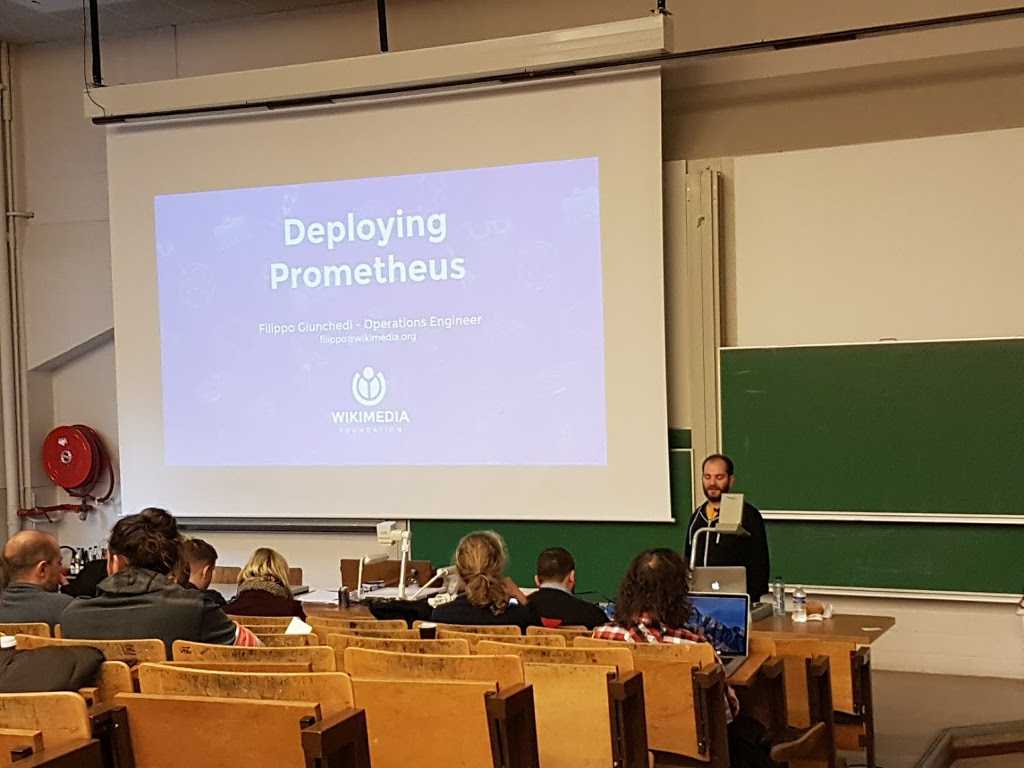
Infrastructure at Wikimedia foundation is huge and used by almost every internet user: 2 DC and more than 1400 bare metal machines. Wikimedia is using almost all monitoring tool available: Ganglia, Graphite, Grafana, Tendril, LibreNMS, Torrus, Smokeping, Icinga/Shinken.
Filippo Giunchedi explained why they decided to give Prometheus a try: for its flexibility, the query language and efficiency. They first give it a try in their lab and Prometheus replaced Ganglia for monitoring MariaDB databases. Wikimedia is still using its old tools for alerting and is now looking for coupling their Prometheus with their Kubernetes production instances.
Slides are available on the FOSDEM website
Conclusion
FOSDEM is always an interesting week-end, and a great opportunity to meet tons of people (including people from Toulouse we don't met the rest of the year). The track "Monitoring and Cloud" was interesting and clearly shows the importance taken by Prometheus during last year (who know about Prometheus one year ago?). But talks also show that deploying this tool is complex and need time and expertise. This is not a out of the box tool. There are room for SaaS services for people who don't want to run their own monitoring stack.
On the same topic, Julien Danjou wrote a blog post with slides and video of his talk on Gnocchi. This talk was in Python room but it is also related to monitoring.
Thanks to the organizers and volunteers for this great conference. As always, it was a good weekend!