Prometheus Monitoring & Cloud Monitoring combined
Start monitoring your infrastructure using the Prometheus ecosystem: standard exporters and SDK without deployment headaches using the Bleemeo Cloud Monitoring solution.
Prometheus Ecosystem
- Use standard monitoring tools from Open Source communities.
- Fetch metrics from Prometheus endpoints exposed by infrastructure applications and let the Bleemeo Cloud Monitoring platform handle them.
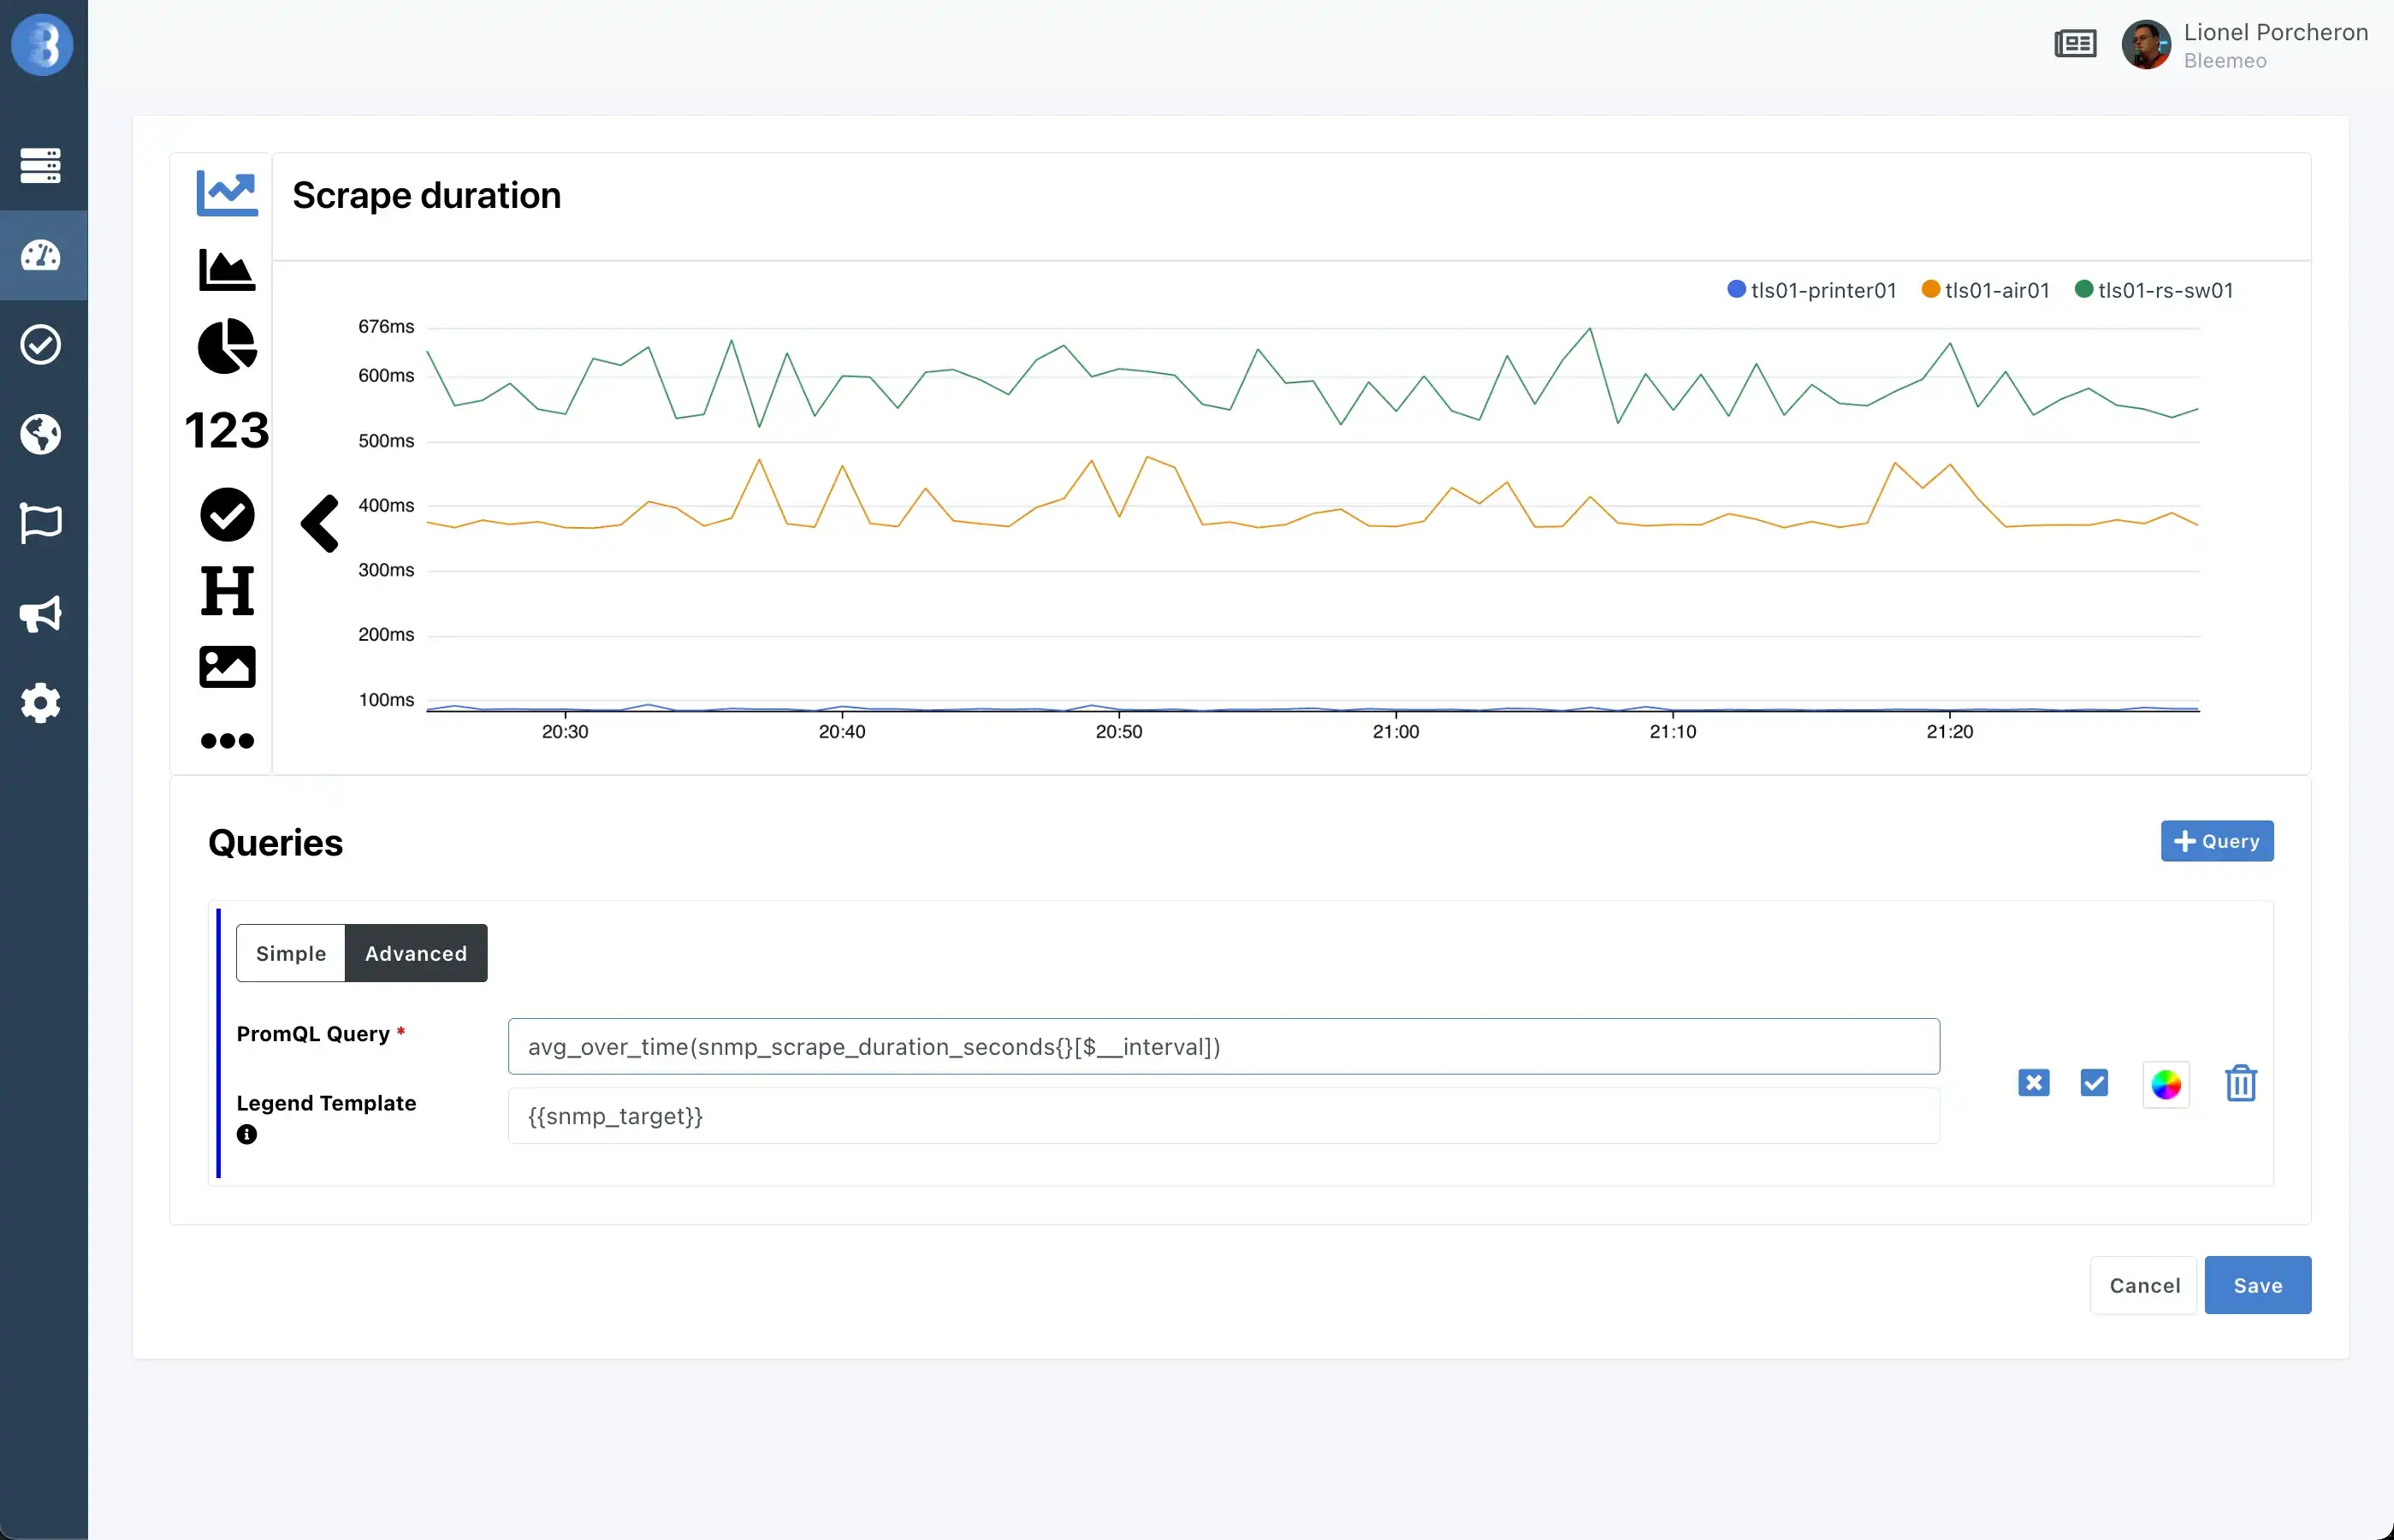
- Leverage PromQL (Prometheus Query Language) in all your dashboard requests and alert definitions.
- Instrument your code with Prometheus SDK for your favorite languages and frameworks, and get business metrics in Bleemeo.
- Use 700+ Prometheus exporters available from the community to get more metrics or write your own.
- Use Bleemeo as Prometheus in the cloud and start your monitoring project in 30 seconds. No server to deploy and maintain.


Prometheus with the power of Cloud
- No complex Prometheus server to maintain, no additional components (alert manager, long-term storage) to deploy.
- Scale your Prometheus setup as you go. No initial cost for setting up big servers for storing metrics.
- Bleemeo Prometheus setup is highly available. No complex setup to do on your side (on premise or in the cloud)
- Use PromQL queries to build your dashboards, on custom dashboards and on template dashboards.
- Use PromQL queries to define alerts, and receive notifications where they fire.
Bleemeo agent as Prometheus Hub
- Bleemeo monitoring agent can send Prometheus system metrics to Bleemeo backend.
- Bleemeo monitoring agent can scrap metrics from existing Prometheus endpoints and send them securely to the Bleemeo Cloud platform.
- Services running on your server are auto-detected by the monitoring agent and sent securely to the Bleemeo Cloud platform. Dashboards are automatically created.
- All metrics can be queried with PromQL to build your dashboards and notifications rules.


Prometheus with Steroids
- Long-term storage (13 months) out of the box. No extra setup needed.
- System and services metrics auto-detection, no need to do custom configuration or to deploy third-party exporters and software.
- Automatic dashboards creation, custom dashboards can be configured with PromQL.
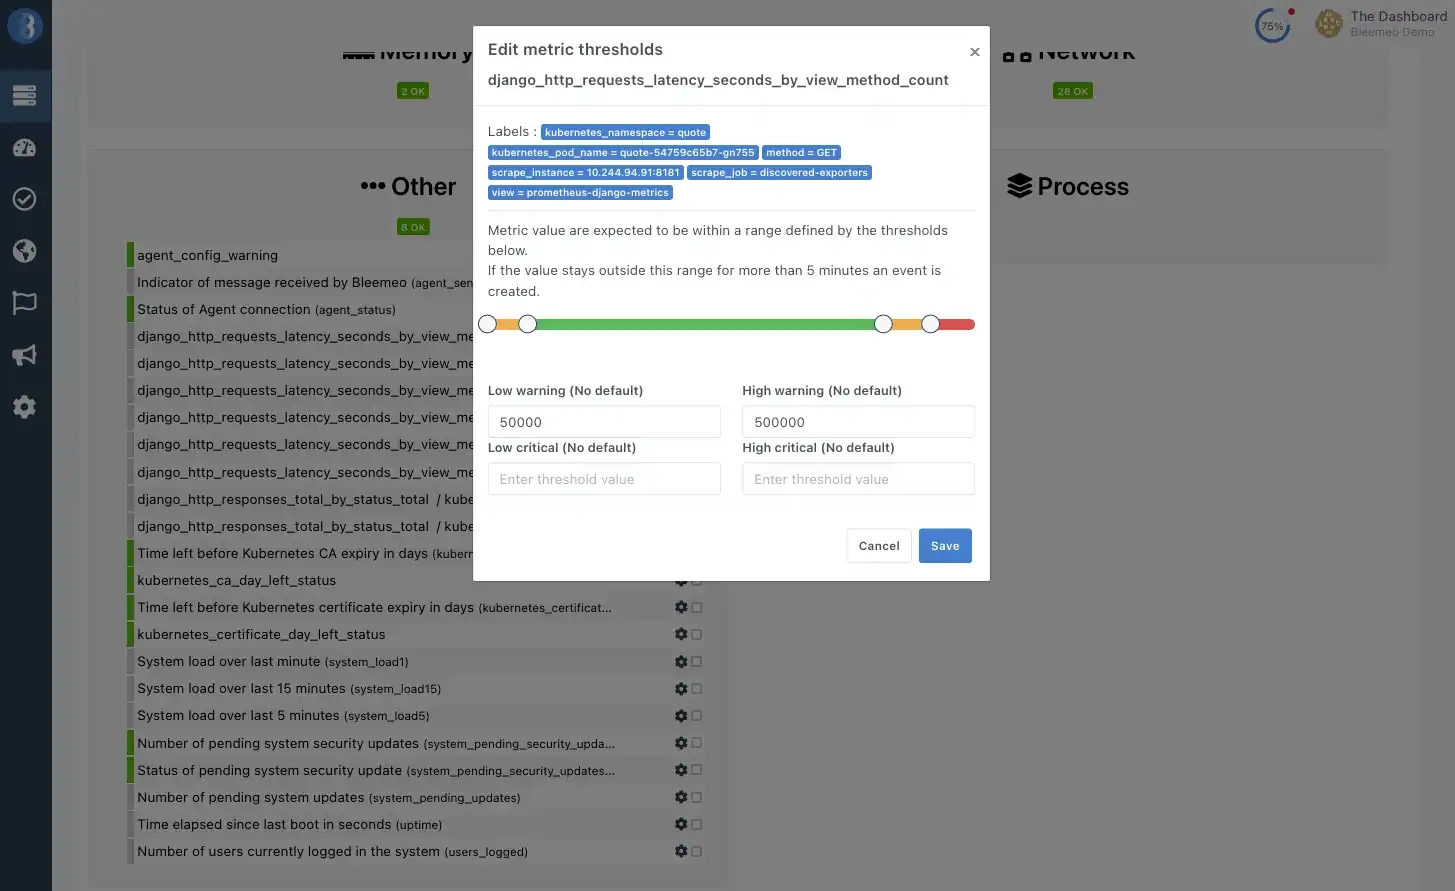
- Automatic alerts rules creation, custom alerts can be configured with PromQL.
- Your monitoring is independent from your infrastructure: if your infrastructure is failing, you are notified and can still access your monitoring.
- No extra load on your infrastructure when your ops team is accessing the tool. Your infrastructure is dedicated to your business workload.
Start Monitoring your servers, containers, and applications in 30 seconds without credit card.Start your Free Trial