Redis rarely fails loudly. It gets slower, starts evicting keys you assumed were cached, or quietly stops saving to disk — and the first symptom shows up somewhere else entirely, as a slow page or a cache-miss storm hitting your database. Which is why monitoring Redis is less about “is it up” and more about watching a handful of numbers that move before anything breaks.
This guide covers those numbers, what a bad value looks like for each, and how to collect them with Bleemeo.
What Redis is, briefly
Redis is an in-memory data structure store, open source, first released in 2009. It is the most widely deployed key-value store and the most common database in containers — used as a cache, a session store, a queue, a rate limiter and a pub/sub bus, often all at once in the same cluster.
That versatility is what makes monitoring it interesting: a Redis instance used as a cache and a Redis instance used as a job queue fail in completely different ways, and care about different metrics.
The metrics that matter
Memory, and the eviction that follows
Redis holds your data in RAM. When used_memory approaches maxmemory, the configured
maxmemory-policy decides what happens next: either Redis starts evicting keys, or it starts
refusing writes. Both are bad, and both are entirely predictable if you are watching.
Watch three things together:
used_memoryas a share ofmaxmemory. This is your headroom. Under 80% is comfortable; sustained above 90% means you are one traffic spike from eviction.evicted_keys. Should be flat at zero for anything that is not a pure cache. A non-zero rate on a session store means users are being logged out; on a queue it means jobs are disappearing.mem_fragmentation_ratio. The gap between what Redis thinks it uses and what the OS has allocated. Around 1.0–1.5 is healthy. Above 1.5 and you are wasting real RAM; below 1.0 means Redis is swapping, which is catastrophic for latency and worth an immediate page.
If maxmemory is unset — the default — Redis will happily grow until the kernel’s OOM killer
intervenes. On a container that means a restart and total data loss for a cache. Setting
maxmemory is the first thing to fix, before any monitoring.
Hit ratio, read in context
Hit ratio is keyspace_hits / (keyspace_hits + keyspace_misses). A cache in steady state
usually sits well above 90%; below that, either the working set no longer fits or something
is querying keys that were never written.
The mistake is reading it alone. A hit ratio that falls at the same moment evicted_keys
starts climbing is not telling you the cache is badly designed — it is telling you the cache
is full. Resizing the key space would be the wrong fix; adding memory or tightening TTLs is
the right one.
A hit ratio that falls without eviction is a different story: a deploy changed a cache key format, or a new code path is missing its cache layer entirely.
Latency and slow commands
Redis is single-threaded for command execution, so one slow command blocks every other
client. The usual culprits are KEYS in production code, large HGETALL calls on hashes
that grew unexpectedly, and SMEMBERS on sets nobody expected to reach a million entries.
Two signals:
blocked_clients— clients waiting onBLPOPand friends. Expected on a queue, suspicious on a cache.SLOWLOG— the commands that exceededslowlog-log-slower-than. If you set that to 10 milliseconds and the log stays empty, your latency is fine no matter what the averages say.
Averages hide this completely. One command taking 400 ms out of 50,000 taking 0.2 ms leaves no trace in a mean, and is exactly the thing your users notice.
Persistence, which fails quietly
This is the one people discover the hard way. If Redis cannot write its snapshot — disk full, permissions changed, fork failing because there is not enough free memory to copy-on-write — it keeps serving traffic normally. Nothing breaks. Your data is simply no longer being saved.
rdb_last_bgsave_statusandaof_last_write_statusshould readok. Anything else deserves an alert, not a dashboard line.rdb_changes_since_last_savegrowing without bound means snapshots are not completing.
Note the fork trap: a background save on an instance using 8 GB may need meaningfully more than 8 GB of system memory for a moment. An instance sized exactly to its host will fail its saves and tell nobody.
Replication
On a replica, master_link_status should read up. When it drops, the replica keeps
answering reads — with data that gets staler by the second. If you route reads to replicas,
that is a correctness problem masquerading as a healthy service.
The offset gap between master_repl_offset on the primary and the replica tells you how far
behind it actually is.
Connections
connected_clients against your maxclients limit, and rejected_connections,
which should be zero. A client library leaking connections shows up here days before it
causes an outage — usually as a slow, monotonic climb that no single deploy explains.
Collecting all of that with Bleemeo
After installing the agent, it discovers the Redis server — running on the host or in a container, it makes no difference — and starts collecting without any configuration.

The service dashboard you get for free
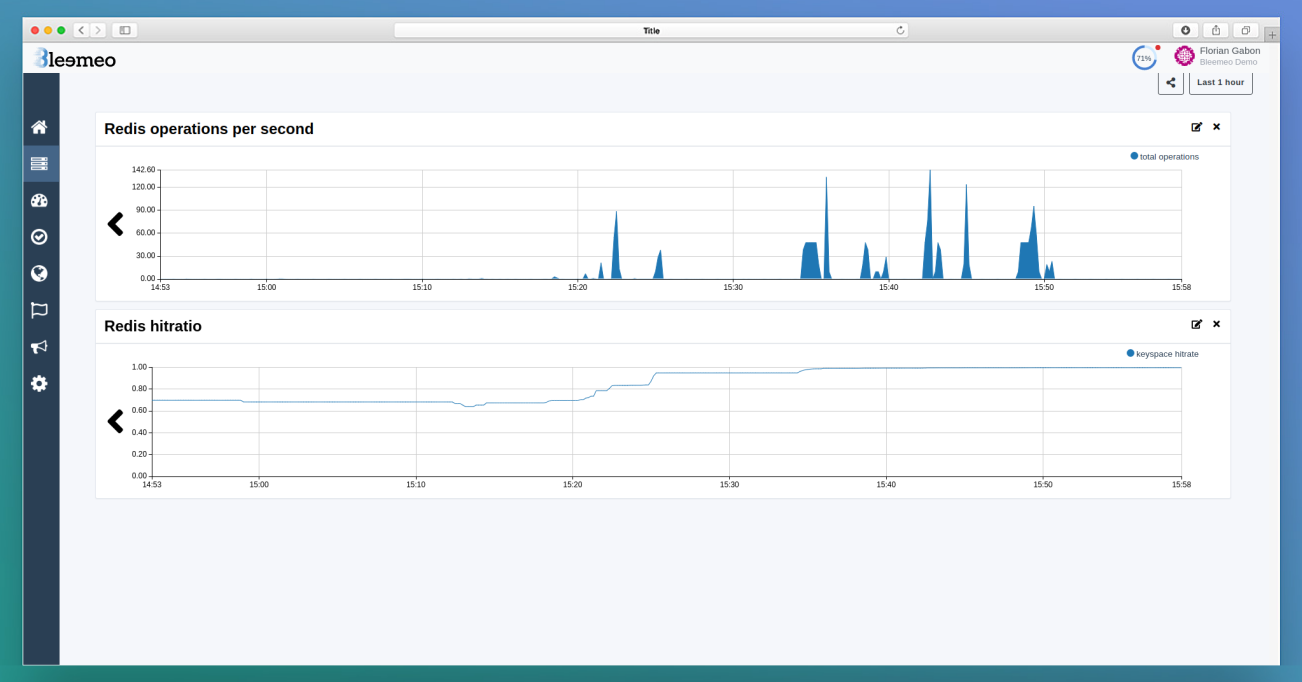
A Redis service dashboard appears in your server dashboard on its own:

It graphs operations per second and hit ratio by default. The full list of metrics collected from a Redis server is in the documentation.
Building the dashboard you actually want
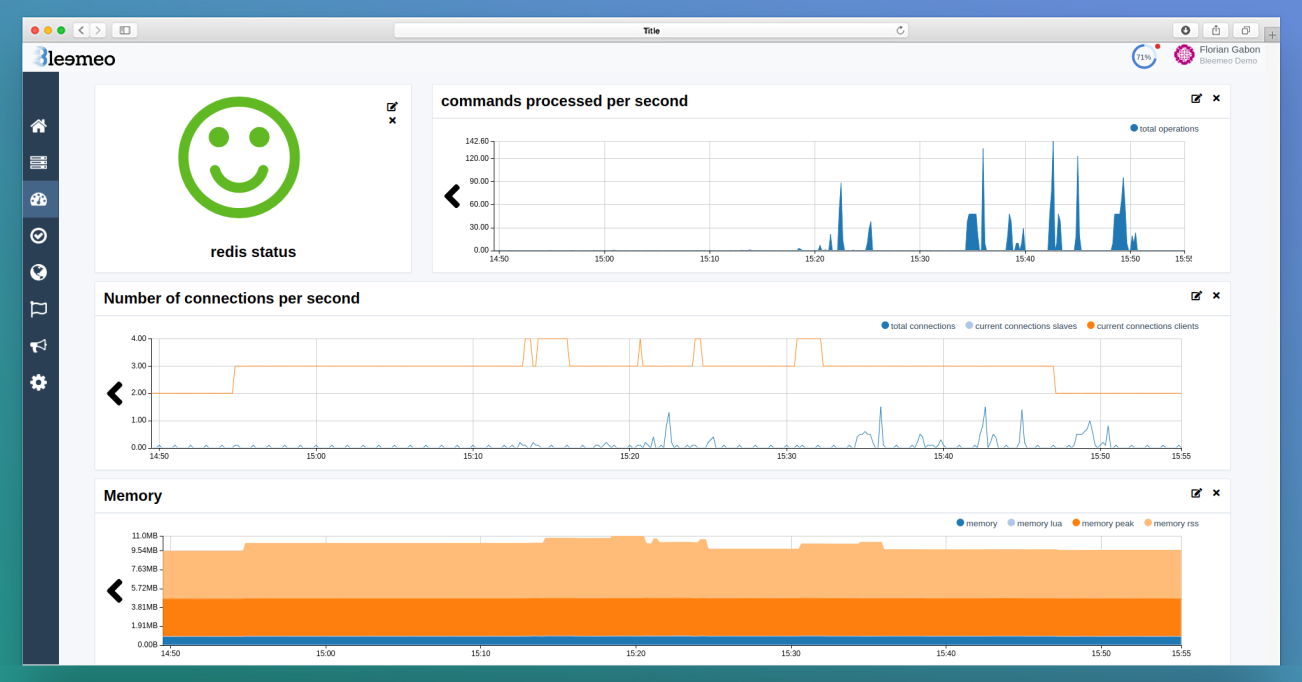
For a fuller picture, add a custom dashboard. The one below adds:
- Number of connections (client or worker) per second
- Number of connected clients
- Number of connected workers
- Status of Redis
- Memory used by Redis, as seen by the system, in bytes

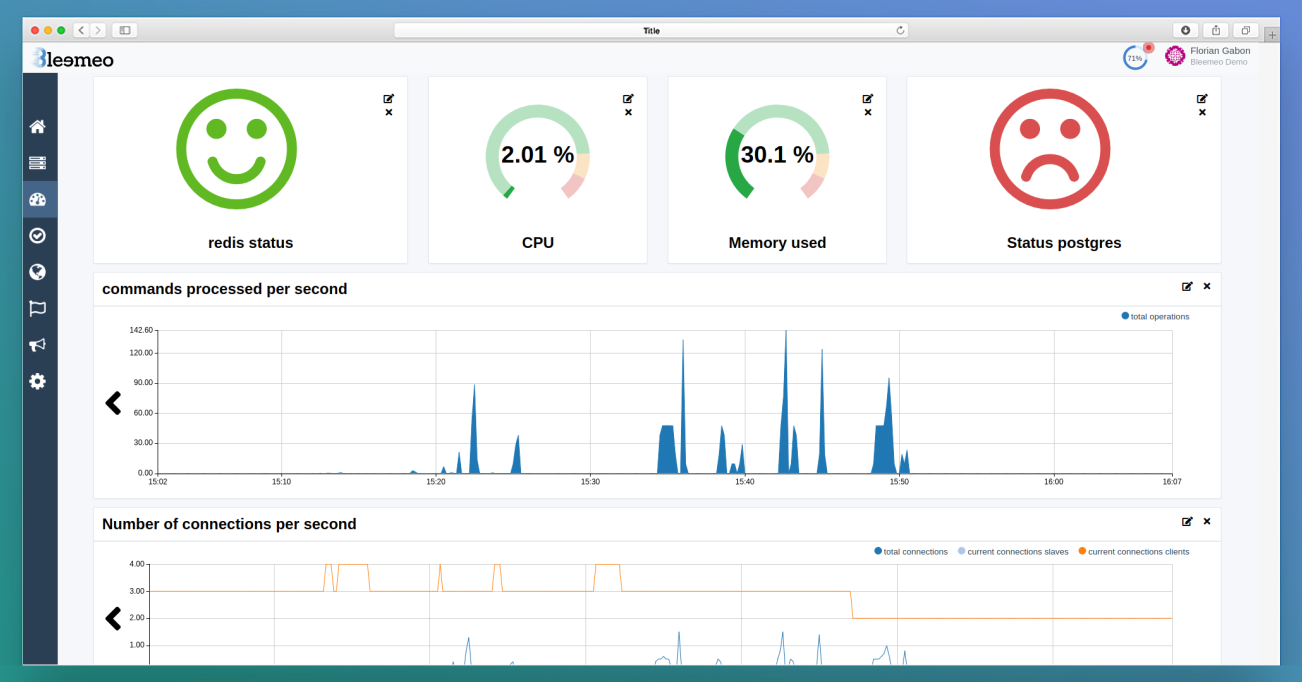
The useful move is mixing Redis metrics with everything around it. A dashboard carrying Redis memory next to the database it is caching for, and the host’s CPU, is what turns “Redis looks busy” into “Redis is evicting because the host started swapping at 14:03”:

Here that means the status of PostgreSQL, CPU used in percent, and memory used by applications in percent — three services on one screen, which is the whole point.
Which of these deserve an alert
Alert on saturation and on errors. Graph throughput.
| Alert on | Why |
|---|---|
Memory above 90% of maxmemory |
The only warning you get before eviction or write failures |
evicted_keys above zero |
On anything that is not a pure cache, this is data loss |
rdb_last_bgsave_status not ok |
Silent, and you find out when you need the backup |
mem_fragmentation_ratio below 1.0 |
Redis is swapping; latency has already collapsed |
master_link_status not up |
Replicas are serving stale reads |
rejected_connections above zero |
You are at the connection ceiling |
And resist alerting on operations per second. It is the metric everyone reaches for first, and it tells you about your traffic, not about your Redis. A quiet Sunday and a broken application produce the same graph.
Redis monitoring FAQ
What is a good Redis hit ratio?
Above 90% for a cache in steady state, but the number matters less than its trend and its context. A hit ratio falling at the same time as evicted_keys rises means the cache is full, not badly designed. A hit ratio falling on its own usually means a deploy changed a key format or a code path stopped using the cache.
Why is my Redis memory higher than the sum of my keys?
Allocator fragmentation, client output buffers, and the copy-on-write cost of a background save all sit outside your data. mem_fragmentation_ratio quantifies the first: 1.0–1.5 is normal, above 1.5 wastes real RAM, and below 1.0 means the process is swapping.
Should I monitor Redis differently when it is a queue rather than a cache?
Yes, and mostly by inverting which numbers alarm you. On a cache, evictions are routine and blocked_clients is suspicious. On a queue it is the reverse: blocked clients are how BLPOP works, and a single eviction means a job vanished. Queue depth also becomes a first-class metric, which Redis itself will not give you — you have to publish the list length as a custom metric.
Does Bleemeo need configuration to monitor Redis?
No. The agent discovers the Redis server whether it runs on the host or in a container, creates a service dashboard, and starts collecting. Configuration only comes in if Redis requires authentication or listens somewhere unusual — see the documentation.