 Published on 12 December 2021 by Florian Gabon
Most of the existing solutions for SNMP monitoring need you to configure complex dashboards. With Bleemeo, you can start in 30s to monitor your existing SNMP equipment. You need to add an extra component that will be in charge of fetching metrics of all your network equipments. For a classical Linux server, you will benefit from much more features with Bleemeo agent deployed on the system, but using SNMP for monitoring systems where you can't deploy agent (old systems like Solaris, appliances like VMware ESXi) is still useful.
We support well-known devices:
- Cisco switches, routers and firewalls from Catalyst, Nexus and ASA families
- HPe switches
- VMware ESXi appliances
- Ubiquiti switches, routers and Wifi access points
We have tested our solution with such equipment. If you have a question, or want more to be supported, you can contact us and we will consider supporting it.
For those supported devices, we will create, like we do for any server where agent is running, a default dashboard. Some metrics will also be available for configuring custom dashboards.
What is SNMP?
SNMP is the abbreviation for Simple Network Management Protocol, it's a way for different devices on a network to share information with one another. It allows devices to communicate even if the devices are different hardware and run different software. The devices that support SNMP include routers, switches, IP phones, servers, workstations, printers, ... SNMP has a simple architecture based on a client-server model.
Configure network devices with SNMP and Bleemeo
In Bleemeo, in addition to our usual monitoring agent ("Glouton"), we will use a Prometheus SNMP exporter to scrape SNMP metrics from devices. This Prometheus exporter itself is scraped as a Prometheus endpoint by Glouton to ingest metrics in our SaaS Monitoring Platform.
To monitor your SNMP devices, we provide:
- Glouton agent that you need to deploy on a server as usual.
- A Prometheus SNMP exporter available as system package and Docker image. You do need to care about configuring the Prometheus SNMP Exporter: SNMP MIB and configuration are handled by Glouton
- We build dashboards for most existing devices: Cisco equipment, HPe, Ubiquiti and other vendors.
In this example, we will add monitoring on the three equipments of our office: Ubiquiti switch, Ubiquiti WIFI access point and our HP Printer. Those three devices have SNMP activated and use "public" as community for v2 SNMP.
metric:
  snmp:
    targets:
      - initial_name: U6-Lite
        target: my-wifi-ap
      - initial_name: USW-24-PoE
        target: my-switch
      - initial_name: Office Printer
        target: 172.16.14.26
Dashboards by default
We create dashboards by default for interfaces, cpu and memory usage. Some devices may have additional information and we cover in our documentation what is graphed by default. For example, in our case, we graph the ink tank levels for our printer.
Here is an example of default dashboard for our switch with CPU usage and all interfaces state:

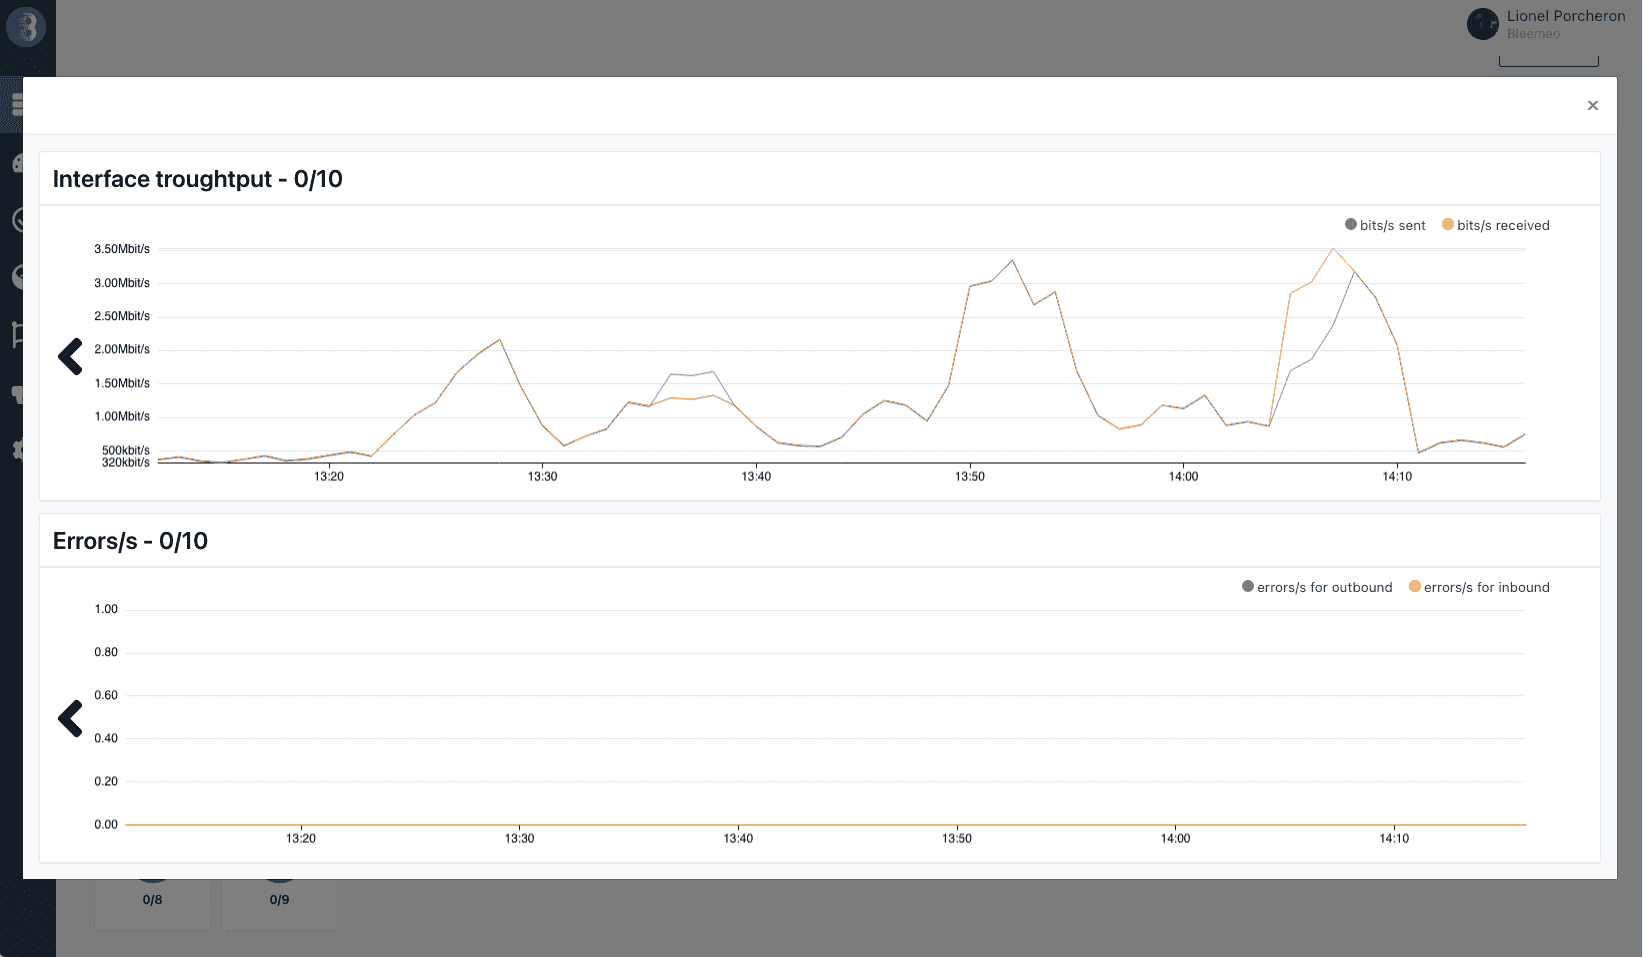
Here is another example when you click on an interface and have graph for one interface:
Create a custom dashboards
We get metrics from SNMP (through Prometheus), you can create custom dashboards with those metrics to graph what you want and mix source of data (servers, SNMP, monitors, ...).
Now let's see how to make custom dashboards that cans better meet your specific expectations. For example, we will monitor metrics:
- The PDUs returned from walk.
- The Total SNMP time scrape took (walk and processing).
- Time SNMP walk/bulkwalk took.
Here is an example of dashboard with all the traffic of our Wifi Access Point and time for scrapping SNMP targets:
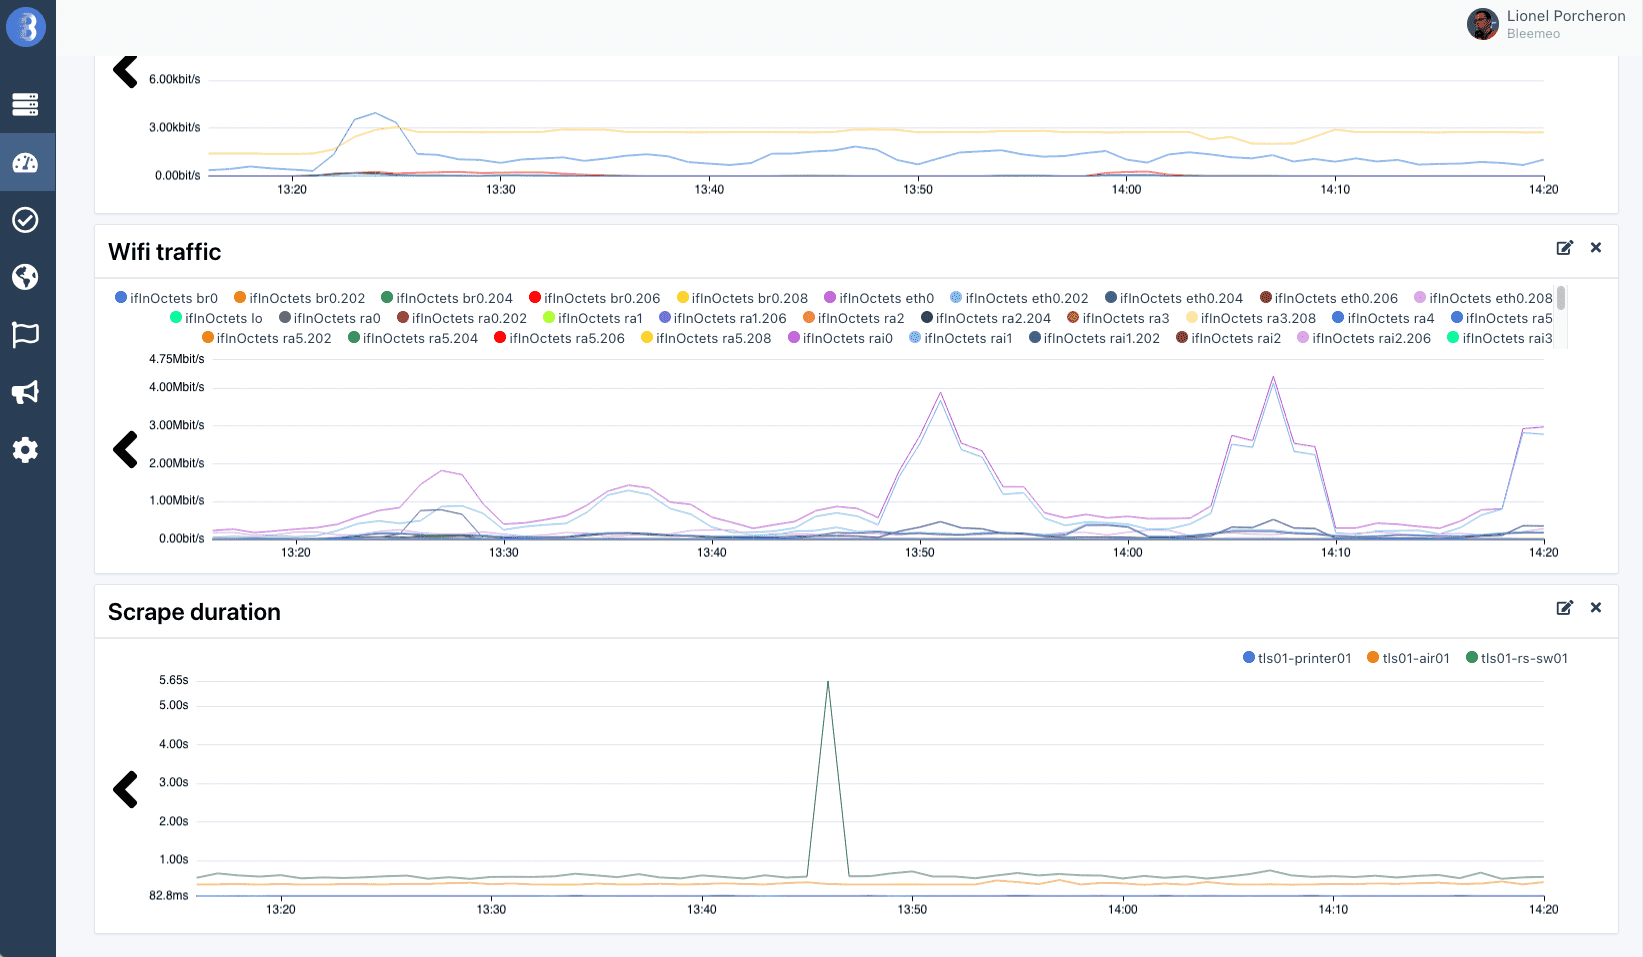
As mentioned, any metrics are available in this kind of dashboards and let you have a central view of your infrastructure.
With Bleemeo, you can start monitoring network devices with snmp metrics and create custom dashboards in a few minutes.
If you don't have a Bleemeo account yet, start monitoring your network devices with snmp today in 30s.