

Built on Prometheus & OpenTelemetry
No vendor lock-in
No agents to configure, no dashboards to build, no scripts to maintain. One lightweight binary auto-discovers your services, ships 60+ OS metrics out of the box, and replaces the Nagios + Grafana + scripts stack with a single managed platform.
15-day free trialNo credit card requiredNo long-term commitment
No vendor lock-in
Data stays in EU · GDPR compliant
Across Europe and beyond
Trusted by 500+ companies to monitor their infrastructure
The problem
Most teams cobble together a server monitoring solution from 3-4 open-source tools — and pay for it in engineering hours every month. Four costs you only see after rollout:
Nagios or Zabbix for alerts, Grafana for dashboards, Prometheus for metrics, ELK or Loki for logs — each with its own config language, agent, and upgrade cadence. The performance monitoring system you assembled becomes its own infrastructure project.
Every new server, every new service, every new Docker container requires manual integration work — scrape configs, alert rules, dashboards. Six months in, half your fleet is monitored differently than the other half, and nobody is quite sure which alerts still fire.
Default thresholds page on noise. Tuning them takes months of iteration. Teams end up either ignoring the channel ("alert fatigue") or missing real incidents because the signal is buried under false positives.
20-40 engineer-hours per month go into maintaining the monitoring stack itself — upgrades, storage scaling, broken Grafana plugins, NRPE on Windows. Time that should be spent on the productive infrastructure goes into the meta-tooling instead.
Why Bleemeo
A complete server monitoring solution in one binary — replaces the Nagios + Grafana + scripts stack with a managed platform.
One install command, no config files to write, no YAML to edit. Glouton registers itself, discovers what's running on the server, and starts shipping metrics within seconds. Compare with a typical Nagios + NRPE rollout: package install, config templates, check definitions, host groups, command files.
Deploy a new MySQL, Redis, Nginx, RabbitMQ, PostgreSQL, MongoDB, or one of 100+ supported services and it appears in the dashboard within minutes. No exporter to install, no scrape target to register, no dashboard template to import.
High-resolution metrics kept for 13 months — no time-series database to size, no storage tier to rotate. Capacity planning, year-over-year comparisons, post-mortems — all stay accessible without managing your own storage.
Dozens of curated alerts ship enabled: high CPU, memory pressure, disk filling up, I/O wait, service down, container crash loops, CPU steal on cloud VMs, S.M.A.R.T. failures. Thresholds were tuned by Bleemeo's SRE team across thousands of production servers — they fire on real incidents, not noise.
Overview
One agent covers system resources, application services, containers, and hardware health.
CPU, memory, disk, network, swap, and load average with per-core and per-mount granularity. Every metric is sampled at 10-second resolution, giving you near real-time visibility into resource consumption trends and spikes.
Auto-discovered databases, web servers, caches, queues, and more — each with dedicated metrics and pre-built dashboards. Deploy a new MySQL or Redis instance and it appears in your panel within minutes, zero configuration.
Docker and containerd containers with per-container CPU, memory, disk I/O, and network metrics. Services running inside containers are auto-discovered just like bare-metal services. See the dedicated container monitoring page for the full pipeline.
NVIDIA GPU utilization, memory, temperature, power draw, and encoder/decoder metrics via nvidia-smi. Essential for ML/AI training, inference, and rendering workloads where GPU performance directly impacts application throughput.
Bleemeo replaces a stack of 3-4 open-source tools with a single managed service. No NRPE checks to maintain, no Grafana to upgrade, no time-series database to size, no exporters to compile. The platform runs outside your infrastructure — so when your servers go down, the alert you need to receive still reaches you.
Bleemeo was incredibly fast to deploy. In about an hour we rolled it out across more than 100 servers and immediately gained full visibility into our infrastructure.

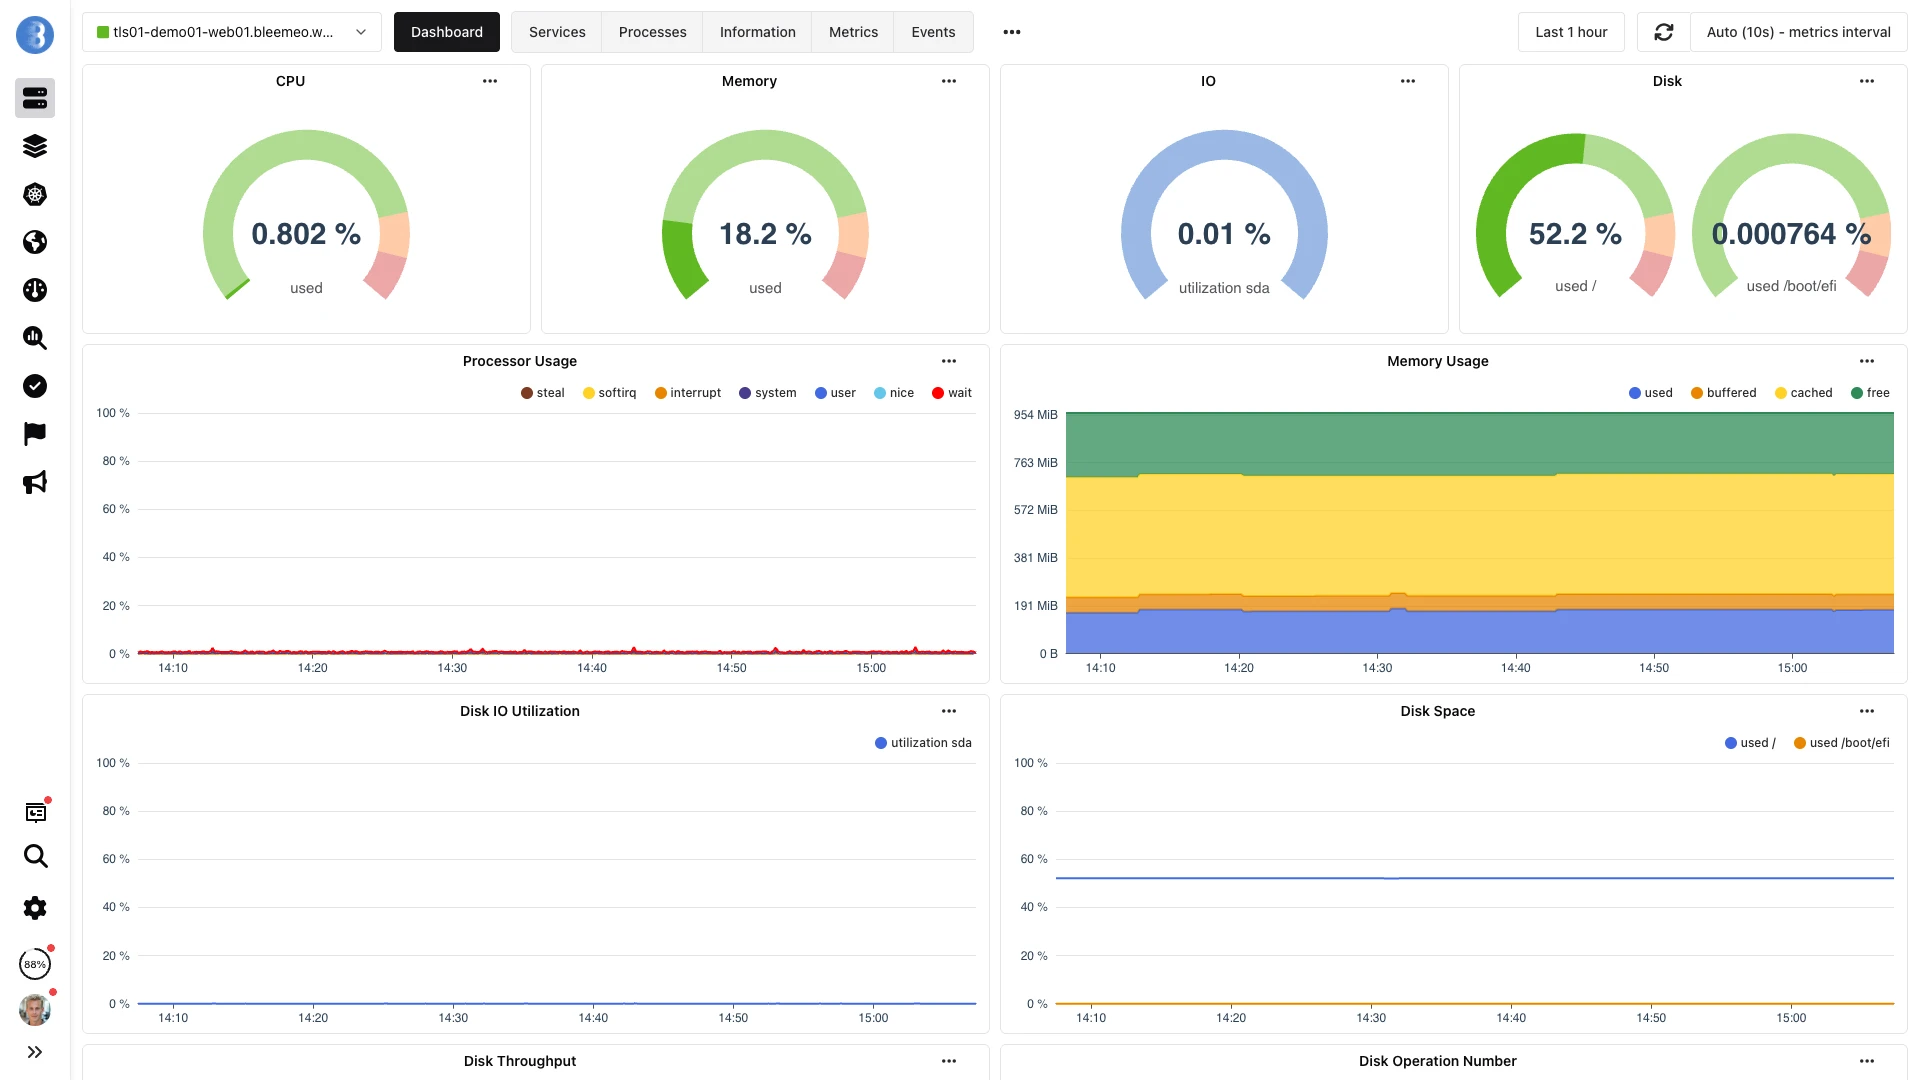
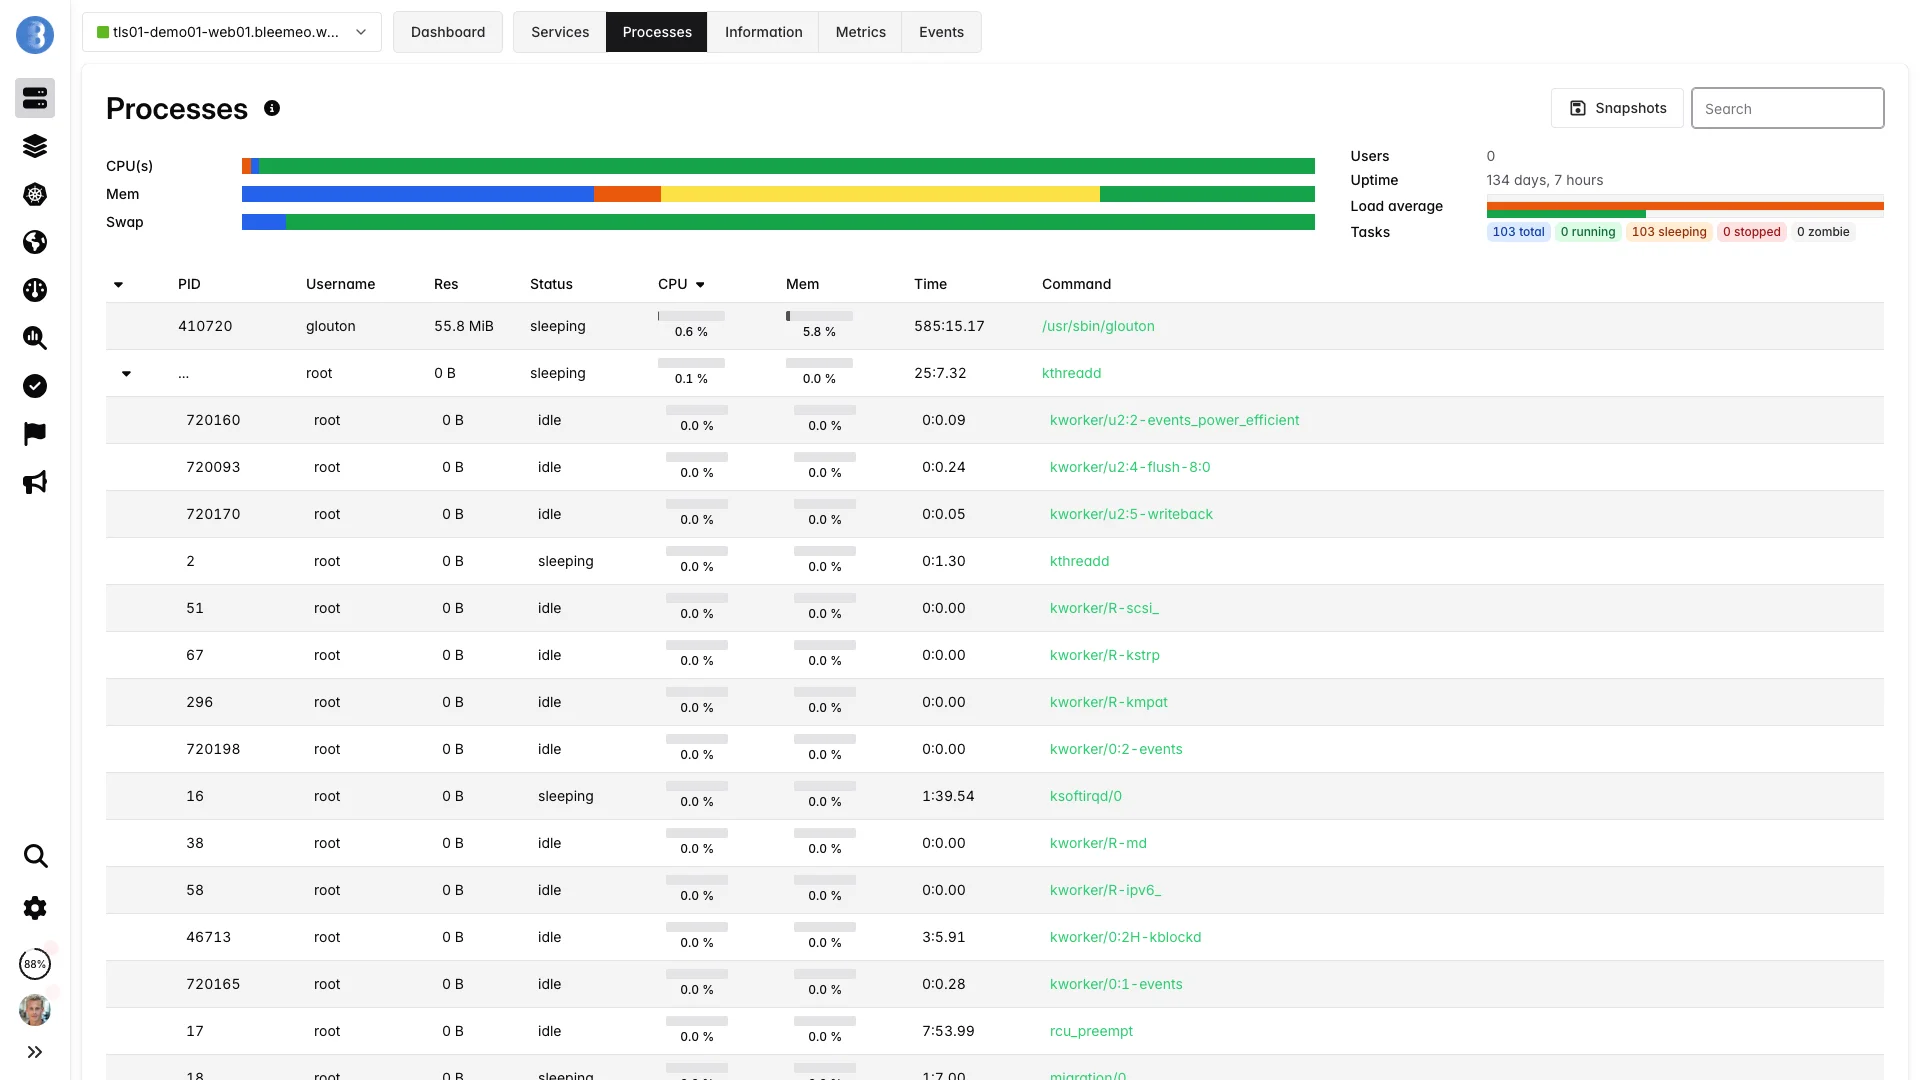
wget to dashboardOne command installs the Glouton agent, and the server dashboard fills in within seconds — captured below.
One command to install, 30 seconds to your first dashboard.
Run this install on your own server in 30 seconds — same managed platform.
How it works
A single lightweight binary collects metrics and logs from your server and sends them securely to Bleemeo Cloud.
Glouton is a single Go binary that installs with one command and runs as a system service. It occupies roughly 50 MB on disk and uses 70-80 MB of RAM during normal operation — about 3% CPU on a modern server. The agent is designed to be invisible to your workloads: it batches and compresses telemetry data before transmitting over MQTT and HTTPS, keeping network overhead to a minimum. Installation is a single line: provide your account ID and registration key, and the agent registers itself with Bleemeo Cloud within seconds.
Every 10 seconds, Glouton samples system metrics — CPU, memory, disk I/O, and network — giving you near real-time visibility into performance changes. In parallel, the agent continuously probes open TCP ports to detect running services. When it finds a new database, web server, or message queue, it automatically begins collecting service-specific metrics. If you deploy a new Redis instance or start a PostgreSQL container, metrics appear in your dashboard within minutes — no configuration changes and no agent restart required.
While Glouton works out of the box with zero configuration, advanced users can customize behavior through YAML files placed in /etc/glouton/conf.d/. Every setting can also be overridden via environment variables prefixed with GLOUTON_, making container and cloud-init deployments straightforward. Configuration changes are picked up automatically — the agent reloads without restarting, ensuring continuous metric collection. You can define custom check targets, adjust thresholds, add SNMP devices, or configure log collection paths, all through the same declarative configuration model.
Metrics
The Glouton agent collects comprehensive system metrics automatically — no configuration required.
Detailed processor utilization broken down by type and core.
Complete memory and swap utilization tracking.
Storage capacity and I/O performance per mount point and device.
Per-interface bandwidth, errors, and connection tracking.
Operating system health and kernel-level indicators.
Per-process resource tracking for critical applications.
Auto-discovery
The Glouton agent automatically detects running services on your servers — no manual configuration needed. It recognizes 100+ services out of the box, including databases, web servers, caches, message queues, search engines, and application runtimes.
When a service is discovered, Bleemeo immediately starts collecting service-specific metrics. For example, a discovered MySQL instance gets query throughput, slow queries, connection counts, and replication lag metrics. A discovered Nginx gets request rates, active connections, and response status breakdowns.
Discovery is continuous: when you deploy a new service, it appears in your dashboard within minutes. When a service stops, you are alerted immediately. If a service changes port or a new version is deployed, the agent adapts without manual intervention. This zero-configuration approach eliminates the toil of maintaining monitoring configs as your infrastructure evolves — no more forgotten services running unmonitored in production.


Containers
Glouton automatically detects Docker and containerd containers running on your servers. Every container gets per-container metrics — CPU usage, memory consumption, disk I/O, and network traffic — without any configuration. Container names, images, and labels are attached as metadata, making it easy to filter and group containers in dashboards.
What makes Bleemeo's container monitoring unique is that service discovery works inside containers too. If a container runs MySQL, Nginx, or Redis, Glouton detects it the same way it would on bare metal and immediately starts collecting service-specific metrics. You get both the infrastructure view (container resource usage) and the application view (query throughput, request rates, cache hit ratios) in a single dashboard.
For Docker Compose stacks, Glouton maps container relationships through network links and labels. For production environments with hundreds of containers, use container labels to control monitoring behavior: bleemeo.enable: "false" excludes noisy sidecar containers, bleemeo.check.ignore.port.* skips health checks on debug ports. When containers crash and restart, Bleemeo tracks restart counts and alerts on crash loops — a common indicator of application bugs or resource exhaustion.
Advanced
Monitor physical disk health via S.M.A.R.T. attributes when smartmontools is installed. Track reallocated sectors, pending sectors, temperature, power-on hours, and overall health assessment. Get alerts before drives fail so you can replace them proactively.
Track GPU utilization, memory usage, temperature, fan speed, power consumption, and encoder/decoder usage via nvidia-smi. Essential for machine learning training, inference workloads, and rendering servers that depend on GPU performance.
Define critical processes to watch. The agent reports CPU usage, memory consumption, thread count, and file descriptors for each monitored process. Receive immediate alerts when a key process crashes or stops running unexpectedly.
Collect temperature readings from CPU cores, chassis, and drives via IPMI or lm-sensors. Monitor fan speeds and voltage rails on supported hardware. Prevent thermal throttling and detect hardware degradation early.
Setup
A single command installs and configures the Glouton agent on any supported OS.
wget -qO- 'https://get.bleemeo.com?accountId=<your_account_id>®istrationKey=<your_registration_key>' | shWithin seconds, the agent starts collecting 60+ system metrics and scans open TCP ports to discover running services. MySQL, PostgreSQL, Nginx, Redis, RabbitMQ, Docker containers — everything is detected automatically. No configuration files to write, no service definitions to maintain.
Your server appears in the Bleemeo Cloud panel within seconds, complete with pre-built dashboards for system resources, discovered services, and container health. Default alert rules for CPU, memory, disk, and service availability are already active. Customize thresholds or add new alerts from the web panel as your needs evolve.
Alerting
Dozens of alert rules are active from the moment you install. No manual threshold tuning required. Every alert is customizable — adjust thresholds, change notification channels, or create entirely new rules based on any collected metric. Alerts are delivered via email, Slack, PagerDuty, Microsoft Teams, webhooks, or the Bleemeo mobile app.
Use cases
Monitor web servers (Apache, Nginx), application runtimes (PHP-FPM, Node.js, Java), and database backends together. Correlate response time degradation with CPU spikes or disk I/O saturation to quickly identify bottlenecks in your web stack.
Track query performance, replication lag, connection pool utilization, and storage growth for MySQL, PostgreSQL, MongoDB, and Redis. Receive alerts when slow query rates increase or when disk space approaches capacity thresholds.
Monitor Jenkins, GitLab Runner, or other CI agents alongside the build host. Ensure build servers have enough CPU, memory, and disk for concurrent pipelines. Detect resource contention that causes flaky or slow builds.
Track NVIDIA GPU utilization, VRAM consumption, and temperature during training and inference jobs. Correlate GPU metrics with system CPU, memory, and disk I/O to identify data pipeline bottlenecks that starve the GPU.
Monitor guest VMs and their host hypervisors side-by-side. Detect CPU steal that indicates overcommitted hosts. Track memory ballooning, disk I/O contention, and network throughput to right-size your virtual infrastructure.
Deploy the lightweight agent on ARM-based edge devices and IoT gateways. Monitor constrained resources, track service health, and receive alerts when remote devices go offline or run low on storage or memory.
Linux server monitoring covers the full range of system metrics that matter for performance and capacity planning: CPU usage across all cores, memory utilization including cache and buffers, disk I/O throughput and latency, load average, swap activity, and per-process resource consumption. Bleemeo's Glouton agent runs natively on all major distributions — Debian, Ubuntu, CentOS, RHEL, Rocky Linux, AlmaLinux, Fedora, and SUSE — with packages available as .deb, .rpm, and via the one-line install script. ARM64 builds are included for Graviton and Raspberry Pi deployments.
Bleemeo auto-discovers Nginx instances and collects key metrics including active connections, requests per second, reading/writing/waiting worker states, and HTTP response status codes. A dedicated Nginx dashboard provides real-time visibility into your web server performance without any configuration. Simply deploy the agent — if Nginx is running, Bleemeo monitors it.
Bleemeo monitors Windows Server 2016, 2019, and 2022 with full system metrics: CPU, memory, disk usage, and network. The Glouton agent auto-discovers Windows services, IIS web sites, and SQL Server instances. Windows Event Log errors are forwarded to the centralized log management platform. Install via the MSI installer for automated deployment across your Windows fleet.
Best practices
A database server that sustains 80% CPU is fine if queries are fast. A web server at 80% CPU may be on the edge. Tune your alert thresholds based on each server's role and historical baselines — Bleemeo's 13-month retention makes it easy to identify normal operating ranges and set thresholds that actually catch problems.
Running out of disk space is a slow-motion emergency that is easy to detect. High I/O latency is far more insidious: it silently degrades application performance long before space runs out. Track read/write latency and IOPS alongside capacity metrics to catch I/O bottlenecks from worn SSDs, RAID degradation, or noisy neighbors on shared storage.
CPU steal indicates that the hypervisor is taking CPU cycles away from your VM to serve other tenants. Sustained steal above 5-10% degrades performance in ways that appear random from inside the guest. Bleemeo tracks steal per core, helping you decide when to resize an instance or move to a dedicated host.
Drives rarely fail without warning. S.M.A.R.T. attributes like reallocated sectors and pending sectors rise weeks before a disk dies. Install smartmontools and let Bleemeo track these attributes automatically — a proactive disk replacement prevents unplanned downtime and data loss.
A CPU spike alone tells you something is wrong. Combined with application logs, it tells you exactly what triggered it — a runaway query, a traffic surge, or a misconfigured cron job. Enable log collection alongside server metrics for the fastest root cause analysis.
Benefits
Install one agent and everything is monitored: system metrics, services, containers, hardware. No config files to write, no YAML to edit, no plugins to enable. The agent discovers what is running and starts collecting the right metrics automatically.
Glouton uses less than 100 MB RAM and under 1% CPU. It batches and compresses data before transmission, keeping network overhead to a few kilobytes per second. Deploy it on production servers with confidence — your workloads will not notice it.
Servers, Kubernetes, AWS services, network devices, and uptime checks — all in one dashboard with consistent alerting rules. No need to stitch together separate tools or maintain multiple monitoring stacks for different parts of your infrastructure.
Coverage
The Glouton agent is built in Go and compiled natively for multiple architectures. It runs on all major server operating systems without dependencies or runtime requirements.
Ubuntu, Debian, CentOS, RHEL, Fedora, Rocky Linux, AlmaLinux, SUSE, and any systemd-based distribution. Packages available as .deb, .rpm, and via the install script.
Windows Server 2016 and later. MSI installer for automated deployment. Collects the same system and service metrics as the Linux agent, including IIS and SQL Server discovery.
Native FreeBSD support for jail-based hosting environments. Collects system metrics and discovers services using the same auto-discovery engine as Linux.
Native ARM64 builds for Raspberry Pi, AWS Graviton, Ampere Altra, and other ARM-based servers. Same agent, same features, same lightweight footprint on ARM as on x86_64.
Server monitoring is the practice of continuously observing the health, performance, and availability of physical and virtual servers that power your applications and services. It involves collecting metrics from the operating system, tracking resource consumption, detecting anomalies, and alerting operations teams when thresholds are breached.
Modern infrastructure spans bare-metal servers, virtual machines, cloud instances, and containers — often across multiple providers and regions. Without comprehensive server monitoring, teams fly blind: they cannot identify bottlenecks, plan capacity, or respond to incidents before users are affected. A reliable monitoring solution transforms reactive firefighting into proactive infrastructure management.
Effective server monitoring goes beyond simple ping checks. It requires deep visibility into CPU utilization patterns, memory pressure, disk I/O latency, network throughput, and the services running on each host. It should correlate metrics across the stack — from hardware sensors to application-level indicators — to provide a complete picture of server health. The best server monitoring solutions also provide long-term data retention for capacity planning, pre-built alert rules that catch common problems immediately, and automatic service discovery that keeps pace with your evolving infrastructure. Bleemeo combines server monitoring with an integrated application monitoring service in a single platform, delivered through one lightweight agent that installs in 60 seconds and starts collecting data immediately.
Want to go further?
Read the DocumentationEverything you need to know about Bleemeo's server monitoring
Bleemeo supports all major Linux distributions (Ubuntu, Debian, CentOS, RHEL, Fedora, Rocky Linux, AlmaLinux, SUSE), Windows Server 2016+, and FreeBSD. The Glouton agent is built in Go and runs natively on x86_64 and ARM64 architectures, making it suitable for everything from cloud VMs to Raspberry Pi devices and edge gateways.
Installation takes one command. Run our install script with your account ID and registration key: wget -qO- 'https://get.bleemeo.com?accountId=YOUR_ID®istrationKey=YOUR_KEY' | sh. The agent installs, starts collecting metrics, and registers with Bleemeo Cloud automatically. For Windows, an MSI installer is available. For Kubernetes, use the Helm chart for DaemonSet deployment.
The agent collects 60+ system metrics out of the box: CPU (user, system, iowait, steal, nice, per-core), Memory (used, free, cached, buffers, swap), Disk (space, I/O throughput, IOPS, latency per device), Network (bandwidth, errors, dropped, TCP states per interface), and System (load average, uptime, open FDs, context switches). On top of that, each discovered service adds its own specialized metrics.
Yes, automatic service discovery is a core feature. Glouton detects 100+ services including databases (MySQL, PostgreSQL, MongoDB, Redis, Elasticsearch), web servers (Apache, Nginx, HAProxy), message queues (RabbitMQ, Kafka), and many more. Each discovered service gets dedicated metrics and pre-built dashboards without manual configuration. Discovery is continuous — new services appear automatically.
Yes, Glouton automatically discovers and monitors all Docker and containerd containers running on the host. It collects per-container CPU, memory, disk I/O, and network metrics. Services running inside containers are also auto-discovered and monitored with the same depth as bare-metal services. Container labels and names are used for identification in dashboards.
Bleemeo replaces a stack of 3-4 open-source tools with a single managed service. There are no NRPE checks or plugins to write, no Grafana to upgrade, no time-series database to size, no Alertmanager cluster to maintain. Glouton auto-discovers services and ships 60+ system metrics out of the box, and pre-built alerts are tuned by Bleemeo's SRE team on real production servers. Because the platform runs outside your infrastructure, alerts still reach you when your servers go down. See our comparisons: vs Nagios, vs Zabbix, vs Grafana.
Yes, Bleemeo monitors NVIDIA GPUs using the nvidia-smi interface. Metrics include GPU utilization percentage, memory used and total, temperature, fan speed, power draw, and encoder/decoder utilization. This is essential for ML/AI workloads, rendering servers, and any environment where GPU performance impacts application behavior.
Bleemeo includes dozens of pre-configured alerts: high CPU usage, low available memory, disk space critically low, high disk I/O wait, network interface errors, service stopped, container crash loops, CPU steal indicating noisy neighbors, and many more. All alert thresholds are customizable, and you can create additional custom alerts based on any collected metric.
Yes, when smartmontools is installed, Glouton collects S.M.A.R.T. attributes from physical disks including reallocated sectors, pending sectors, temperature, power-on hours, and overall health assessment. This enables proactive replacement of failing drives before data loss occurs. Pre-built alerts notify you when S.M.A.R.T. indicators cross warning thresholds.
Yes, Bleemeo supports key process monitoring. You can configure specific processes to track, and the agent will report their CPU usage, memory consumption, thread count, and open file descriptors. You'll be alerted if a monitored process stops running. This is ideal for custom applications, background workers, and critical daemons that aren't covered by standard service discovery.
The Glouton agent is designed to be lightweight. It typically uses less than 100MB of memory and under 1% CPU on modern hardware. The agent uses efficient Go-native collectors and batched, compressed data transmission to minimize both compute and network overhead. You can safely deploy it on production servers without impacting your workloads.
About 30 seconds of actual install. One command (or the MSI installer on Windows) drops the Glouton binary, registers it with your account, and starts shipping metrics. Auto-discovery picks up 100+ services without configuration. Pre-built dashboards and alerts work out of the box — no YAML to write, no plugins to compile, no time-series database to provision.