

Built on Prometheus & OpenTelemetry
No vendor lock-in
One Helm chart. Zero configuration. Get full visibility into your clusters, nodes, pods, and containers — with automatic discovery that keeps up with your deployments.
15-day free trialNo credit card requiredNo long-term commitment
No vendor lock-in
Data stays in EU · GDPR compliant
Across Europe and beyond
The problem
Most teams start with Prometheus, Grafana, Alertmanager, and a pile of YAML. Before a single dashboard is useful, you've spent days writing scrape configs, recording rules, and building dashboards from scratch — and that's before you deal with storage, high-availability, or federation. Then you need long-term retention, so you bolt on Thanos or Mimir — and suddenly you're running a monitoring platform instead of monitoring your platform.
Kubernetes moves fast. Pods come and go, ReplicaSets scale, nodes drain. Static monitoring setups can't keep up — targets disappear, dashboards go stale, and alerts fire on resources that no longer exist. Traditional tools need manual target lists or annotation-based discovery that demands changes to every deployment manifest. The more dynamic your cluster, the more work it creates.
Deploy one Helm chart. The Glouton agent runs as a DaemonSet on every node, watches the Kubernetes API for changes, and automatically discovers every pod, container, and service. Dashboards and alerts light up in seconds — no config files, no query language, no maintenance. When a pod scales up at 2 AM, Bleemeo picks it up instantly. When it scales back down, stale data is cleaned up automatically.
Setup
From zero to production-ready monitoring in about 10 minutes.
Add the Bleemeo Helm repository and install the chart. The agent deploys as a DaemonSet — one pod per node, automatically.
helm repo add bleemeo https://packages.bleemeo.com/helm/helm repo updatehelm install bleemeo-agent bleemeo/bleemeo-agent \ --set bleemeo.account=YOUR_ACCOUNT_ID \ --set bleemeo.key=YOUR_REGISTRATION_KEYGet your credentials from your Bleemeo account. No other configuration needed.
A DaemonSet guarantees one agent pod per node — including nodes added later by autoscalers. You never have to update your monitoring when the cluster grows or shrinks. Compare this with sidecar injection, which requires changes to every workload manifest and adds overhead to each pod.
Glouton watches the Kubernetes API and discovers every pod, container, and service running on each node. No annotations, no labels, no service monitors to write.
In a Kubernetes environment, workloads are constantly created, moved, and destroyed. Manual monitoring configuration can't keep pace. Automatic discovery means every new deployment, StatefulSet replica, or CronJob pod is monitored the instant it starts — with zero human intervention.
Pre-built dashboards and smart alert rules activate the moment services are discovered. You're monitoring in production — not building a monitoring platform.
Writing good Kubernetes alert rules from scratch is surprisingly hard. You need to handle pod phases, container states, resource pressure conditions, and avoid noisy false positives during rolling deployments. Bleemeo ships with battle-tested defaults so you start with reliable alerts on day one — and you can always customize them later.
What you monitor
Everything discovered automatically — no custom queries, no manual setup.
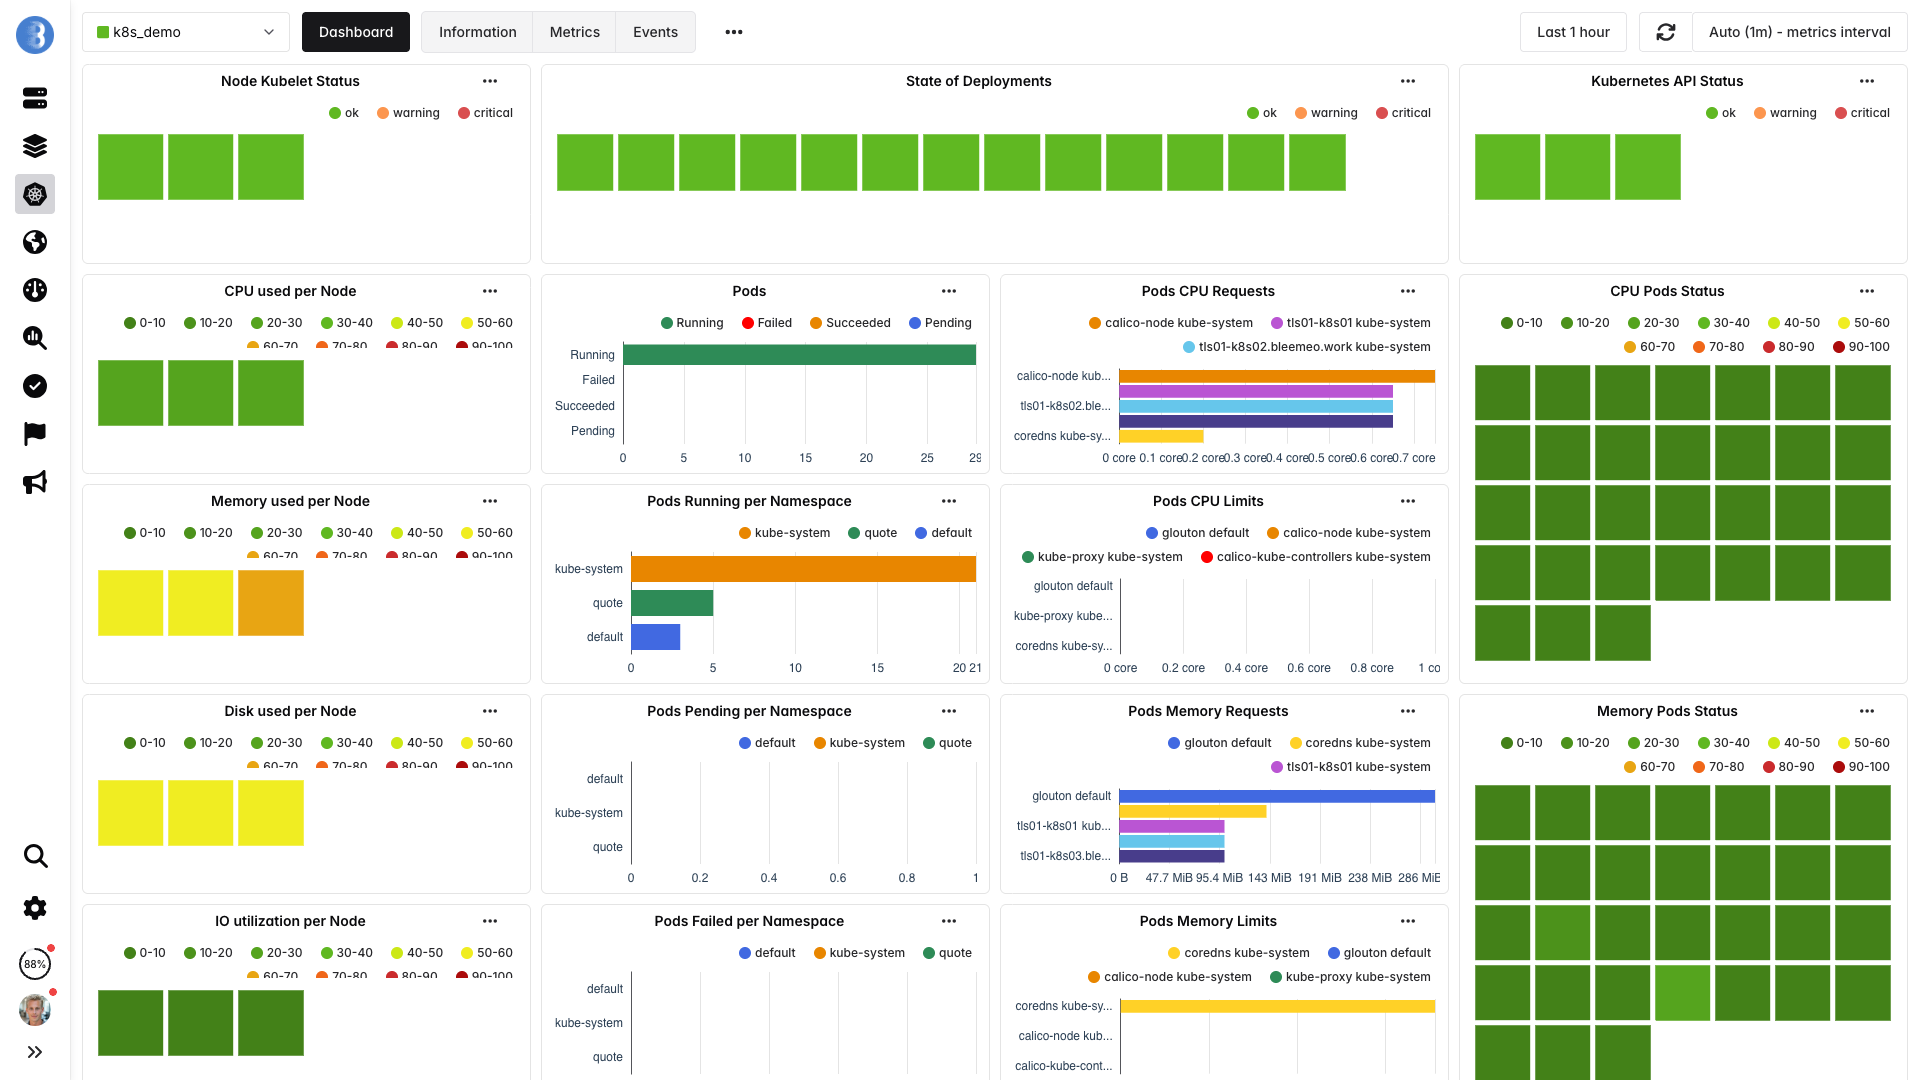
Kubernetes introduces multiple layers of abstraction — clusters, nodes, pods, containers, and the services running inside them. Effective monitoring means covering every layer, because a problem at one level (say, node disk pressure) cascades into symptoms at another (pod evictions, application errors). Bleemeo monitors all of these layers out of the box, so you see both the root cause and the impact in a single dashboard.
| Layer | Key Metrics | Example Alerts |
|---|---|---|
| Cluster | Node count, pod capacity, resource allocation | Cluster node not ready |
| Nodes | CPU, memory, disk, network per node | Node CPU > 90%, disk pressure |
| Pods | Status, restarts, CPU/memory requests vs. usage | Pod crash loop, OOMKilled |
| Containers | CPU throttling, memory limits, filesystem I/O | Container memory > 90% of limit |
| Services | MySQL queries/s, Redis latency, Nginx req/s, etc. | Service-specific thresholds |
| Network | Bytes in/out, packet errors, DNS resolution | High packet loss, DNS failures |
Benefits
Purpose-built for dynamic, containerized environments.
No scrape configs, no ServiceMonitors, no annotations. Glouton discovers everything by watching the Kubernetes API — so new deployments are monitored automatically.
Metrics appear within seconds of agent deployment. Pre-built dashboards give you cluster, node, and pod views without building a single panel.
Deploy the same Helm chart across staging, production, and edge clusters. All data flows into a single pane of glass — no federation required.
Battle-tested alert rules for crash loops, OOMKills, node pressure, and more — active from minute one. Route notifications to Slack, Teams, PagerDuty, or email.
Glouton uses under 100 MB of memory per node. Resource limits are pre-set in the Helm chart, so the agent never competes with your workloads.
From cluster-level capacity to per-container CPU throttling and application-layer metrics like MySQL queries or Redis latency — one agent covers it all.
Comparison
What it actually takes to monitor Kubernetes
| Aspect | DIY Prometheus | Bleemeo |
|---|---|---|
| Setup time | Days to weeks | 10 minutes |
| Configuration | Scrape configs, recording rules, alert rules | Zero config — automatic discovery |
| Dashboards | Build from scratch in Grafana | Pre-built, auto-activated |
| Storage & retention | Manage Thanos/Cortex/Mimir | Fully managed, included |
| High availability | Duplicate stacks + federation | Built-in redundancy |
| New service support | Find exporter, add scrape config | Detected in seconds |
| Ongoing maintenance | Version upgrades, capacity planning | None — fully managed SaaS |
Already invested in Prometheus? Bleemeo is built for Prometheus users — keep your PromQL queries and Grafana dashboards, lose the operational burden.
Prometheus
Already using Prometheus? Bleemeo collects the same metrics you're used to and exposes them through a PromQL-compatible query interface. Keep your existing Grafana dashboards and alerting logic — without maintaining Prometheus infrastructure yourself.
Learn About Prometheus in the CloudEngineers and CTOs trust Bleemeo to monitor their infrastructure
We need our teams focused on our core business — digital signage — rather than on infrastructure monitoring. Bleemeo monitors our entire environment, from bare metal to Azure, and frees our teams from useless alerts while guaranteeing our quality of service.

Bleemeo has supported us for years: simple, reliable monitoring that is essential to the quality of service we owe our customers.

On-premise or in the cloud, Bleemeo monitors my clients' Kubernetes clusters without any complexity. A tool I recommend for its simplicity and the clarity it brings.

Customer since day one, I'm thrilled with Bleemeo. It's easy to install, efficient, and just keeps getting better!

During a short lunch break we installed Bleemeo, created a custom metric, tested alerts, and were ready for production. The speed of deployment is remarkable.

Bleemeo support is simply legendary — fast, knowledgeable, and always there when we need it.

Bleemeo was incredibly fast to deploy. In about an hour we rolled it out across more than 100 servers and immediately gained full visibility into our infrastructure.

We set up monitoring for all our servers in just a few hours. The dashboard is clear, powerful, and genuinely enjoyable to use.

We deployed Bleemeo across our server infrastructure in only a few hours. Uptime monitoring now alerts us instantly whenever a service encounters an issue.

One Helm chart. Full observability. No maintenance. Start your free trial today.
15-day free trial · No credit card required · Cancel anytime
Yes. Bleemeo works with any Kubernetes distribution including Amazon EKS, Google GKE, Azure AKS, and self-managed clusters. The Helm chart deploys a DaemonSet that runs on every node regardless of the underlying infrastructure.
The Glouton agent watches the Kubernetes API for pod lifecycle events. When a new pod starts, Bleemeo automatically detects the running services (databases, web servers, message brokers, etc.) and begins collecting metrics — no annotation or label configuration required.
Yes. Bleemeo collects the same metrics Prometheus users expect and exposes them through a PromQL-compatible query interface. You can keep your existing Grafana dashboards and alerting logic. Learn more about Prometheus in the Cloud.
The Glouton agent is lightweight by design. It typically uses less than 100 MB of memory and minimal CPU. Resource requests and limits are pre-configured in the Helm chart so the agent never impacts your workloads.
No. Once deployed, Glouton automatically discovers nodes, pods, containers, and services. Dashboards and alert rules are activated instantly. You can optionally customize thresholds or add notification channels, but the defaults cover the most common use cases.
Yes. Install the Helm chart on each cluster using the same account credentials. All clusters report to the same Bleemeo dashboard, giving you a unified view across staging, production, and edge environments — without any federation setup.
Upgrading is a single command: helm upgrade bleemeo-agent bleemeo/bleemeo-agent. The DaemonSet performs a rolling update so agent pods are replaced one node at a time with zero monitoring gaps. No data is lost during the upgrade.
Yes. Bleemeo's Glouton agent also runs on bare-metal servers, virtual machines, and cloud instances. You can monitor your entire infrastructure — Kubernetes and non-Kubernetes — from the same dashboard with the same alerting rules.
Yes. Bleemeo automatically groups metrics by namespace, giving you per-namespace dashboards and the ability to set alerts scoped to specific namespaces. This is especially useful for multi-tenant clusters where teams need visibility into their own workloads.
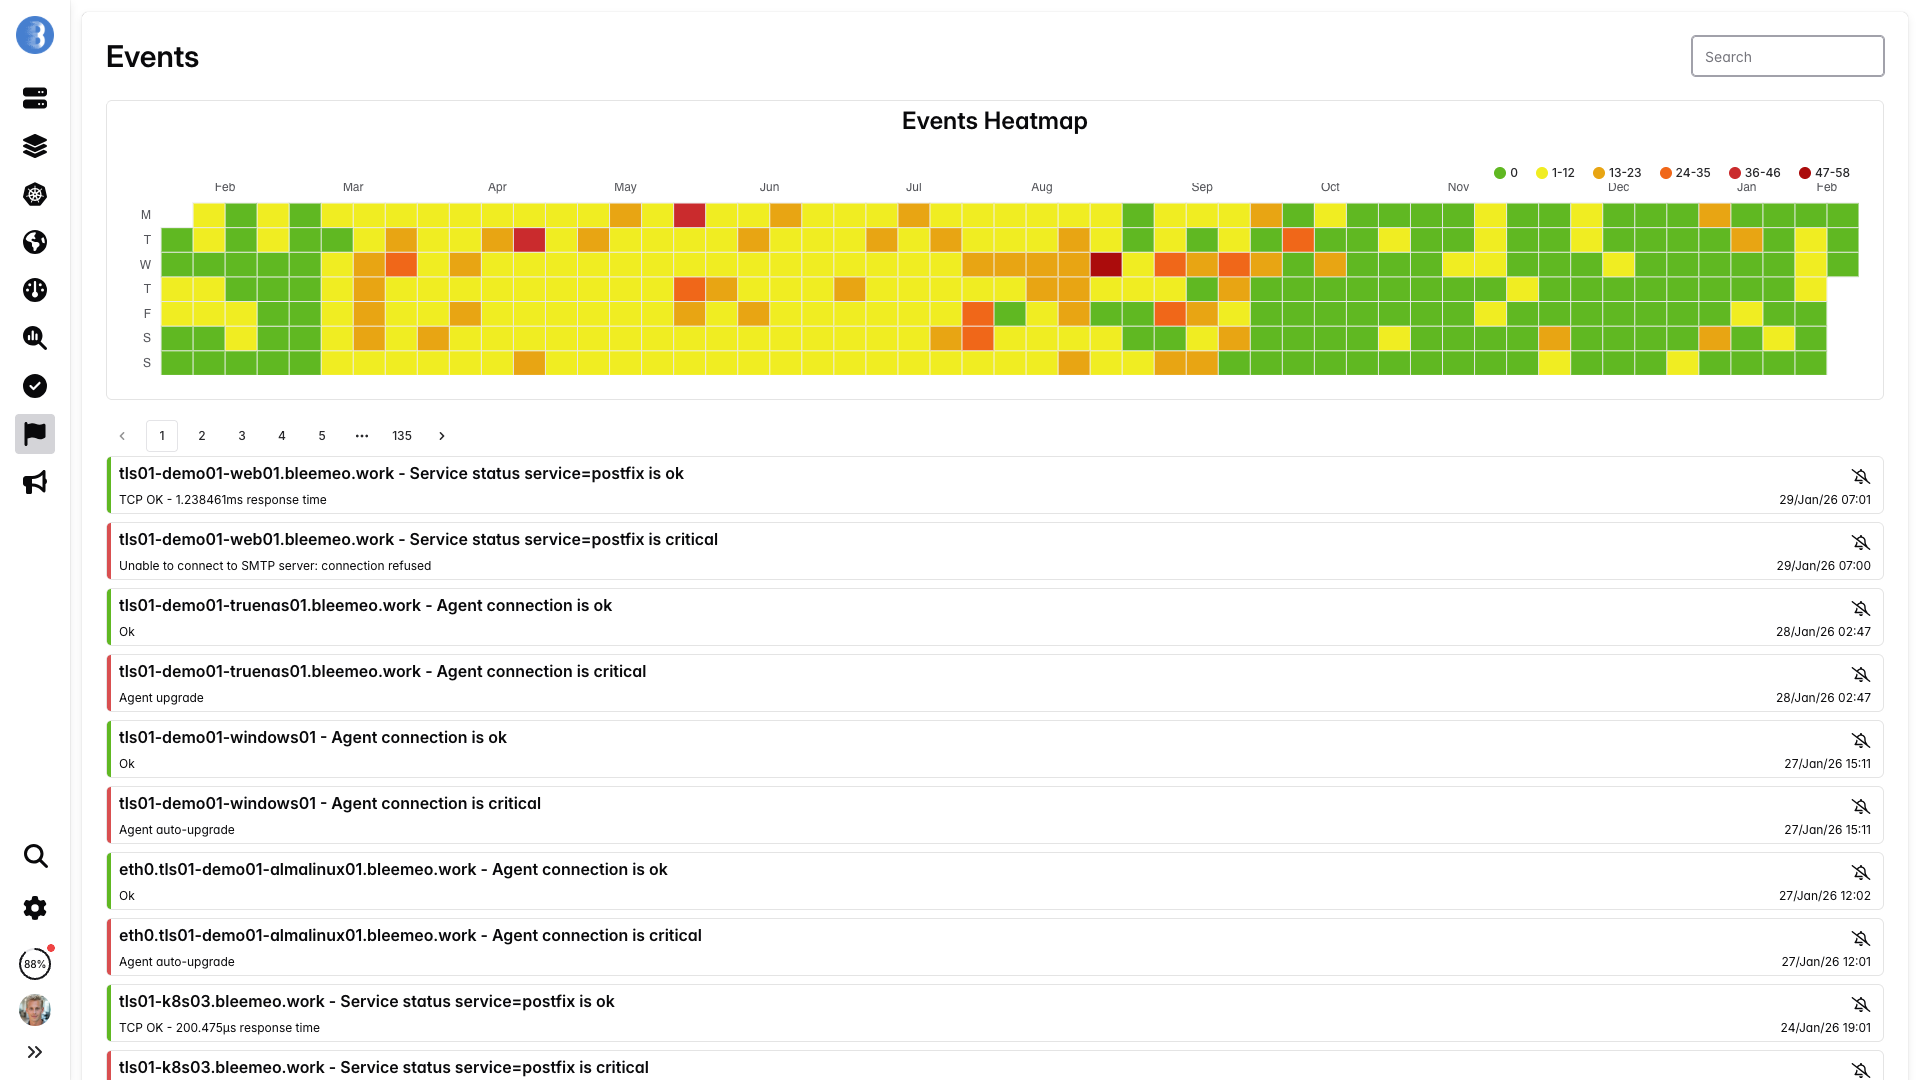
When a node becomes unreachable, Bleemeo detects the loss of heartbeat within minutes and triggers alerts. All pods that were running on that node are flagged, and their status is reflected in your dashboards. Once the node recovers or pods are rescheduled, monitoring resumes automatically.