

Built on Prometheus & OpenTelemetry
No vendor lock-in
Looking for a Zabbix alternative built for the cloud era? Zabbix is powerful but demands significant expertise — complex trigger expressions, database tuning, and proxy management drain engineering time. Bleemeo is a modern Zabbix replacement that delivers the same coverage with automatic discovery, zero database to maintain, and a cloud-native UI your team will actually enjoy.
15-day free trialNo credit card requiredNo long-term commitment
No vendor lock-in
Data stays in EU · GDPR compliant
Across Europe and beyond
Trusted by 500+ teams retiring complex Zabbix deployments
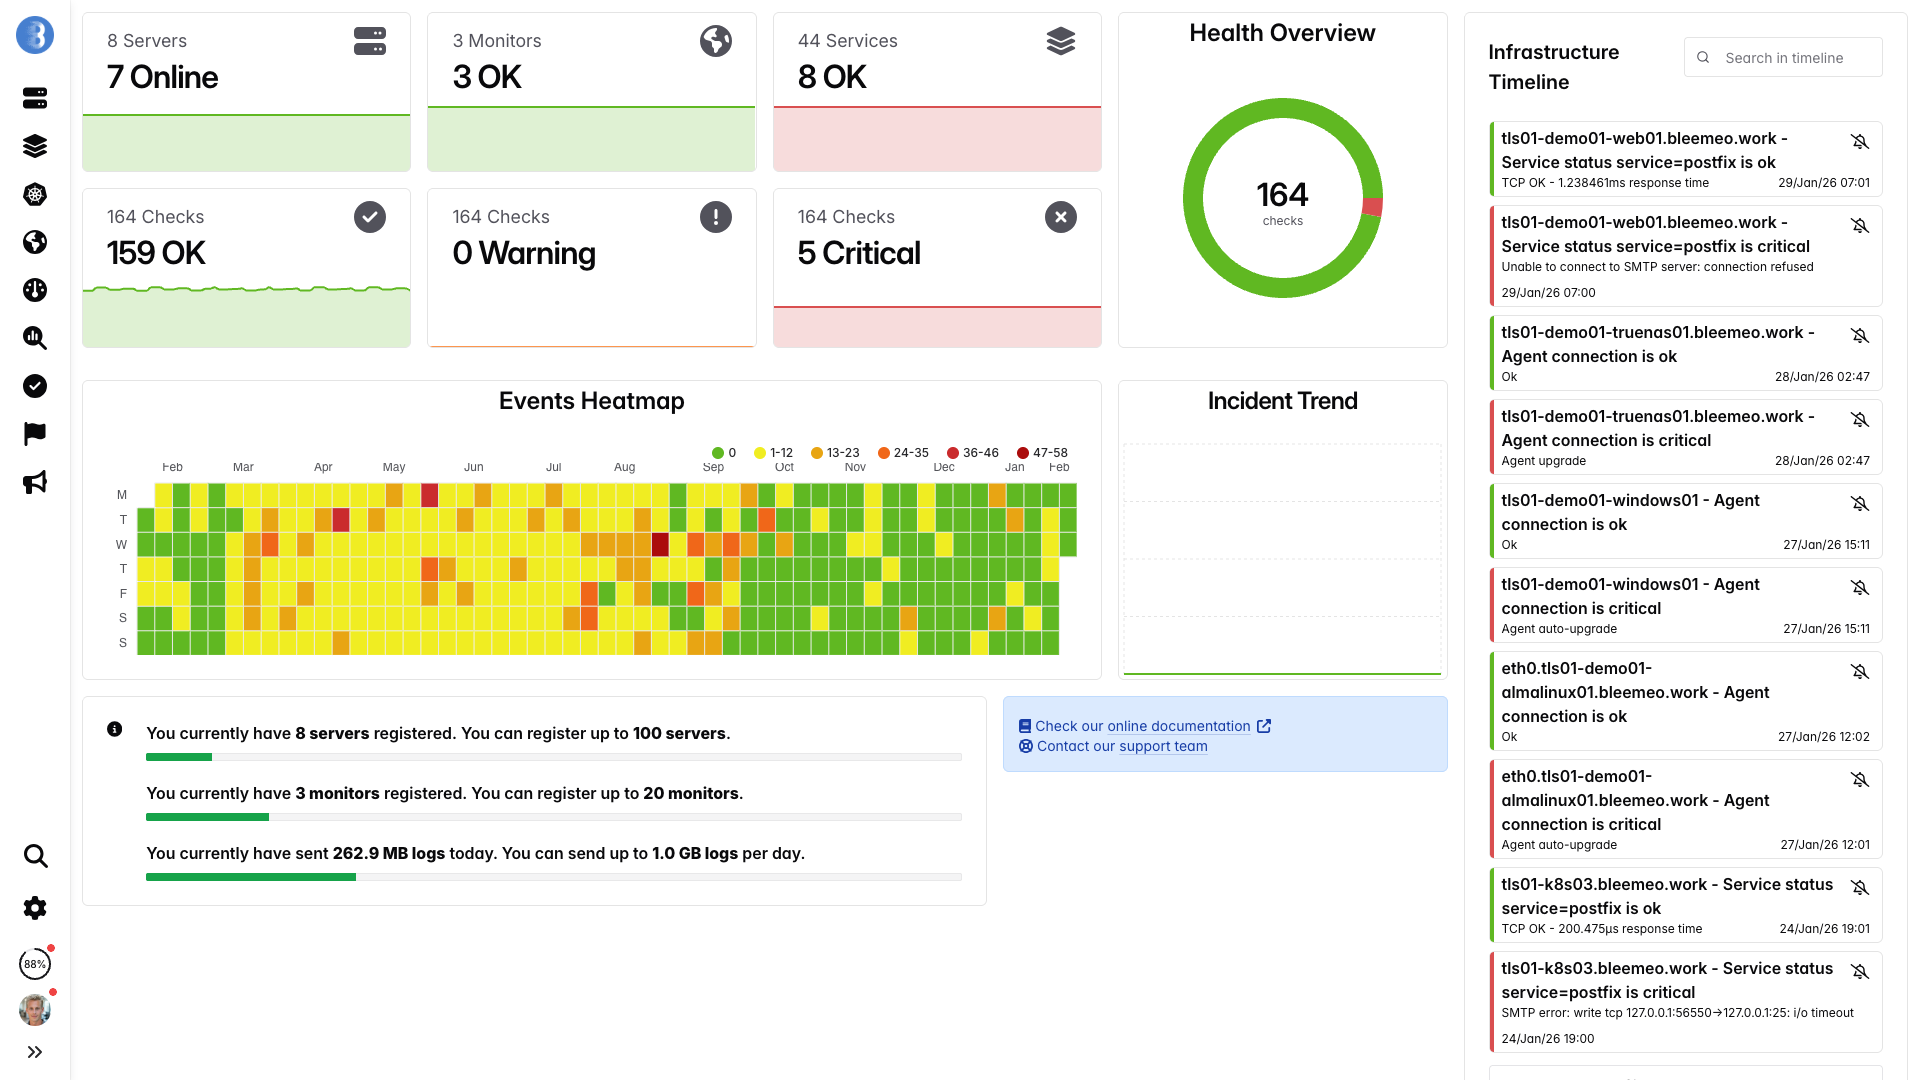
Real-time dashboards, ready in minutes — no configuration needed
From sign-up to dashboard in 30 seconds — no DB tuning, no triggers
One command, no configuration — metrics flowing in under a minute.
Why switch
Managing Zabbix's MySQL or PostgreSQL database becomes a full-time job at scale. Partitioning history and trend tables, tuning slow queries that cripple dashboard performance, and running regular housekeeper cleanup routines are constant challenges that grow with your infrastructure. Many teams discover too late that their database server needs upgrading, leading to emergency migrations and unexpected downtime during the busiest periods.
Zabbix's terminology — hosts, items, triggers, templates, macros, low-level discovery rules, and calculated items — along with complex workflows take weeks or even months to master. Writing correct trigger expressions with functions like last(), avg(), and nodata() requires deep domain knowledge that few engineers possess. New team members face a daunting onboarding process before they can contribute effectively, and costly training courses are often necessary to bring staff up to speed.
Zabbix was designed for static, on-premise environments where servers are long-lived and manually provisioned. Auto-discovery in Kubernetes and dynamic cloud environments requires extensive custom scripting, external integrations, and constant template adjustments as your infrastructure evolves. Ephemeral containers and auto-scaling groups create a flood of host registrations and deregistrations that overwhelm Zabbix's host management model, leaving stale entries and broken graphs behind.
Scaling Zabbix across multiple data centers or regions requires deploying and managing Zabbix proxies — each one another server to provision, configure, monitor, and maintain with its own local database. The proxy architecture introduces additional failure points and latency in metric collection. Large-scale deployments also demand careful database capacity planning, and exceeding your database's throughput limits results in data loss, delayed alerts, and frustrated engineers scrambling to restore service during critical incidents.
On-premise or in the cloud, Bleemeo monitors my clients' Kubernetes clusters without any complexity. A tool I recommend for its simplicity and the clarity it brings.

Head to head
| Feature | Zabbix | Bleemeo |
|---|---|---|
| Database Management | MySQL/PostgreSQL tuning required | Fully managed, no DBA needed |
| Setup Complexity | Server, database, web server config | One-line agent install |
| Configuration | Templates, items, triggers, macros | Automatic service discovery |
| Scalability | Requires proxies, partitioning | Automatic, unlimited scaling |
| Kubernetes Support | Limited, requires custom discovery | Native integration built-in |
| Alerting | Basic, can cause alert storms | ML-based with smart grouping |
| Mobile Experience | Web UI not mobile-optimized | Native iOS & Android apps |
| Maintenance | Updates, backups, database cleanup | Zero maintenance required |
| Log Management | Limited log item support | Full log aggregation & search |
| Anomaly Detection | Manual threshold tuning only | ML-based automatic anomaly detection |
| Prometheus Compatibility | No native Prometheus support | Native Prometheus exporter scraping and PromQL |
| OpenTelemetry | No OpenTelemetry support | Full OTLP ingestion support |
| User Interface | Functional but dated | Modern, intuitive, responsive |
Storage
Advantages
Built from the ground up for containers, Kubernetes, and dynamic cloud infrastructure — not retrofitted like Zabbix. Auto-discovery detects new services, containers, and pods the moment they appear, with no templates to configure or discovery rules to write.
No Zabbix server to provision, no MySQL or PostgreSQL database to tune and partition, no proxies to configure for distributed setups. Just install the lightweight Bleemeo agent with a single command and start monitoring within seconds. All the heavy lifting is handled automatically in the cloud.
Unlike Zabbix's complex trigger expressions that require manual threshold tuning, Bleemeo uses machine learning to detect anomalies automatically based on your infrastructure's normal behavior patterns. Smart alert routing, grouping, and deduplication prevent the notification fatigue that plagues Zabbix deployments.
Handle millions of metrics without planning capacity, configuring Zabbix proxies, or partitioning database tables. Bleemeo scales automatically as your infrastructure grows, from ten servers to ten thousand, with no performance cliff to hit.
While Zabbix's web interface feels dated and requires deep menu navigation, Bleemeo offers a clean, modern dashboard designed for speed and clarity. Native iOS and Android mobile apps let on-call engineers check status and acknowledge alerts from anywhere.
Metrics, logs, and uptime monitoring all unified in a single platform — something Zabbix cannot offer natively. Correlate metrics with log events in one view, reducing mean time to resolution and eliminating the context-switching that slows down incident response.
Migration
Most teams complete their migration from Zabbix to Bleemeo within one to two weeks, running both systems in parallel to validate full coverage before decommissioning. Our dedicated support team is available throughout the entire migration process to answer questions, review your configuration, and ensure that every host, service, and alert rule is properly transitioned to the new platform. Follow these six straightforward steps to make the switch.
Start by documenting your existing Zabbix setup: list all monitored hosts, custom items and templates, trigger expressions, and notification channels. This inventory ensures nothing gets left behind during the transition.
Install the lightweight Bleemeo agent on all monitored hosts using a single command. The agent automatically discovers running services, containers, and system resources — replacing dozens of Zabbix templates with zero configuration:
wget -qO- 'https://get.bleemeo.com?accountId=...'For any custom Zabbix items or UserParameter scripts, Bleemeo supports Prometheus exporters, StatsD, and a flexible custom metrics API. Most standard services are already covered by built-in integrations, so you will likely find that many custom items are no longer needed.
Configure your notification channels (email, Slack, PagerDuty, webhooks) and set up alert thresholds. Bleemeo comes with sensible default thresholds for common metrics, so many of your Zabbix trigger expressions are already covered out of the box.
Run Bleemeo alongside Zabbix for at least one week to validate that all hosts, services, and alerts are properly covered. Compare dashboards side by side and verify that alert thresholds match your expectations. This parallel run phase is critical for building confidence in the new platform and identifying any gaps in coverage before you fully commit to the transition.
Once you have confirmed full coverage, switch to Bleemeo as your primary monitoring platform and begin decommissioning your Zabbix infrastructure. Remove the Zabbix agent from all hosts, shut down the Zabbix server and proxy instances, and reclaim the database server resources. Your team is finally free from database partitioning, housekeeper tuning, and proxy maintenance — and can redirect those engineering hours toward delivering value to your customers.
Cost
*With 1-year reservation. Logs billed separately at 0.50€/GiB.
The numbers above assume a 100-host setup. Plug in your own host count and add-ons to estimate how much you'd save by retiring your Zabbix deployment.
Engineers and CTOs trust Bleemeo to monitor their infrastructure
We need our teams focused on our core business — digital signage — rather than on infrastructure monitoring. Bleemeo monitors our entire environment, from bare metal to Azure, and frees our teams from useless alerts while guaranteeing our quality of service.

Bleemeo has supported us for years: simple, reliable monitoring that is essential to the quality of service we owe our customers.

On-premise or in the cloud, Bleemeo monitors my clients' Kubernetes clusters without any complexity. A tool I recommend for its simplicity and the clarity it brings.
Customer since day one, I'm thrilled with Bleemeo. It's easy to install, efficient, and just keeps getting better!

During a short lunch break we installed Bleemeo, created a custom metric, tested alerts, and were ready for production. The speed of deployment is remarkable.

Bleemeo support is simply legendary — fast, knowledgeable, and always there when we need it.

Bleemeo was incredibly fast to deploy. In about an hour we rolled it out across more than 100 servers and immediately gained full visibility into our infrastructure.

We set up monitoring for all our servers in just a few hours. The dashboard is clear, powerful, and genuinely enjoyable to use.

We deployed Bleemeo across our server infrastructure in only a few hours. Uptime monitoring now alerts us instantly whenever a service encounters an issue.

See it live
Watch how teams go from install to full monitoring in under 5 minutes
Yes. Bleemeo monitors servers, services, containers, and Kubernetes with automatic discovery. No templates to import, no triggers to write, no database to maintain.
No. Bleemeo is fully managed SaaS with 13 months of metric retention included. No MySQL/PostgreSQL tuning, no table partitioning, no storage planning.
Bleemeo's discovery is fully automatic — install the agent and it detects services within seconds. No low-level discovery rules, no host prototypes, no macro definitions.
Yes. Each Bleemeo agent sends metrics directly to the cloud. No Zabbix proxy layer needed, no proxy failure points, no data loss during proxy outages.
Yes. Native Docker and Kubernetes monitoring with automatic pod and service discovery. No custom templates or low-level discovery rules needed — unlike Zabbix where container support requires significant configuration.
Yes. Centralized log collection and search at 0.50€/GiB ingested. No separate log management tool needed alongside your monitoring platform.
Yes. Monitor up to 3 servers for free, forever. All features included — dashboards, alerts, service discovery, mobile apps.
Bleemeo is a fully managed SaaS platform with built-in redundancy. No need to set up Zabbix server clusters or manage failover — high availability is included.
Also compare Bleemeo to: