Application Monitoring
One Tag, One Dashboard for Every Service in Your Application
Group the services and uptime monitors that make up an application behind a single tag. Get a unified dashboard, automatic service discovery, and a public status page — without rebuilding your monitoring every time your stack evolves.
15-day free trial · No credit card required · Setup in 30 seconds
Trusted by 500+ companies to monitor their applications
Overview
A Tag-Based View of Your Application
Applications in Bleemeo are a simple idea: pick a tag, attach services and monitors to it, and get a live view of the whole cluster. Adding or removing a service is a one-label change, not a dashboard rewrite.
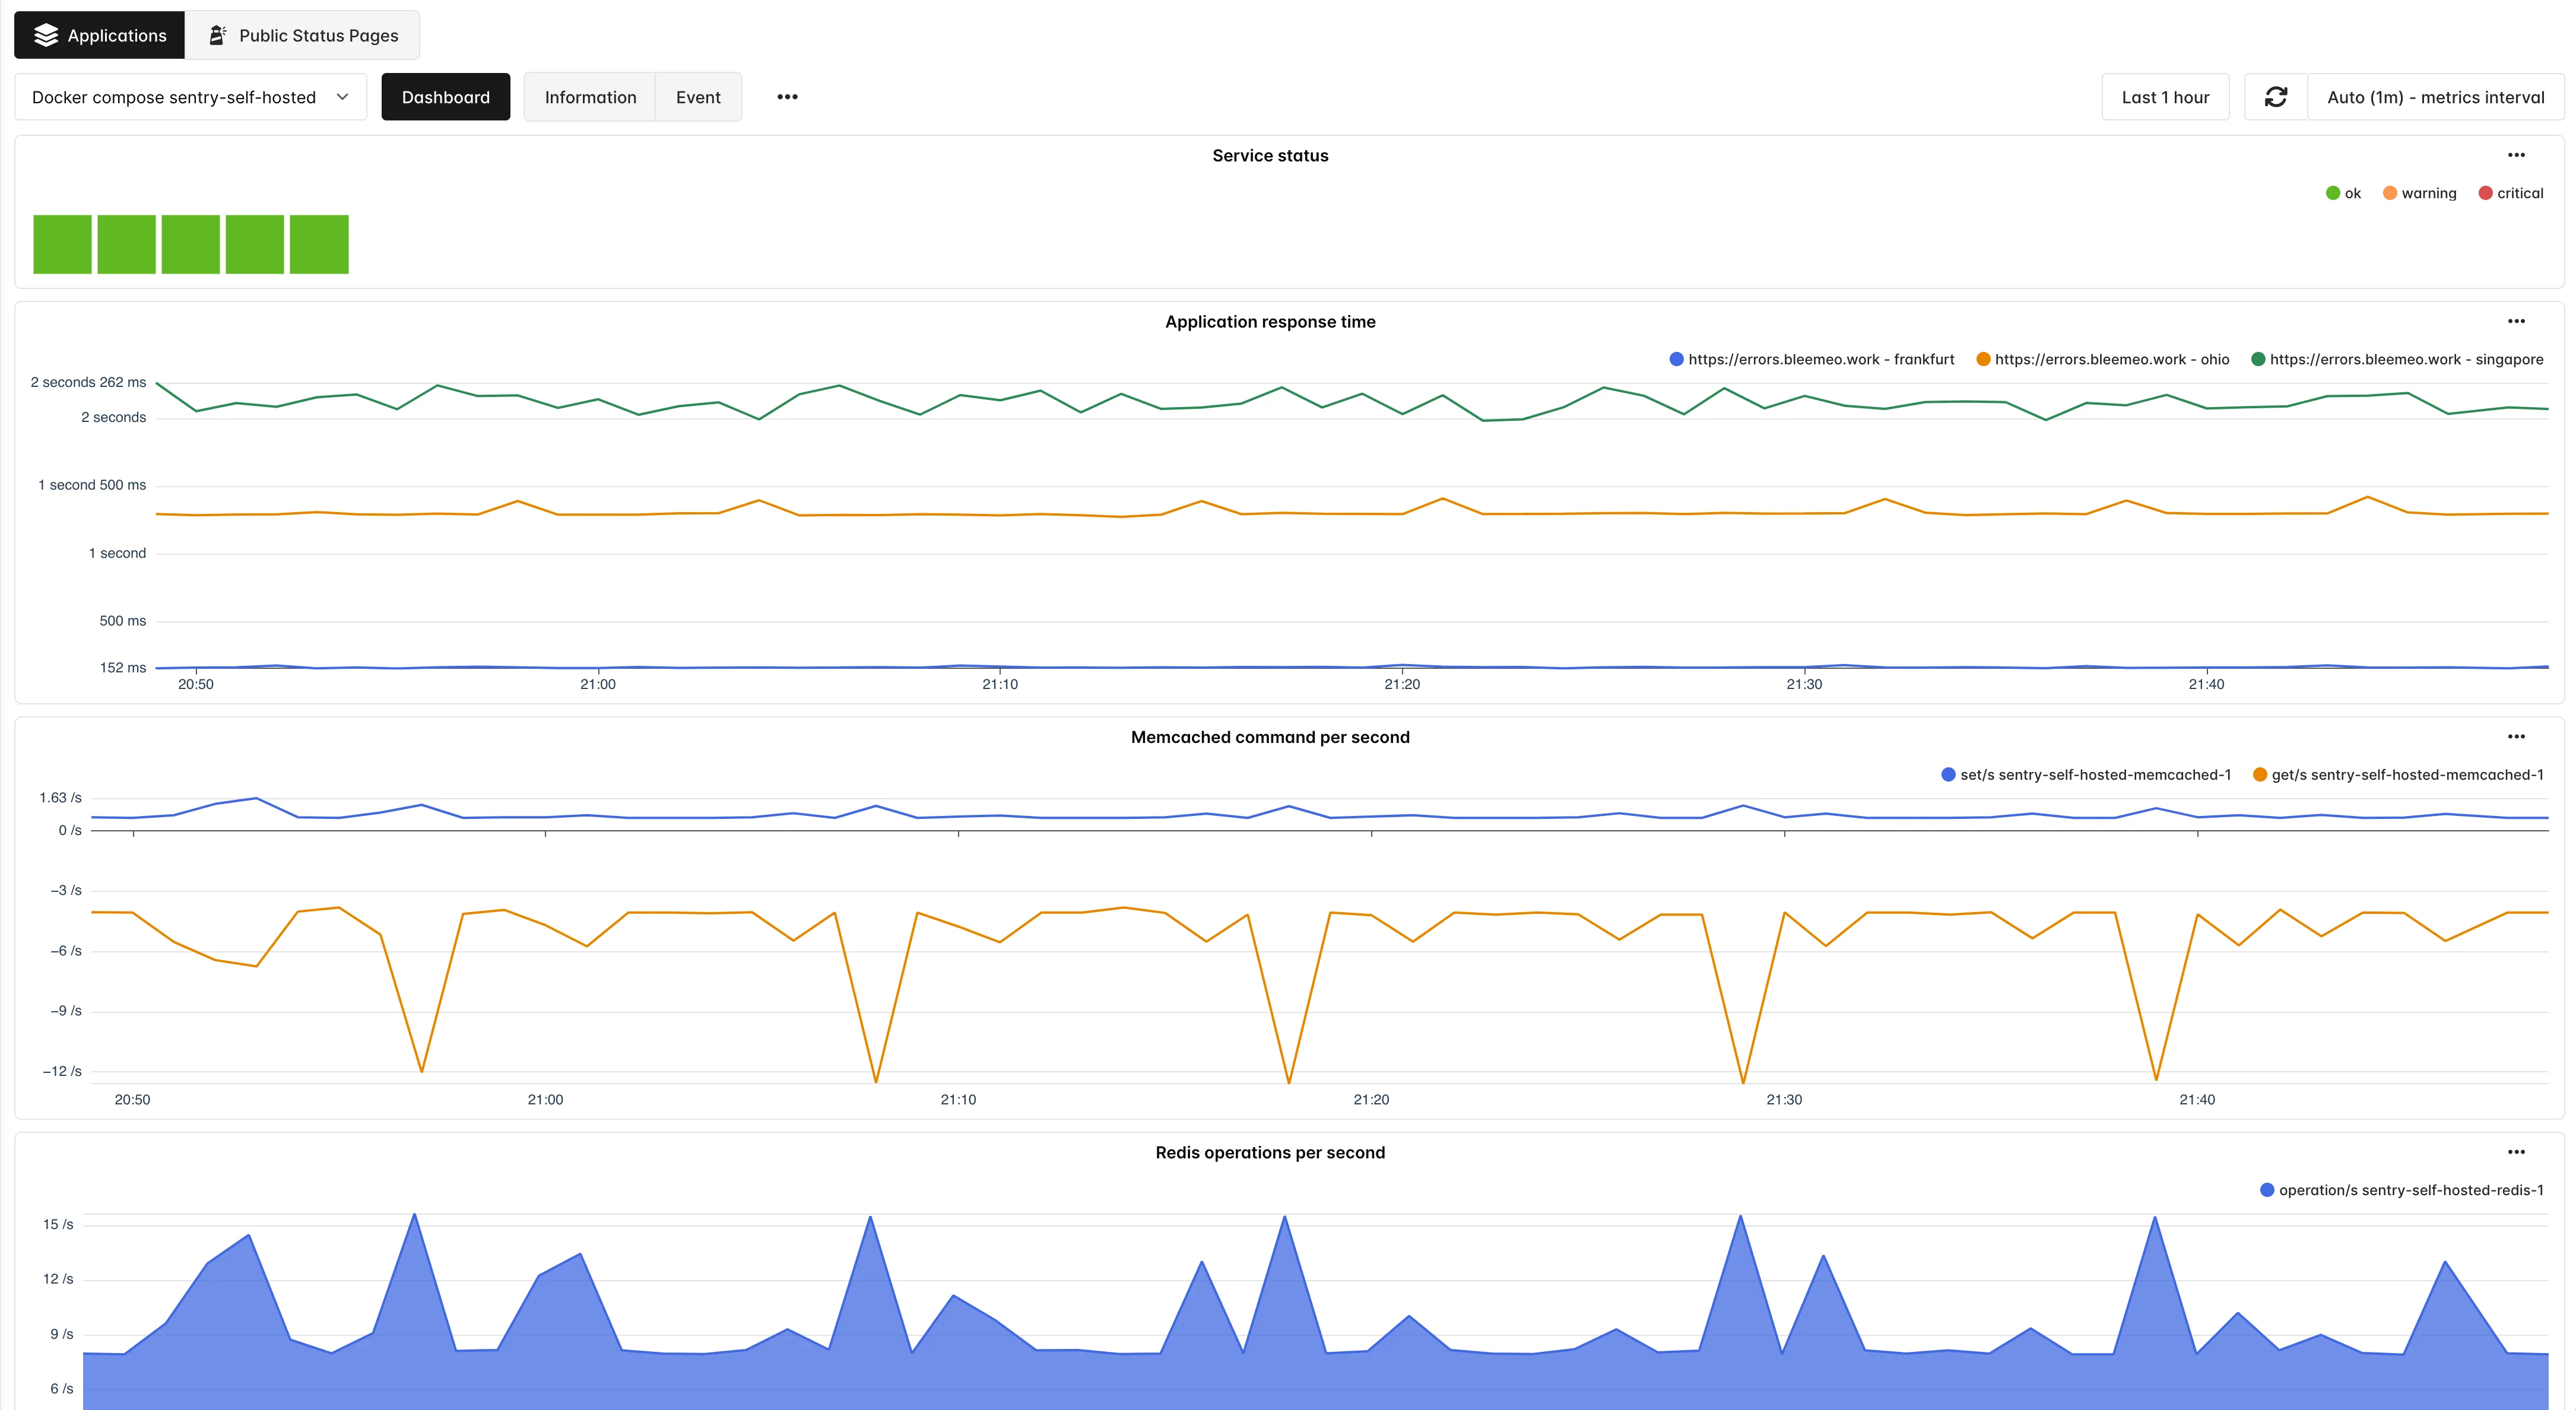
Cluster View
See every service of an application on one graph. Status rolls up to a single application health indicator.
Service Events
Dedicated timeline of status changes for every service in the application, perfect for post-incident review.
Response Time
Attach uptime monitors to the application tag and get an Application Response Time widget automatically.
Auto Compose Grouping
Glouton recognizes every Docker Compose project and creates an application for it with zero configuration.
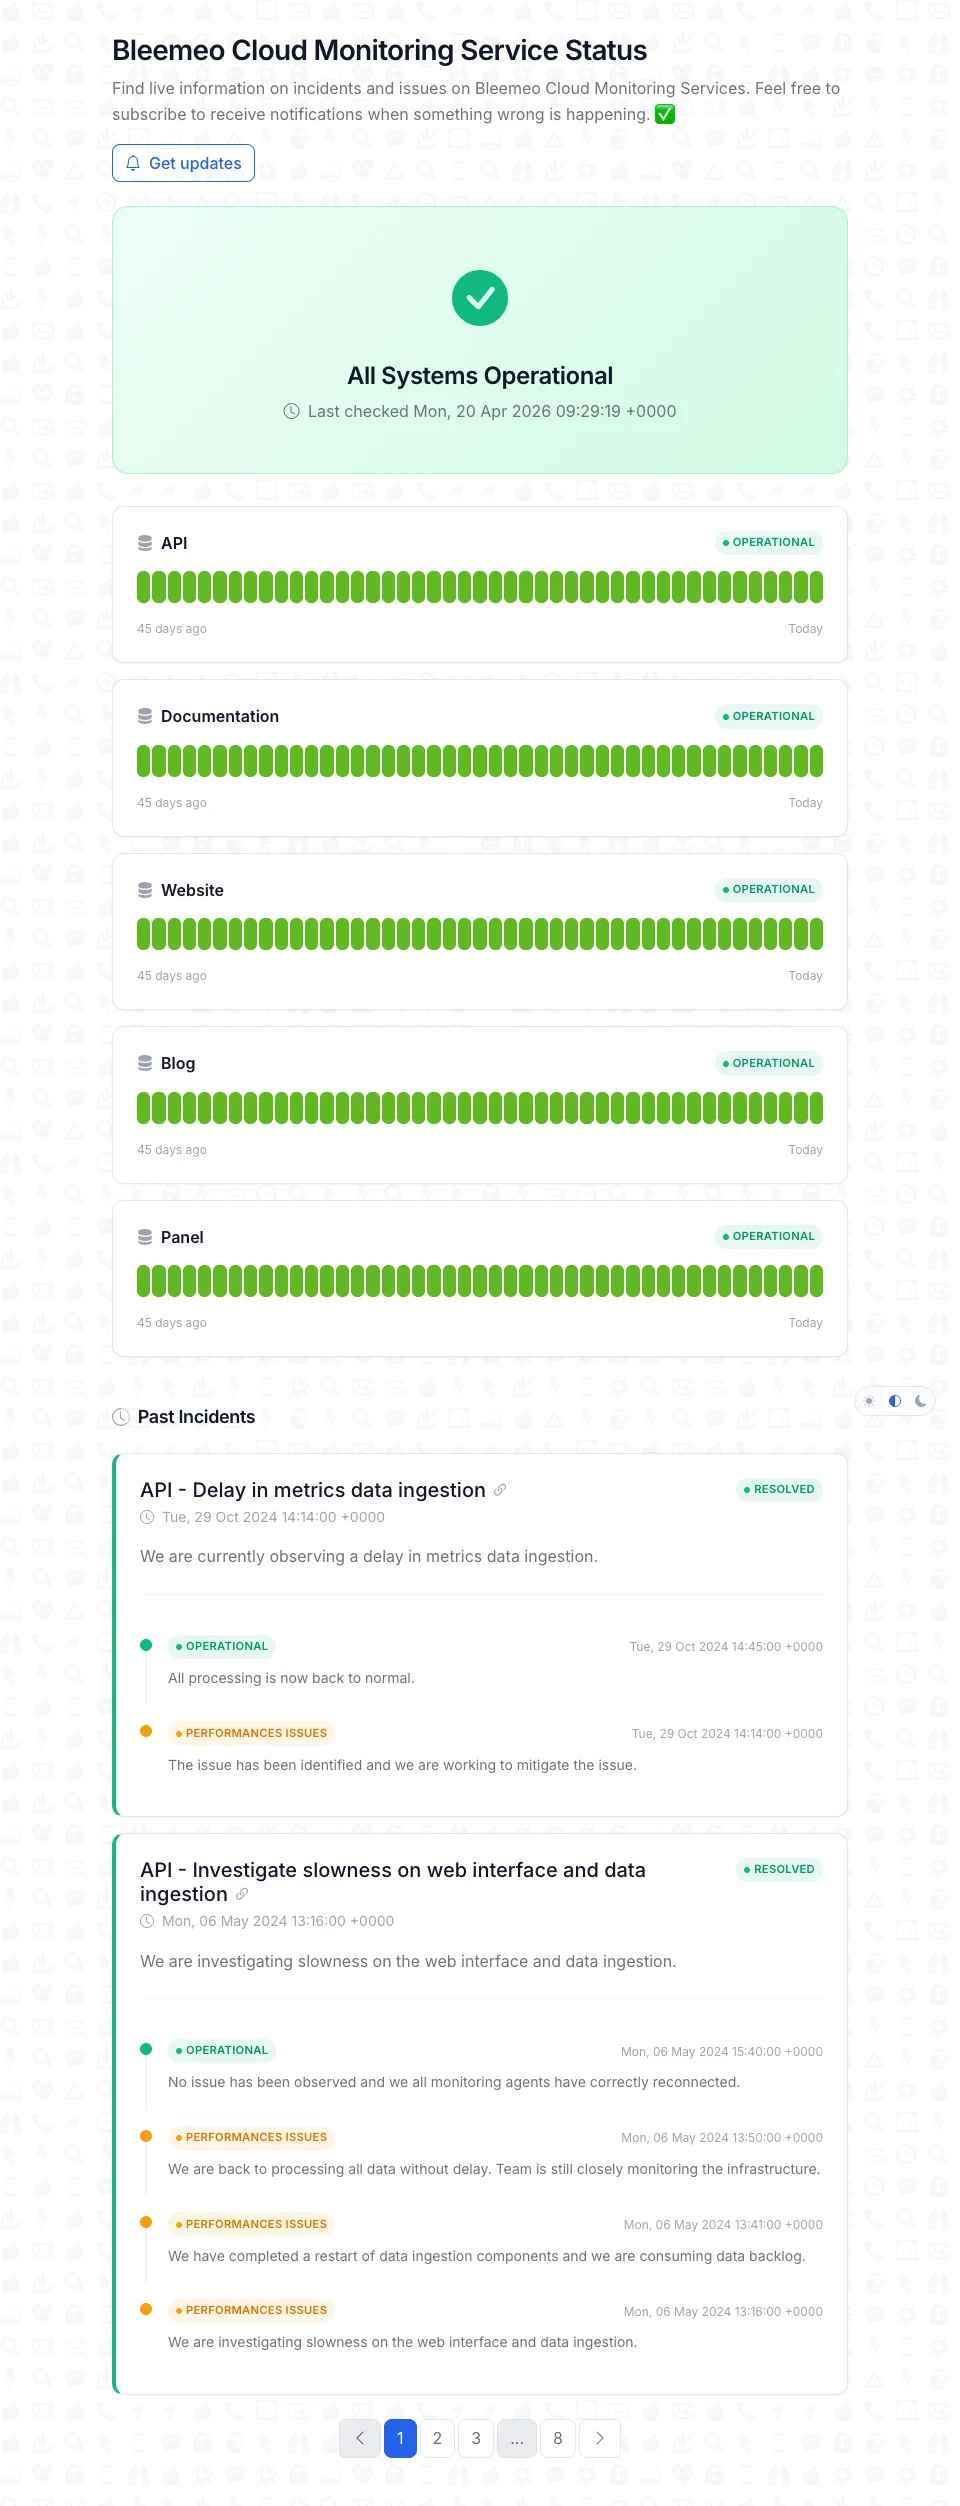
Public Status Pages
Publish real-time application health at status.bleemeo.com/<slug>/ for your customers.
Stack-Agnostic
Works with Prometheus exporters, JMX, StatsD, HTTP/TCP checks and 100+ auto-discovered services.
Grouping
Ways to Group Services into an Application
Tags can come from anywhere — automatic discovery, container labels, pod annotations, the Glouton config file, or the panel itself. Pick the one that matches how you already deploy.
Docker Compose (automatic)
Glouton uses the com.docker.compose.project label to group every service of a project into one application, with no config change needed.
services:
  web:
    image: nginx
  api:
    image: my/api
# Grouped automatically under the project name
Docker Labels
Override the default grouping or join services from multiple Compose projects by setting the glouton.tags label.
services:
  payments:
    image: my/payments
    labels:
      - glouton.tags=backend,payments
Kubernetes Annotations
Attach pods to an application with a single glouton.tags pod annotation on your Deployment, StatefulSet or DaemonSet.
spec:
  template:
    metadata:
      annotations:
        glouton.tags: "checkout"
Glouton Configuration
For bare-metal or custom setups, declare the service and its tags directly in a Glouton config file.
services:
  - type: "apache"
    instance: "web-01"
    tags:
      - frontend
Web Interface
Add or remove a tag from any service or monitor manually — useful for one-off grouping or for tagging uptime monitors that live only in the cloud.
- Edit tags directly from the Applications tab
- Tag source is visible (auto, config, manual)
- No agent restart required
Uptime Monitors
HTTP, TCP and ping monitors can carry the same tag as your services so external availability lives on the same dashboard as internal health.
- HTTP / TCP / ping checks
- Application Response Time widget
- Drive the public status page
Setup
Create an Application in Three Steps
Open the Applications Tab
In the Bleemeo panel, click Applications in the left navigation, then the + button.
Name the Application and Pick a Tag
Give the application a display name and a tag. You can reuse a tag that already exists on your services, or create a new one — every service or monitor carrying that tag will be grouped under the application.
Attach Services and Monitors
Add the tag to your services via Docker label, Kubernetes annotation, Glouton config, or the web interface. New services with the tag show up automatically.
# Docker Compose
labels:
  - glouton.tags=my-app

# Kubernetes
annotations:
  glouton.tags: "my-app"
How it works
How Tagging Builds Your Application View
Tags travel with your services regardless of how they are deployed. The platform reconciles them in real time into a single application entity.
Tag Source Is Always Visible
Each service attached to an application carries metadata about how the tag was applied: automatic (API-detected, Compose-derived), Glouton config, or manual (added in the panel). When you troubleshoot a mysterious membership, you always know where to look.
No More Dashboard Drift
Traditional dashboards rot when services come and go. With a tag-based application, the dashboard follows the tag: new services appear, scaled-down ones disappear, and the layout stays readable. The Reset button restores the auto-generated version whenever manual edits no longer serve you.
Multi-Tag Applications
A service can carry several tags — typical for shared components like a database that backs both the checkout and catalog applications. Use comma-separated values (glouton.tags=checkout,catalog) in Docker labels or Kubernetes annotations, and each application sees the shared service.
Public Status Pages Reuse the Same Model
A public status page is just a curated selection of applications rendered without authentication at status.bleemeo.com/<slug>/. Because the health is computed from the same tagged services and monitors, what you see internally and what your customers see never diverge.
Health
What an Application Health Covers
The rolled-up application status reflects every failure mode of its members — from container restarts to external uptime failures.
Service Failures
- Auto-discovered service down
- Custom TCP or HTTP check failing
- Process no longer running
- Container exited or restarting
External Availability
- HTTP uptime monitor failing
- TCP endpoint unreachable
- Ping check timing out
- Response time above threshold
Application Code
- Prometheus custom metric alert
- JMX metric threshold breached
- StatsD counter rate anomaly
- Nagios check returning CRITICAL
Infrastructure Spillover
- Host of a service OOM-killed
- Disk full on service node
- Pod stuck in CrashLoopBackOff
- Kubelet NotReady
Prometheus
Prometheus-Native from Exporter to PromQL
Bleemeo is a drop-in Prometheus-compatible backend for your applications. Instrument your code with the official client libraries, scrape any existing /metrics endpoint, and query everything with PromQL — the same language your team already knows.
Instrument Code with Official Prometheus Clients
Use the official Prometheus client libraries maintained by the Prometheus project and the CNCF ecosystem. Expose a /metrics endpoint and Glouton scrapes it — no vendor lock-in, no proprietary SDK, no re-instrumentation if you ever move.
from prometheus_client import Counter, start_http_server

checkout_total = Counter('checkout_total', 'Completed checkouts')
start_http_server(8000)  # /metrics served on :8000
Native /metrics Endpoints Everywhere
Thousands of modern applications expose Prometheus metrics out of the box — no exporter, no sidecar, no instrumentation work. Enable the Prometheus annotation (prometheus.io/scrape: "true") or add a URL to Glouton's config and the metrics flow to Bleemeo.


Browse all 60+ pre-built service integrations →·Or scrape any Prometheus endpoint yourself →
PromQL for Dashboards and Alerts
Every Bleemeo dashboard widget and alert rule speaks PromQL. Reuse recording rules from your existing Prometheus setup, mix application metrics with infrastructure metrics in the same query, and use the full power of rate(), histogram_quantile() and sum by() to express what matters to your team.
histogram_quantile(0.99,
  sum by (le, handler) (
    rate(http_request_duration_seconds_bucket{service="checkout"}[5m])
  )
)Public Status Pages, Built In
Every application can be published as a branded public status page at status.bleemeo.com/<slug>/ in one click. The page is unauthenticated, customer-facing, and shows the same real-time availability your on-call team sees internally — so what customers read never diverges from reality.
- Reuses your existing applications — no new configuration
- Multiple applications per page for product suites
- Real-time status computed from services and uptime monitors
- Reduces support load and provides SLA evidence
Benefits
Why Application Monitoring with Bleemeo?
Zero Dashboard Maintenance
The dashboard follows the tag. Deploy a new service and it appears automatically — no Grafana rewrite.
One Signal for On-Call
Every service failure rolls up to a single application health status, reducing alert fatigue.
Customer-Facing Transparency
Publish application uptime at status.bleemeo.com in one click — no separate status-page tool.
13 months Retention
Keep application-level history for SLA reporting, post-mortems, and trend analysis.
Definition
What Is Application Monitoring?
Application monitoring is the practice of tracking the health, availability and performance of a software application as a whole, rather than of each server, container or service in isolation. Modern applications span many moving parts — a database, a web tier, a background worker, a queue, often running on Kubernetes — and what matters to users is whether the application works, not whether any given pod is up.
In Bleemeo, an application is defined by a tag. Services and uptime monitors that carry the tag are grouped under the application, their statuses are rolled up into a single indicator, and their metrics are laid out on an auto-generated dashboard. The grouping is dynamic: adding a new replica, a new microservice, or a new uptime check just requires putting the right tag on it. The application view updates on its own.
The model is fully Prometheus-compatible, works with centralized logs for root-cause analysis, and powers public status pages so your customers see the same availability picture your on-call team sees — minus the internal details. One source of truth for internal observability and external communication.
Dashboard
What's on an Application Dashboard
Service Status Widget
Always present on the application dashboard, it lists every service carrying the application tag with its current state. Failures turn the widget — and the application-level status — red, so on-call can see at a glance which part of the application is degraded.
Application Response Time
Appears automatically when at least one uptime monitor carries the application tag. Plots latency over time for HTTP, TCP or ping checks so you can correlate user-visible slowdowns with backend service events.
Per-Service Widgets (Pro)
On the Professional plan, the dashboard is automatically populated with a dedicated widget per recognized service in the application — CPU and memory for a database, request rate for a web server, queue depth for a broker. You start with a meaningful layout instead of a blank canvas.
Application Information Tab
Lists every service and monitor attached to the application, grouped by how the tag was applied (automatic, Glouton config, manual). Use it to audit membership and remove stragglers after a deployment change.
Service Events Tab
A chronological feed of every status change inside the application — container restart, HTTP check flap, process gone — with timestamps. The first place to look after an incident, and the fastest way to spot a flapping dependency.
Rolled-Up Alerts
Every alert on a service of the application contributes to the application's status. Your on-call team sees one signal per application instead of one alert per component, with drill-down to the exact failing service.
Use cases
Use Cases
Microservice Rollouts
Group all microservices of a product behind an checkout tag. When a new service is added to the mesh, annotate it and it joins the application dashboard automatically — no Grafana change, no alert rule rewrite. Roll-ups surface a single health signal for the whole rollout window.
Docker Compose Stacks
Because Glouton auto-detects the Compose project, every docker compose up becomes a pre-built application view — ideal for dev environments, CI test stacks, or small self-hosted deployments where standing up an extra dashboard per project is overkill.
Customer-Facing SLAs
Publish application uptime on a public status page to communicate transparently during incidents, reduce support tickets, and provide evidence of SLA compliance — all computed from the same services and monitors you already have internally.
Shared Dependencies
Tag a shared database with both checkout and catalog. If the database degrades, both applications reflect it, and the on-call teams for each product see the incident on their respective dashboards without duplicating infrastructure.
Third-Party SaaS Integrations
Add an HTTP uptime monitor on a payment provider API, tag it with your application, and external dependency outages show up alongside internal service failures — no more "the app is down but everything is green" surprises.
Post-Incident Review
Use the Service Events tab to reconstruct the timeline of a degradation: which service failed first, which cascaded, which recovered. With 13 months of retained metrics, you can analyze slow-burning regressions too, not just acute incidents.
Best practices
Application Monitoring Best Practices
Name Tags After Business Domains
A tag like checkout or billing stays relevant across technology churn, while a tag like node-app-v2 becomes misleading within a quarter. Pick names that match the on-call rotation and the status-page language, not the current implementation.
Always Attach at Least One Uptime Monitor
Internal service health tells you the components are up; uptime monitors tell you the application is reachable from the outside. A tagged HTTP monitor gives you the Application Response Time widget for free and makes your public status page meaningful.
Let Docker Compose Group Itself
In dev and staging, rely on the automatic Compose grouping — no configuration, no drift. Reserve explicit glouton.tags labels for production deployments where you want to override the project name or join services across Compose files.
Tag Shared Components Explicitly
Databases, caches and message brokers often back several applications. Add comma-separated tags (glouton.tags=checkout,catalog) so every application that depends on the shared service sees its health and receives the alert on degradation.
Publish a Public Status Page Early
Even in beta, a public status page builds trust and reduces support load. Start with one page per user-facing application and iterate on the narrative later. Because the health data comes from the application itself, there is no extra operational cost.
Want to go further?
Read the DocumentationFrequently Asked Questions
Everything you need to know about application monitoring
What is application monitoring?
Application monitoring is the practice of tracking the health, availability and performance of a software application as a whole — across every service, container and external dependency that makes it work. It turns disparate per-component signals into a single view of whether the application is actually serving its users, and provides metrics, logs and alerts to diagnose issues fast.
Why is application monitoring important?
Application monitoring detects problems before users do, shortens incident response time, produces evidence for SLA compliance, and guides capacity planning. Without it, teams react to customer complaints instead of alerts, and root-cause analysis relies on manual log inspection across dozens of components.
What is the difference between application monitoring and infrastructure monitoring?
Infrastructure monitoring tracks servers, containers, disks and networks — the layer your application runs on. Application monitoring tracks the application itself: request rate, error rate, latency, business KPIs, external availability. Both are necessary, and a good platform correlates them so you can tell whether a slow checkout is caused by the code or by the host.
What is APM (Application Performance Monitoring)?
APM is a subset of application monitoring focused on code-level performance — response time, throughput, error rates, and (in some tools) distributed traces. Metrics-based APM relies on instrumented /metrics endpoints, typically powered by the official Prometheus client libraries, and is the approach used by modern cloud-native platforms.
How does Prometheus work for application monitoring?
Prometheus uses a pull-based model: your application exposes a /metrics endpoint (usually via an official client library), and an agent scrapes it on a regular interval. Metrics are stored as time series and queried with PromQL. Because the Prometheus text format is the de-facto standard, thousands of applications expose /metrics natively, and any Prometheus-compatible backend can ingest and query them.
Which Prometheus client libraries can I use?
The Prometheus project maintains official client libraries for Go (client_golang), Java (simpleclient, also Micrometer), Python (prometheus_client), Ruby (prometheus-client), and Rust (prometheus). Community libraries cover Node.js, .NET, PHP, C++, and many more. Each library lets you define counters, gauges, histograms and summaries on a /metrics endpoint.
What metrics should I monitor for a web application?
The canonical starting point is the RED method: Rate (requests per second), Errors (error rate), and Duration (latency distribution). Complement it with USE for resources — Utilization, Saturation, Errors — and a handful of business KPIs (checkout completion rate, signup rate). Expose them as Prometheus histograms and query with histogram_quantile() to track p50, p95 and p99.
How do I monitor microservices?
Group related microservices behind a shared identifier — typically a tag — so their health rolls up to a single application status. Instrument every service with a Prometheus client library, expose /metrics, and let the monitoring agent discover them automatically. Add external uptime monitors on the public entry point and correlate metrics with logs for root-cause analysis.
How do I measure application response time?
Two complementary approaches: external uptime monitors (HTTP, TCP, ping) measure response time from the user's perspective, while internal Prometheus histograms such as http_request_duration_seconds measure it inside the application. Use PromQL's histogram_quantile() function to compute p50, p95 and p99, and compare them against external measurements to detect network or CDN issues.
What is a public status page and why do I need one?
A public status page is a customer-facing URL that shows the real-time availability of your application and its ongoing incidents. It reduces support load during outages, communicates transparently with customers, and provides evidence of SLA compliance. The best status pages reuse the same monitoring data you use internally, so what customers see never diverges from on-call reality.