

Built on Prometheus & OpenTelemetry
No vendor lock-in
UptimeRobot does one thing: pinging URLs from the public internet and sending an alert when one fails. The moment you need to know why a check failed — slow database, saturated server, failed deployment — you start piecing together a second monitoring stack. Bleemeo bundles uptime monitoring with server, container and application monitoring, private probes and automatic public status pages. One agent. One platform. One bill.
15-day free trialNo credit card requiredNo long-term commitment
No vendor lock-in
Data stays in EU · GDPR compliant
Across Europe and beyond
Trusted by 500+ teams consolidating uptime and infrastructure monitoring
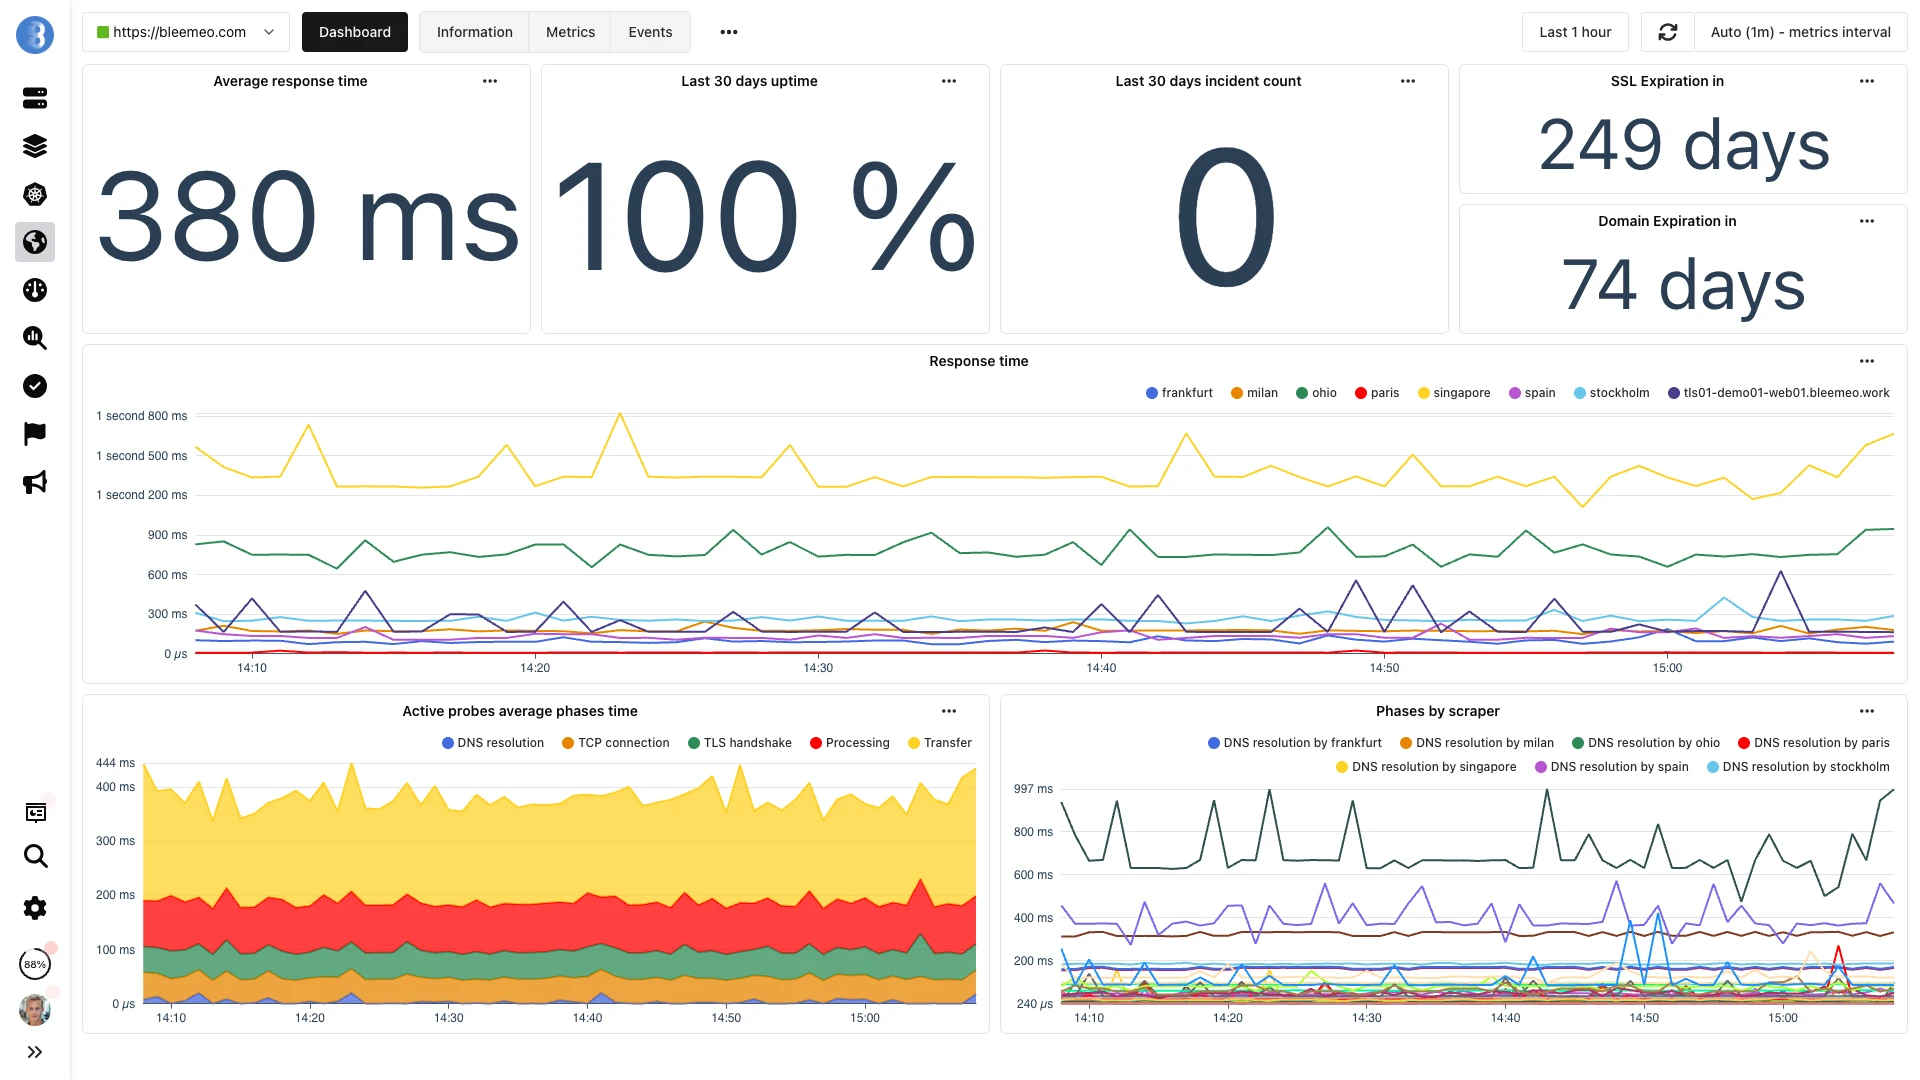
Uptime, latency and certificate health — all on the same dashboard as your infrastructure metrics
From sign-up to dashboard in 30 seconds — uptime, infra and logs in one place
One command, no configuration — metrics flowing in under a minute.
Why switch
UptimeRobot's probes live on the public internet, which is great for checking the front page of your marketing site but useless for anything behind a VPN or a firewall. Internal APIs, staging environments, admin dashboards and private Kubernetes services all sit in a blind spot unless you take the risky step of exposing them publicly just so UptimeRobot can reach them. Teams end up maintaining a second monitoring tool for their internal surface — exactly the kind of sprawl a dedicated uptime tool was supposed to prevent.
An UptimeRobot alert tells you a URL stopped responding, but not why. Was the database slow? Did a container get OOM-killed? Did a recent deployment introduce a regression? You answer those questions by SSH-ing into servers or jumping to a second monitoring tool — which defeats the point of having a uptime alert in the first place. The first signal arrives without any of the surrounding context that would make the incident actionable.
Every new service means another URL to register by hand. If you add three microservices to a Kubernetes deployment, UptimeRobot has no idea — you must open the UI, paste each URL, pick a check interval, and remember to clean up when a service is retired. In a fast-moving environment this administrative overhead stacks up until the tool becomes out of sync with reality, and dead URLs silently drop out of coverage or zombie monitors keep firing false alarms.
UptimeRobot is intentionally narrow — it pings endpoints, period. It does not see the host running your service, the container hosting your app, the database feeding your API, or the logs your application emits during a crash. Every additional signal requires another tool, another vendor, another dashboard to babysit. What looks cheap on paper becomes a fragmented stack where no one tool has enough information to debug an incident end-to-end.
During a short lunch break we installed Bleemeo, created a custom metric, tested alerts, and were ready for production. The speed of deployment is remarkable.

Head to head
| Feature | UptimeRobot | Bleemeo |
|---|---|---|
| Check Types | HTTP, HTTPS, keyword match, port (TCP), ping — five types on paid tiers | HTTP, HTTPS, TCP, ICMP (ping), SSL-TCP — with expected status codes, body match and custom headers |
| Private Probes | Limited — requires a paid tier and a separate agent deployment | Unlimited — every Glouton agent you deploy is automatically a private probe at no extra cost |
| Public Probes | Multiple regions worldwide | Frankfurt, Milan, Paris, Ohio and Singapore |
| SSL Certificate Expiry | Available, tracked per monitor | Automatic on every HTTPS monitor: warning at 20 days, critical at 10 days |
| Domain Expiration | Available as a separate monitor type | Automatic via WHOIS, same thresholds as SSL (20 / 10 days) |
| Public Status Page | Available, with full branding reserved to higher tiers | Branded page at status.bleemeo.com/<slug>/ driven automatically by applications, included on every paid plan |
| Auto-Discovery of Services | Every URL must be added manually | Glouton detects 100+ services (databases, web servers, queues) and auto-monitors them without configuration |
| Application Grouping | Each monitor is independent — no concept of an application that bundles multiple checks together | Tag services and monitors as an application; health rolls up to a single indicator and a single alert |
| Server Monitoring | Not included — requires a separate tool | CPU, memory, disk, network, processes on every agent, in the same dashboard as uptime |
| Container / Kubernetes | Not supported | Docker, containerd and Kubernetes natively supported, with auto-discovery of pods and services |
| Log Management | Not included | Built-in log collection at 0.50€/GiB ingested, correlated with uptime and infrastructure signals |
| Prometheus Compatibility | Not applicable — no metric ingestion | Native PromQL queries, scraping of any /metrics endpoint, recording and alerting rules |
| Mobile Apps | iOS & Android | iOS & Android with push notifications |
| Data Residency | US-hosted infrastructure | EU-hosted with GDPR compliance built in |
Private probes, auto-discovered services and a public status page — all on a 15-day free trial. No credit card.
Advantages
Every Glouton agent you deploy for infrastructure monitoring doubles as an uptime probe. Point it at an internal URL — a staging API, an admin dashboard, a Kubernetes internal service — and the availability metric flows into the same Bleemeo platform as your public checks. No VPN tunnels, no extra firewall rules, no exposing internal endpoints to the internet just to satisfy a monitoring tool. Unlimited private probes are included on every paid plan, which is the single biggest gap in UptimeRobot's coverage for teams with non-trivial private networks.
Glouton inspects running containers and processes and automatically recognizes 100+ services — PostgreSQL, Redis, NGINX, RabbitMQ, Kafka, MinIO and many more. Once detected, each service gets its specific metrics and contributes to the health of its parent application. You do not have to register each service as a separate monitor the way you would in UptimeRobot — infrastructure churn is reflected automatically, so coverage stays in sync with reality.
An application in Bleemeo is just a tag. Group the services and monitors that power a product behind the same tag, click "Publish", and a branded public status page appears at status.bleemeo.com/<slug>/. The page reflects real-time availability computed from the exact same data your on-call team uses internally — no separate status-page tool, no duplication, no drift between what you see and what customers see. Included on every paid plan at no extra cost.
Every HTTPS monitor automatically tracks the SSL certificate expiration and the domain's WHOIS expiration date. A warning alert fires 20 days before expiry, a critical alert 10 days before. No separate monitor to configure, no third-party certificate-tracking tool, no reading of cron-job output — the alert arrives in the same channel as the rest of your monitoring, with enough lead time to rotate or renew.
Glouton is your uptime probe, your server-metrics agent, your container-metrics agent, your Prometheus scraper and your log shipper — all in one binary. When an HTTP monitor fails, you have the host metrics, the container restart history, the application logs and the Prometheus metrics of the backing services all in the same platform, on the same timeline. Root-cause analysis becomes a matter of scrolling, not of jumping between five tools hoping their clocks agree.
Bleemeo infrastructure is hosted in the European Union. All uptime metrics, logs and monitoring data stay within EU data centres, with GDPR compliance baked into the product. For organisations subject to European data-sovereignty requirements or sector regulations (banking, healthcare, public services) this removes the friction of cross-Atlantic data flows that US-hosted monitoring vendors cannot fully avoid.
Status pages
Group services and monitors under an application tag, hit Publish, and your public status page goes live at status.bleemeo.com/<slug>/ — no separate status-page tool, no extra configuration.

Features
CPU, memory, disk, network throughput and process-level visibility on every host running Glouton. Correlate a failing uptime check with a saturated disk, a runaway process or an OOM-killed container in seconds — no need to log into the box.
Native monitoring of Docker, containerd and Kubernetes with per-container CPU, memory, I/O and HEALTHCHECK status. Service discovery reflects pod lifecycle events in real time.
Group services and uptime monitors into applications via a tag. Health is consolidated into a single indicator; a single alert covers the whole dependency chain.
Centralized logs with stdout and stderr capture from every container, searchable on the same timeline as metrics and uptime events. Flat 0.50€/GiB ingestion, no indexing surcharges.
Native PromQL queries and Prometheus-compatible storage. Glouton scrapes any /metrics endpoint you point it at, so you can carry your existing recording and alerting rules over unchanged.
ML-based anomaly detection reduces false positives; alerts fan out to email, Slack, Microsoft Teams, PagerDuty, webhooks and iOS / Android push — all channels included.
Migration
Most teams finish an UptimeRobot migration in an afternoon. The monitor list is small enough to recreate by hand (or via the API), and since Bleemeo runs its probes on parallel infrastructure you can keep UptimeRobot active until you are confident in coverage. Our engineering team assists with larger migrations at no extra cost.
Pull the list of active monitors from UptimeRobot's dashboard or API. For most teams this is a short spreadsheet of URL, check type, expected status and notification rules. Group monitors by the application they belong to — you will reuse that grouping in Bleemeo.
In the Bleemeo panel, open the Monitors section and create HTTP / HTTPS / TCP / ICMP / SSL-TCP monitors matching your list. Select the public probes you want (Frankfurt, Milan, Paris, Ohio, Singapore) and add private probes pointing to any Glouton agent you already have deployed.
For URLs that are not reachable from the public internet — staging environments, admin panels, internal APIs — install Glouton on a host inside the relevant network. The agent automatically becomes an available probe in the monitor UI and starts reporting latency and availability from that private location.
wget -qO- 'https://get.bleemeo.com?accountId=...'Tag each monitor with the application it belongs to (checkout, billing, marketing-site). Bleemeo automatically groups the tagged monitors — plus any discovered services carrying the same tag — into a single application view with a consolidated health indicator.
In the Applications section, pick the applications you want customers to see, give the page a slug, and click Publish. The page goes live immediately at status.bleemeo.com/<slug>/ and updates in real time from the same uptime data your on-call team relies on.
Run UptimeRobot and Bleemeo side by side for a week. Compare alert timing, response-time graphs and status-page output. Once alerts match and the team is comfortable, decommission the UptimeRobot monitors and update notification integrations.
Engineers and CTOs trust Bleemeo to monitor their infrastructure
We need our teams focused on our core business — digital signage — rather than on infrastructure monitoring. Bleemeo monitors our entire environment, from bare metal to Azure, and frees our teams from useless alerts while guaranteeing our quality of service.

Bleemeo has supported us for years: simple, reliable monitoring that is essential to the quality of service we owe our customers.

On-premise or in the cloud, Bleemeo monitors my clients' Kubernetes clusters without any complexity. A tool I recommend for its simplicity and the clarity it brings.

Customer since day one, I'm thrilled with Bleemeo. It's easy to install, efficient, and just keeps getting better!

During a short lunch break we installed Bleemeo, created a custom metric, tested alerts, and were ready for production. The speed of deployment is remarkable.
Bleemeo support is simply legendary — fast, knowledgeable, and always there when we need it.

Bleemeo was incredibly fast to deploy. In about an hour we rolled it out across more than 100 servers and immediately gained full visibility into our infrastructure.

We set up monitoring for all our servers in just a few hours. The dashboard is clear, powerful, and genuinely enjoyable to use.

We deployed Bleemeo across our server infrastructure in only a few hours. Uptime monitoring now alerts us instantly whenever a service encounters an issue.

See it live
Watch how teams go from install to full monitoring in under 5 minutes
UptimeRobot is a dedicated uptime-monitoring tool — it pings URLs and sends alerts. Bleemeo is a full monitoring platform that includes uptime checks plus server, container, application and log monitoring. One agent covers external uptime, internal services and the host itself, with metrics correlated across all layers.
Yes. Bleemeo supports HTTP, HTTPS, TCP, ICMP ping and SSL-TCP monitors from five public probes (Frankfurt, Milan, Paris, Ohio, Singapore), with configurable intervals, expected response codes, body matching and custom headers. SSL certificate and domain expiration checks are automatic on every HTTPS monitor.
A private probe is a Glouton agent running inside your network that performs uptime checks against URLs reachable only internally — staging environments, admin panels, internal APIs behind a VPN. UptimeRobot cannot reach these endpoints without exposing them to the public internet. With Bleemeo, every agent you deploy is automatically a private probe, at no extra cost.
Yes. Bleemeo publishes branded public status pages at status.bleemeo.com/<slug>/ without authentication. Pages are driven by applications — groups of tagged services and uptime monitors — so one click turns your existing monitoring data into a customer-facing availability view. Included on every paid plan, no add-on required.
Yes. Bleemeo's Free plan includes uptime monitoring at 5-minute intervals — the same frequency as UptimeRobot's Free tier. What the Free plan also bundles is server, container and log monitoring in the same agent, which UptimeRobot does not offer at any tier. Upgrade to Starter or Professional for 1-minute intervals.
HTTP, HTTPS, TCP, ICMP (ping) and SSL-TCP — five monitor types. Each monitor supports expected HTTP status codes, response body matching (required or forbidden text), custom request headers, and automatic SSL certificate and domain expiration tracking for HTTPS monitors.
Yes. Glouton detects 100+ services — databases, web servers, message queues, caches — by inspecting container images and process signatures. Each discovered service gets its specific metrics and can be grouped into an application along with its uptime monitors, so a single alert covers the whole dependency chain instead of one monitor per URL.
Yes. Every HTTPS monitor automatically tracks SSL certificate expiration: a warning alert fires 20 days before expiry, a critical alert 10 days before. Domain expiration is tracked the same way via WHOIS. Both are included at no extra cost.
There is no hard cap on monitor count. Pricing scales with agents (servers) rather than with the number of URLs you check, so if you already have agents deployed for server monitoring, adding uptime checks is free. Private probes are unlimited — add one per host where you run Glouton.
Most teams finish in an afternoon. Export your UptimeRobot monitor list, create matching monitors in Bleemeo (HTTP/HTTPS/TCP/ICMP/SSL), attach them to applications for automatic status-page grouping, run both tools for one week for validation, and then switch. Our team helps with large migrations at no extra cost.