Container Monitoring
Docker, containerd and every service running inside your containers
Full visibility into your container fleet — CPU, memory, I/O, network and health checks per container, plus automatic discovery of the services running inside. Works on any Docker or containerd host, with or without Kubernetes.
15-day free trial · No credit card required · Setup in 30 seconds
Trusted by 500+ companies to monitor their containers
Overview
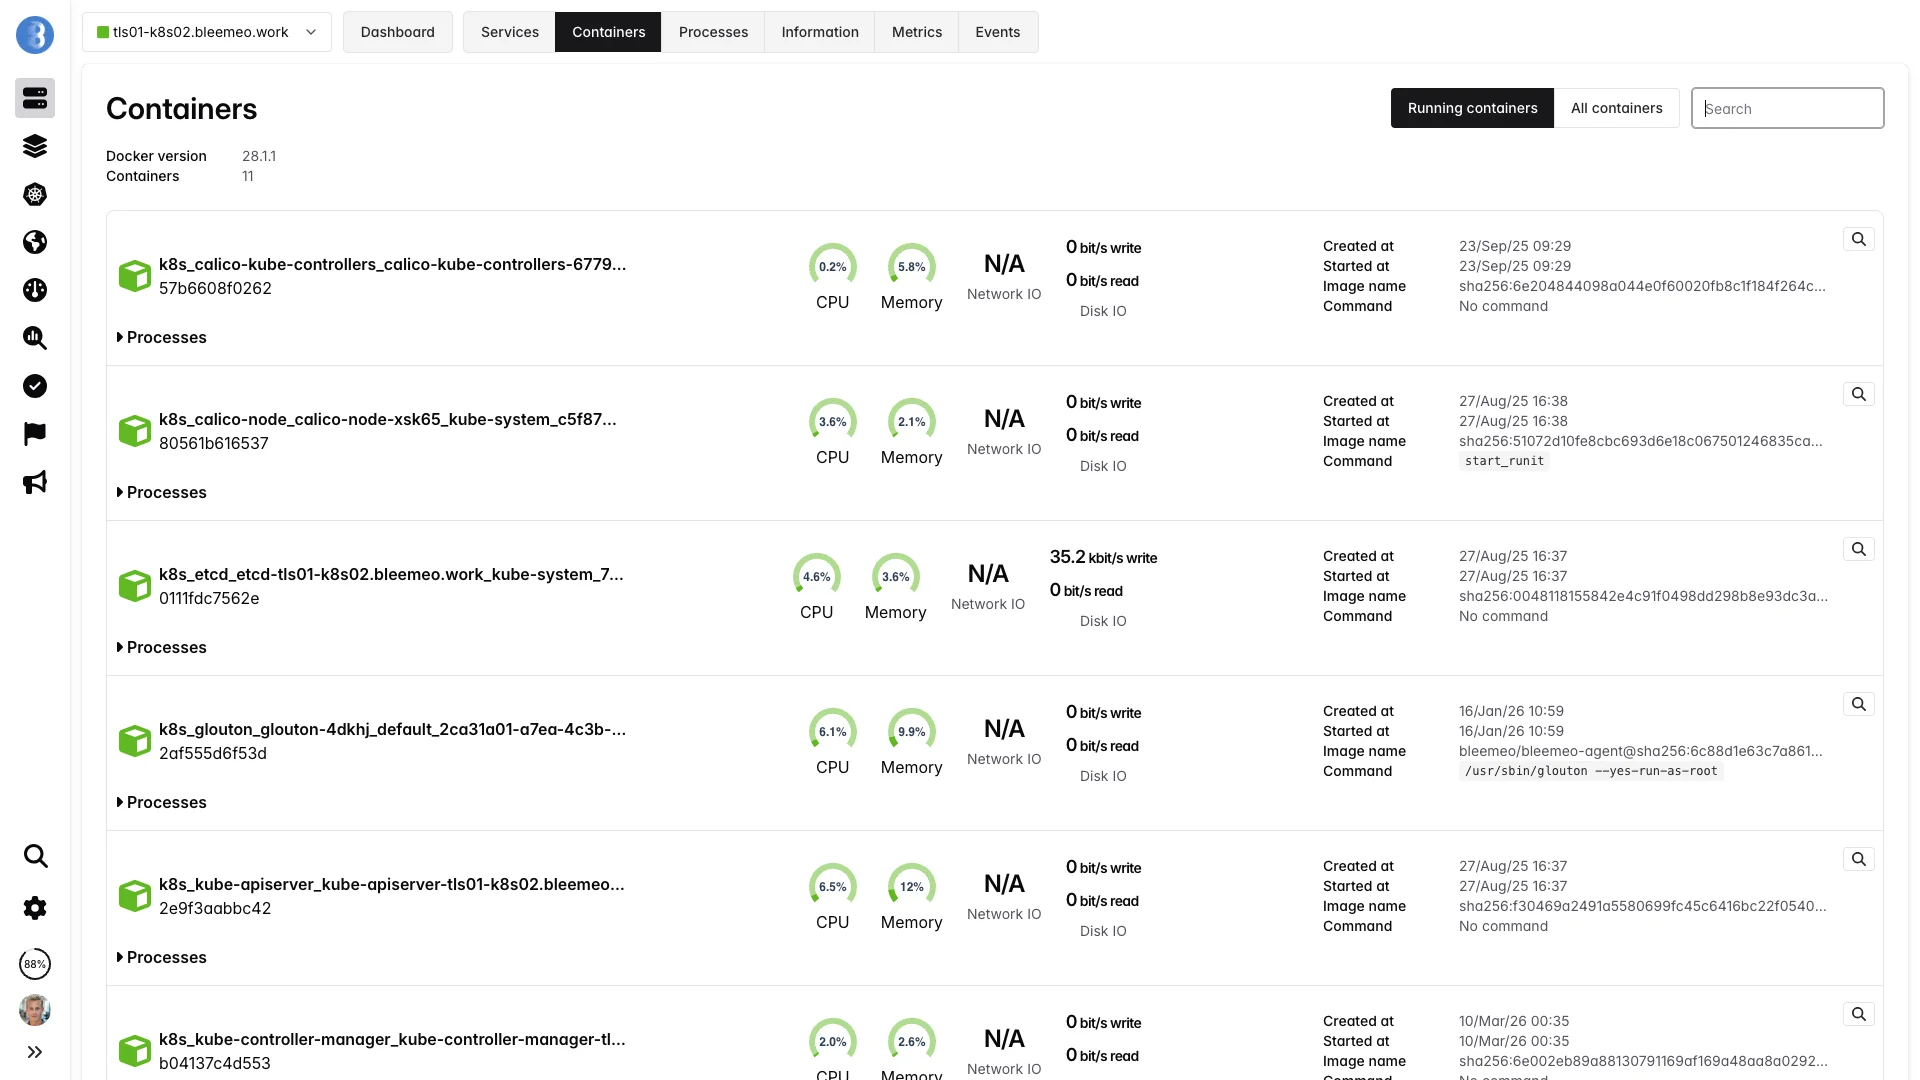
A Live View of Every Container on Every Host
Containers are ephemeral by design — they start, stop and move several times a day. Bleemeo turns this churn into a stable observability layer by reading the runtime socket directly and tracking each container through its whole lifecycle.
Runtime Agnostic
Native support for Docker and containerd. Connect to the socket and Bleemeo enumerates every container, running or stopped.
Per-Container Metrics
CPU, memory, disk I/O, network throughput and health-check status — every metric is labelled with container name, image and ID.
Health Checks
Docker HEALTHCHECK results are exposed as a first-class metric and drive alerts automatically.
Docker Compose Ready
Every Compose project is recognised and grouped into a single application for easy dashboarding.
Service Discovery
PostgreSQL, Redis, NGINX, RabbitMQ and 100+ services are detected inside containers and monitored with zero configuration.
Prometheus-Native
Add prometheus.io/scrape: "true" on a container and the agent scrapes its /metrics endpoint automatically.
Metrics
What Bleemeo Collects per Container
Every metric is gathered directly from the container runtime — no sidecar, no manual instrumentation.
CPU & Memory
Track how containers consume the host resources over time, with both raw and percentage values.
-
container_cpu_used— CPU percent -
container_mem_used— memory in bytes -
container_mem_used_perc— memory percent - Status metric crosses configurable thresholds
Disk I/O
Read and write throughput per container, aggregated across all mounted volumes.
-
container_io_read_bytes— bytes/s read -
container_io_write_bytes— bytes/s written - Correlate with host disk metrics
- Spot runaway I/O on a single container instantly
Network
Inbound and outbound bandwidth per container, no matter how the container network is configured.
-
container_net_bits_recv— bits/s received -
container_net_bits_sent— bits/s sent - Bridge, host and user-defined networks supported
- Traffic tagged with container name and image
Health & Lifecycle
The output of the Docker HEALTHCHECK directive is exposed directly, along with container state.
-
container_health_status— starting / healthy / unhealthy - Created, started, stopped timestamps
- Restart count
- Kill and OOM events
Metadata
A copy of Docker/containerd inspect output is attached so you always know what you are looking at.
- Container name and ID
- Image name and tag
- Entrypoint and command
- Labels and Compose project
Service Metrics Inside
Recognised services running inside containers get their own specific metrics — replication lag for databases, queue depth for brokers, request rate for web servers.
- Detection from image and process signature
- Specific metrics per service type
- Zero configuration required
- 100+ services — see the catalog below
Auto-discovery
Services Auto-Discovered Inside Containers
When a recognised service runs inside a container, Bleemeo detects it from the image and process signature and starts collecting its specific metrics — no sidecars, no exporters, no configuration. Here is a selection of popular ones; the catalog holds 60+ with Prometheus-native integration and many more via Telegraf.


Capabilities
Container-Native Features
Docker & containerd
Connect to /var/run/docker.sock or /run/containerd/containerd.sock. Both runtimes are first-class citizens, no plugin required.
Label-Driven Config
Control monitoring with Docker labels: glouton.enable, glouton.check.ignore.port.*, glouton.allow_metrics, glouton.deny_metrics.
OpenTelemetry Ready
Ingest OTLP traces and logs from your containers alongside native metrics. Use the agent as a local OpenTelemetry collector without deploying a separate binary.
Prometheus Scraping
Annotate a container with prometheus.io/scrape: "true" and its /metrics endpoint is pulled into the same dashboards as the runtime metrics.
Centralised Logs
Container stdout and stderr can be captured and centralised alongside metrics for full-context debugging.
Built-In Alerts
Pre-configured alerts for container OOM, restart loops, unhealthy status and resource saturation — no rule writing required.
Filtering
Allow/deny list with wildcards (bleemeo_*, *_builder) skips ephemeral CI runners, builder containers and debug sidecars.
Low Overhead
The agent itself runs as a single container (or on the host) and uses under 100 MB of memory even when monitoring hundreds of containers.
Setup
Deploy in Three Steps
Run the Agent Container
Start the Glouton container on each host, mounting the Docker socket read-only. The agent connects to the runtime and begins discovering containers immediately.
docker run -d --name="bleemeo-agent" --restart unless-stopped \
    -v /var/lib/glouton:/var/lib/glouton \
    -v /var/run/docker.sock:/var/run/docker.sock \
    -v /:/hostroot:ro \
    -e GLOUTON_BLEEMEO_ACCOUNT_ID=your_account_id \
    -e GLOUTON_BLEEMEO_REGISTRATION_KEY=your_registration_key \
    --pid=host --net=host \
    --cap-add SYS_PTRACE --cap-add SYS_ADMIN \
bleemeo/bleemeo-agentContainers Appear Automatically
Every running container shows up in the web interface within seconds, with metrics streaming live. New containers join as they are created.
Tune with Labels
Optionally add labels to Compose or plain Docker containers to expose custom metrics or exclude specific containers.
services:
  api:
    image: my/api
    labels:
      - prometheus.io/scrape=true
      - prometheus.io/port=8080
  ephemeral-worker:
    image: my/worker
    labels:
      - glouton.enable=false
How it works
How the Agent Sees Your Containers
Glouton runs once per host and connects to the runtime. It polls container statistics, subscribes to lifecycle events, and forwards everything to Bleemeo Cloud.
One Agent, Two Runtimes
Glouton does not care whether the host runs Docker, containerd, or both simultaneously. It connects to each available socket, deduplicates containers that appear in both (common on Kubernetes nodes that keep Docker for legacy reasons), and exposes a single consolidated view.
Label-First Configuration
Behaviour is controlled through Docker labels: glouton.enable to exclude a container entirely, glouton.check.ignore.port.* to skip a wrongly detected service port, prometheus.io/scrape for custom metrics. No central config edits, no agent restarts — just redeploy the container and the change takes effect.
Lifecycle Events in Real Time
The agent subscribes to the runtime event stream (start, stop, kill, destroy) and reflects them immediately in the Bleemeo platform. A failing container stops reporting CPU metrics and produces a visible event on the timeline — you always know whether a gap is due to an outage or a stopped container.
Allow/Deny Filtering
Use the container.filter config to keep monitoring focused on production workloads. Allow lists and deny lists support wildcards (bleemeo_*, *_builder) and the deny list always wins — perfect for excluding ephemeral CI runners, short-lived builders or debug sidecars from your alerting surface.
Alerting
Built-In Alerts for Common Container Failures
Get notified before a single container drags down the whole stack — without writing a single alert rule.
Lifecycle
- Container OOM-killed
- Unexpected exit with non-zero code
- Restart loop detected
- Container stopped but expected running
Health
- Docker HEALTHCHECK unhealthy
- Health status flapping
- Auto-discovered service down
- Custom TCP/HTTP check failing
Resource Pressure
- CPU sustained above threshold
- Memory percent above threshold
- Disk I/O runaway
- Network saturation
Runtime
- Docker daemon not reachable
- containerd socket unavailable
- Image pull failure
- Storage driver error
Benefits
Why Container Monitoring with Bleemeo?
Zero-Config Discovery
Containers appear automatically in seconds. No pod selectors, no exporters, no per-container scrape configs to maintain.
Right-Size Resources
Compare actual CPU and memory usage to the limits set in your Compose files and spot over- or under-provisioned containers.
Lightweight Agent
Under 100 MB of memory per host, even when monitoring hundreds of containers. One container, no sidecar sprawl.
13 months Retention
Keep container history long enough for post-mortems, capacity planning and trend analysis.
Definition
What Is Container Monitoring?
Container monitoring is the practice of tracking the health, performance and resource usage of containerised workloads — whether they run under Docker, containerd, Podman or CRI-O. Because containers are ephemeral and share the host kernel, they require a different approach from traditional server monitoring: the agent must enumerate containers from the runtime API, read cgroup statistics, and track containers through their whole lifecycle — start, stop, restart, kill, destroy.
A complete container-monitoring solution covers three layers. First, runtime metrics: number of running containers, daemon health, image pull errors. Second, per-container metrics: CPU percent, memory bytes, disk I/O, network throughput, and the result of the HEALTHCHECK directive. Third, in-container metrics: the applications running inside — databases, web servers, message queues — discovered automatically and monitored with their specific plugins.
Container monitoring is distinct from Kubernetes monitoring: you do not need an orchestrator to benefit from it. Docker Compose stacks, single-host Docker servers, Podman pods and standalone containerd installations all benefit from the same metrics and the same Prometheus-compatible query surface. Whether you later adopt Kubernetes or not, the container-level signals remain the foundation of your observability stack.
Deep dive
Container Metrics in Detail
CPU Usage
Reported as a percentage of a full host CPU core (container_cpu_used). Tracks total CPU time consumed by all processes inside the container, normalised against the container's CPU quota and the number of available cores. Useful to spot runaway workers or mis-tuned thread pools.
Memory Usage
Reported both in bytes (container_mem_used) and as a percentage of the container limit (container_mem_used_perc). Includes RSS and cache. A container approaching 100% is at risk of being OOM-killed — Bleemeo alerts you before that happens.
Disk I/O
Read and write throughput in bytes per second (container_io_read_bytes, container_io_write_bytes). Aggregated across every block device the container touches. Essential for spotting I/O-bound containers before they saturate the host disk.
Network Throughput
Received and sent bits per second (container_net_bits_recv, container_net_bits_sent). Works on bridge, host and user-defined networks alike, by reading interface counters from the container network namespace.
Health Status
The result of the Docker HEALTHCHECK directive, exposed as container_health_status with values starting, healthy or unhealthy. Alerts fire automatically on unhealthy, and status flapping is tracked explicitly.
Global Runtime
Runtime-level aggregates like containers_count plus Docker daemon and containerd health facts. Useful to detect broken runtimes before individual container metrics start disappearing from your dashboards.
Use cases
Use Cases
Docker Compose Stacks
Every docker compose up is automatically grouped into an application via its project name. Development and small production stacks get a pre-built dashboard with service status, CPU, memory and I/O per container — no configuration required.
Single-Host Docker
Ideal for small SaaS products, self-hosted tooling and homelabs. One host, a handful of containers, everything visible from one dashboard — with alerts on OOM and unhealthy health checks out of the box.
Migration Away from VMs
Monitor the new containerised version side-by-side with the legacy VM. Compare CPU and memory footprints, request latencies and error rates to justify the cutover with real data instead of gut feel.
containerd Without Kubernetes
Run containerd directly as a lightweight runtime for multi-tenant nodes, edge servers or custom orchestration scripts. Bleemeo attaches to the containerd socket and treats your containers exactly like Docker ones.
Kubernetes Node Underlay
Even on Kubernetes, container-level metrics remain valuable. Use Bleemeo's container view to spot rogue sidecars, correlate restarts with kernel events, and debug issues that the Kubernetes layer abstracts away.
Post-Incident Review
With 13 months of retained metrics and lifecycle events, reconstruct the exact sequence of container starts, restarts and OOM kills during an outage — without relying on volatile Docker logs.
Best practices
Container Monitoring Best Practices
Declare a HEALTHCHECK in Every Image
A Docker HEALTHCHECK is the cheapest way to turn a black-box container into a monitored workload. Add one to every Dockerfile you own — even a simple curl against a /health endpoint — and Bleemeo will alert on unhealthy status for free.
Set Memory Limits on All Containers
Without memory limits, the container_mem_used_perc metric is meaningless: the container can use the entire host before hitting a wall. Always declare a limit in Compose or the Docker run command so that right-sizing decisions are based on real percentage data.
Exclude Ephemeral Containers
CI runners, image builders and one-shot migration jobs flood dashboards with short-lived noise. Use glouton.enable=false labels or the container.filter.deny_list config (*_builder, ci_runner_*) to keep the signal focused on long-running workloads.
Expose Application Metrics via Labels
For custom applications, add prometheus.io/scrape: "true" and prometheus.io/port labels to expose a /metrics endpoint. Bleemeo scrapes it automatically and the application metrics show up on the same container dashboard as CPU and memory.
Correlate with Container Logs
A container restart count climbing tells you something is wrong; the container logs tell you exactly what. Enable log collection alongside metrics — Bleemeo captures stdout and stderr per container and links them to the same timeline as your alerts.
Want to go further?
Read the DocumentationFrequently Asked Questions
Everything you need to know about container monitoring
What is container monitoring?
Container monitoring is the practice of tracking the health, performance and resource usage of containerised workloads — Docker, containerd, Podman or CRI-O — along with the applications running inside them. It provides CPU, memory, I/O, network and health-check metrics per container, plus auto-discovery of services so every new container is monitored without manual configuration.
Why is container monitoring important?
Containers are ephemeral: they start, stop, scale and move across hosts many times per day. Without monitoring, teams cannot correlate incidents with container lifecycle events, detect OOM kills or restart loops, or right-size resource limits. Proper container monitoring exposes resource saturation early, reduces mean time to resolution, and turns the fleet of short-lived containers into a stable observability surface.
What metrics should I monitor for a Docker container?
The core set is CPU usage percent, memory used (absolute and percent), disk I/O read and write throughput, network bytes received and sent, restart count and the container health-check status. Also track container-level events (start, stop, kill, OOM) and, for each discovered service, the relevant application metrics such as request rate and latency.
What's the difference between container monitoring and Kubernetes monitoring?
Container monitoring focuses on individual containers and their runtime (Docker or containerd) — useful on any host, with or without an orchestrator. Kubernetes monitoring adds cluster-level concepts: pods, nodes, namespaces, API server, etcd, scheduler, DaemonSets. You can run container monitoring on a Kubernetes node, but Kubernetes monitoring requires a cluster-aware agent.
Does container monitoring work without Kubernetes?
Yes. Container monitoring predates Kubernetes and is especially common for Docker Compose stacks, single-host Docker deployments, Podman environments and containerd-only installations. The monitoring agent connects to the container runtime socket (typically /var/run/docker.sock or the containerd socket) and collects metrics directly, without any orchestrator.
How do I monitor Docker Compose?
Docker Compose monitoring works by pointing a container-aware agent at the Docker socket on the host running your Compose stack. The agent enumerates every container in the project and collects per-container CPU, memory, I/O and health metrics automatically. Modern agents also recognise the com.docker.compose.project label and group every service of a project into a single application view, so one docker compose up produces a pre-built dashboard without manual configuration.
How does a monitoring agent collect Docker container metrics?
The agent queries the Docker Engine API (or the containerd gRPC API) to enumerate containers and read their cgroup-level statistics: CPU time, memory usage, block I/O and network counters. It also reads the result of Docker HEALTHCHECK commands, inspects container metadata (image, command, labels, dates) and listens to container events (start, stop, kill) in real time.
How do I monitor containerd containers?
Point the monitoring agent at the containerd socket (typically /run/containerd/containerd.sock) and it will enumerate namespaces and containers via the containerd API, collecting the same CPU, memory, I/O and network metrics as Docker. This is the common setup for Kubernetes nodes that dropped Docker, but it also works on standalone hosts running containerd directly.
How do I filter which containers are monitored?
Use container-name allow/deny lists with wildcard support in the agent configuration, and Docker labels (e.g. glouton.enable=false) to exclude specific containers inline. Allow lists are useful when you want to monitor only a subset; deny lists are useful to skip short-lived CI runners, builder containers or ephemeral sidecars. The deny list always takes precedence over the allow list.
Can I monitor a service running inside a container?
Yes. Modern monitoring agents auto-discover services inside containers — PostgreSQL, Redis, NGINX, RabbitMQ and hundreds more — by inspecting the image and process signature. They then run the appropriate Telegraf plugin or Prometheus scrape against the container's IP and port. You can also add Prometheus annotations (prometheus.io/scrape: "true") to expose custom application metrics.
What is Docker health check monitoring?
Docker HEALTHCHECK is a directive in a Dockerfile or Compose file that runs a command at a regular interval to assess whether the container is healthy. A monitoring platform exposes the result of that check (starting, healthy, unhealthy) as a metric and triggers an alert when the container flips to unhealthy — without requiring any extra probing logic outside the container.
How do I monitor container logs?
Container log monitoring captures the stdout and stderr streams of each container via the runtime logs API (Docker Engine API, containerd CRI). A complete platform forwards these logs to centralized logs alongside metrics, so you can correlate an error log line with the CPU spike or OOM kill that caused it. Add a parser — JSON, CRI, syslog — to extract structured fields, and use labels or annotations to include or exclude specific log streams.