From Install to Full Monitoring in 5 Minutes
One lightweight agent. Automatic discovery. Instant dashboards and alerts. No configuration files, no query language to learn, no infrastructure to maintain.
No credit card required · 15-day free trial · Cancel anytime
How it works
4 Steps to Production-Ready Monitoring
Get complete infrastructure visibility without spending hours on configuration
Create your account
Sign up for free — no credit card, no commitment. You'll get your account credentials and access to the Bleemeo dashboard immediately. Your account comes with a 15-day full-featured trial so you can evaluate every capability before choosing a plan.
Create your free account# Debian / Ubuntu / Red Hat / CentOS
wget -qO- 'https://get.bleemeo.com?accountId=...'
# Docker
docker run -d --name bleemeo-agent bleemeo/bleemeo-agentInstall the agent
A single command installs Glouton, our lightweight open-source agent. It runs with minimal resource footprint (typically under 100 MB of RAM) and requires zero configuration files. Glouton supports Linux (Debian, Ubuntu, RHEL, CentOS), Docker containers, and Kubernetes via Helm chart. The agent communicates over HTTPS and only sends metrics outbound — no inbound ports needed.
View installation docsAutomatic discovery
Within seconds, Glouton automatically detects your running services and starts collecting the right metrics for each one. It recognizes databases like MySQL, PostgreSQL, Redis, and MongoDB, web servers like Apache and Nginx, message brokers like RabbitMQ and Kafka, container runtimes, Kubernetes pods, and dozens more. When you add or remove a service, Glouton adapts automatically — no restart, no reconfiguration.
See supported integrations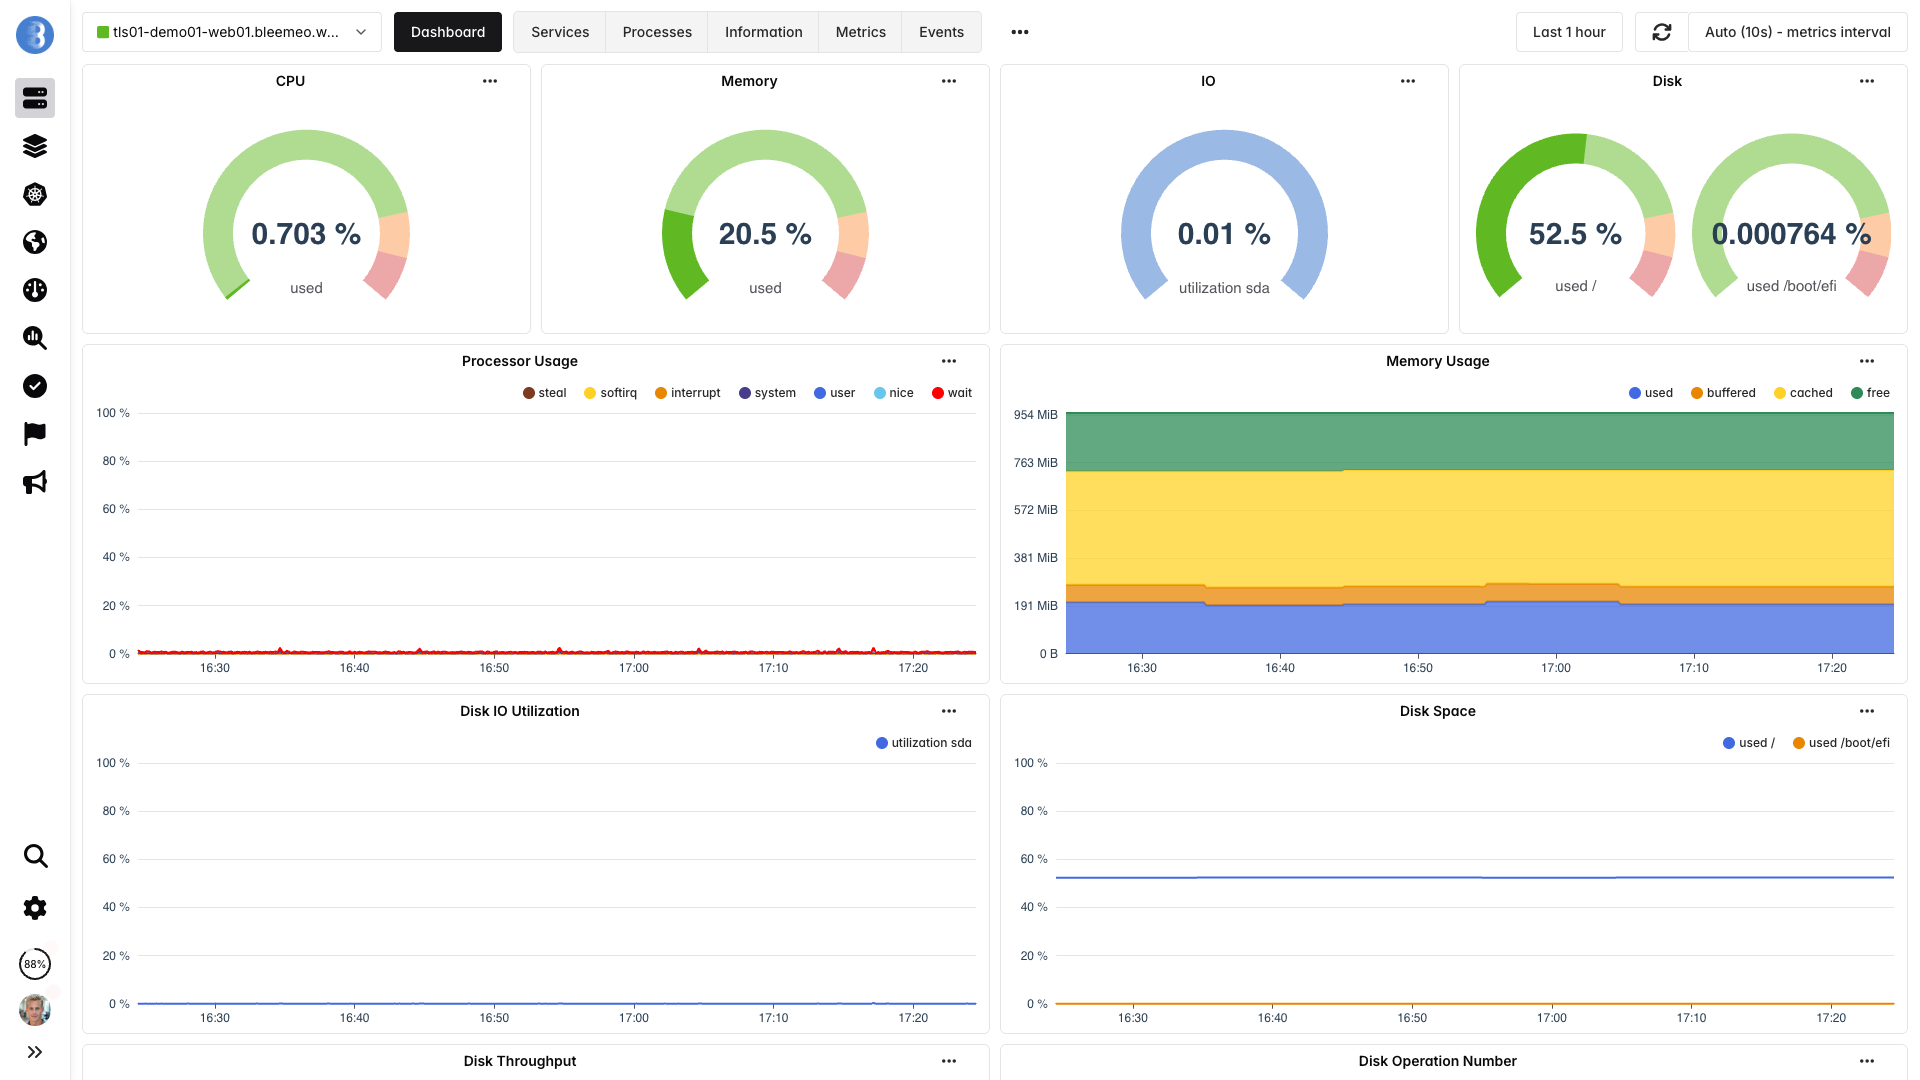
Dashboards & alerts ready
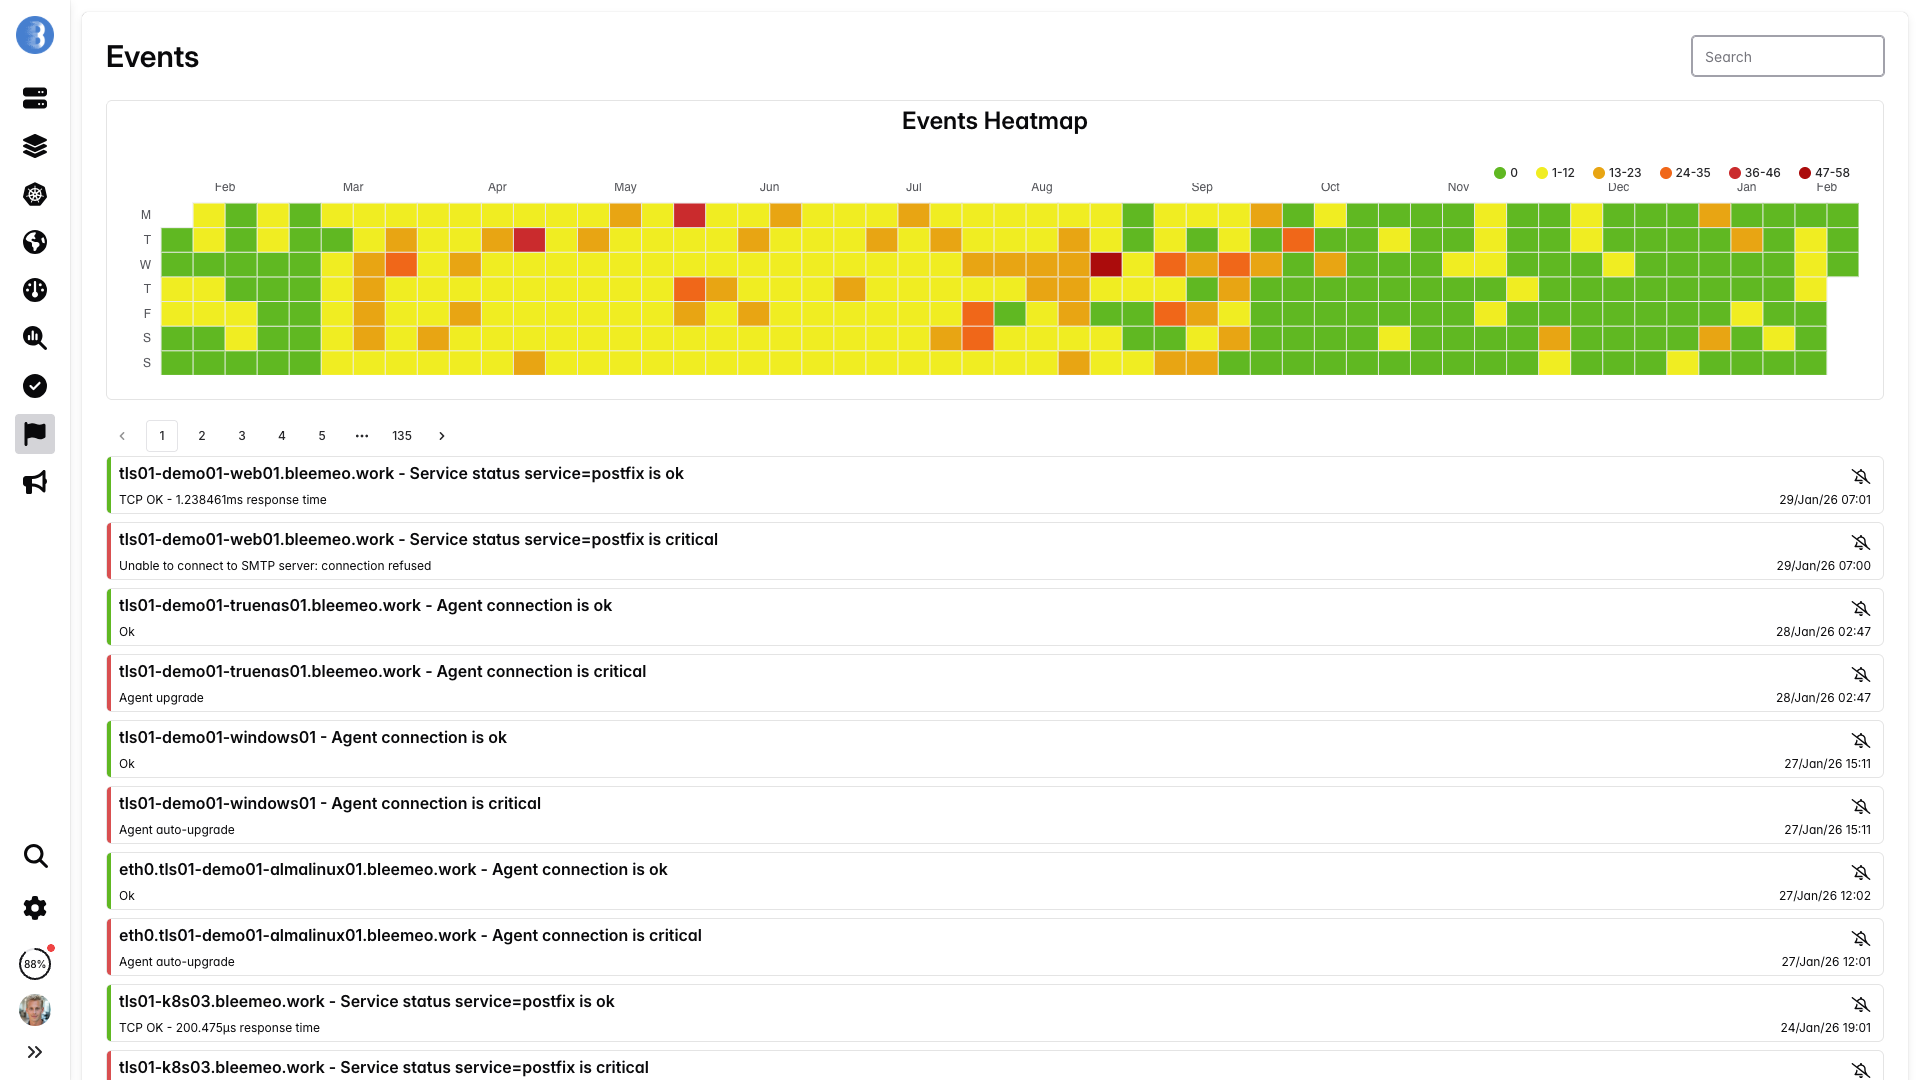
Pre-built dashboards and smart alert rules activate automatically for every discovered service. You get production-ready monitoring from minute one — with zero manual setup. Dashboards update in real time with 10-second resolution, and alerts are sent via email, Slack, PagerDuty, webhooks, or mobile push notifications. ML-based anomaly detection adds context on top, flagging unusual behaviour that static thresholds would miss — it informs, it never pages.
Learn about alertingEverything you expect from monitoring — included
The basics a monitoring tool has to get right, all in one place, with nothing to install on our side.
Collect
- Linux and Windows servers
- Docker and Kubernetes
- SNMP network devices
- VMware vSphere, AWS and Azure
- 100+ integrations, Prometheus exporters, OTLP
- Custom checks, including Nagios plugins
See
- Real-time dashboards and templates
- 13-month retention (Professional)
- Log search
- Uptime checks from 7 locations, SSL and domain expiry
- Public status pages
Alert
- Default thresholds out of the box
- PromQL alert rules
- Slack, Teams, PagerDuty, Opsgenie, ilert, email, SMS, webhooks
- On-call schedules and escalation
- Silences for maintenance windows
- iOS and Android apps
Operate
- Users, roles and 2FA
- Audit log
- REST API
- MCP server
- Weekly report














Trusted by teams worldwide
Engineers and CTOs trust Bleemeo to monitor their infrastructure
We need our teams focused on our core business — digital signage — rather than on infrastructure monitoring. Bleemeo monitors our entire environment, from bare metal to Azure, and frees our teams from useless alerts while guaranteeing our quality of service.

Bleemeo has supported us for years: simple, reliable monitoring that is essential to the quality of service we owe our customers.

On-premise or in the cloud, Bleemeo monitors my clients' Kubernetes clusters without any complexity. A tool I recommend for its simplicity and the clarity it brings.

Customer since day one, I'm thrilled with Bleemeo. It's easy to install, efficient, and just keeps getting better!

During a short lunch break we installed Bleemeo, created a custom metric, tested alerts, and were ready for production. The speed of deployment is remarkable.

Bleemeo support is simply legendary — fast, knowledgeable, and always there when we need it.

Bleemeo was incredibly fast to deploy. In about an hour we rolled it out across more than 100 servers and immediately gained full visibility into our infrastructure.

We set up monitoring for all our servers in just a few hours. The dashboard is clear, powerful, and genuinely enjoyable to use.

We deployed Bleemeo across our server infrastructure in only a few hours. Uptime monitoring now alerts us instantly whenever a service encounters an issue.

Comparison
What you won't need anymore
Bleemeo replaces complexity with simplicity
| Task | Before Bleemeo | With Bleemeo |
|---|---|---|
| Initial setup | Hours of configuration files | One command, zero config |
| Service discovery | Manual per-service configuration | Automatic detection |
| Dashboard creation | Build dashboards from scratch | Pre-built for every service |
| Alert rules | Write and tune rules manually | Smart defaults + ML anomaly detection |
| Infrastructure management | Maintain servers, storage, databases | Fully managed SaaS |
| Scaling | Capacity planning and migration | Scales automatically |
Pricing
Pay as you grow
Transparent, per-server pricing with no hidden fees and no long-term contracts
Free forever tier
Monitor up to 3 servers at no cost, with no time limit. Upgrade only when your infrastructure grows beyond that.
Per-server pricing
You pay per monitored server, per month. Every plan includes dashboards, alerts, service discovery, and data retention — no add-on fees for core features.
No surprise bills
No charge per user, per dashboard, per alert or per query. Each Professional server includes 1,000 metrics and 20 containers; logs are pay-as-you-go per GiB, so your bill tracks your infrastructure and stays easy to forecast.
Frequently asked questions
How long does it take to set up Bleemeo?
Most teams go from zero to full monitoring in under 5 minutes. Creating an account takes 30 seconds, installing the agent takes a single command, and dashboards and alerts activate automatically as soon as services are discovered.
Do I need to write configuration files?
No. Bleemeo's agent (Glouton) uses automatic service discovery to detect what's running on your infrastructure. It comes with sensible defaults for all supported services — no YAML, no config files, no query language to learn.
What services does Bleemeo automatically detect?
Glouton automatically detects and monitors databases (MySQL, PostgreSQL, Redis, MongoDB, Elasticsearch), web servers (Apache, Nginx), message brokers (RabbitMQ, Kafka), container runtimes (Docker, containerd), Kubernetes clusters, and many more. See the full list on our integrations page.
Is the Bleemeo agent open source?
Yes. Glouton is fully open source under the Apache 2.0 license. You can inspect the code, contribute, and run it alongside the Bleemeo platform or independently with Prometheus-compatible backends.
How does Bleemeo pricing work?
Bleemeo uses simple per-server, per-month pricing. A free tier lets you monitor up to 3 servers forever. Paid plans include all core features — dashboards, alerts, service discovery, and data retention — with no per-metric or per-user charges. You only pay for what you use, and your bill scales linearly with your infrastructure. See full pricing details.
What happens when I add new servers or services?
Just install the agent on the new server — everything else is automatic. Glouton discovers running services, starts collecting metrics, and activates the matching dashboards and alert rules. If you add a new service to an existing server (for example, spinning up a Redis instance), Glouton detects it within seconds and begins monitoring without any action on your part.
Ready to see it in action?
Start monitoring your infrastructure in under 5 minutes. No credit card, no configuration, no commitment.
15-day free trial · No credit card required · Cancel anytime