

Built on Prometheus & OpenTelemetry
No vendor lock-in
Send metrics in 30 seconds, query with full PromQL
Bleemeo is a hosted Prometheus monitoring software — a managed Prometheus cloud with full PromQL compatibility, 13 months of retention, and a 99.99% SLA. No Thanos to operate, no Cortex to maintain, no Mimir to scale. Use the Prometheus tool you already know, without running the storage, the scaling, or the alerting infrastructure yourself.
15-day free trialNo credit card requiredNo long-term commitment
No vendor lock-in
Data stays in EU · GDPR compliant
Across Europe and beyond
Trusted by 500+ companies to monitor their infrastructure
The challenge
Local disk fills up fast with high-cardinality metrics. External solutions like Thanos, Cortex, or Mimir add significant operational complexity and require dedicated engineering time.
As your infrastructure grows, single Prometheus instances hit memory and CPU limits. Federation distributes load but introduces query fragmentation and data gaps.
Running two identical Prometheus servers wastes resources and still requires external deduplication. Alertmanager clustering adds another layer of infrastructure to manage.
Prometheus needs regular updates, storage management, backup procedures, and capacity planning. Many teams spend 20-40 hours per month on Prometheus operations alone.
Why Bleemeo
A managed Prometheus cloud with the numbers that matter — your existing PromQL queries, dashboards and alert rules work unchanged.
Point Glouton at your /metrics endpoints, or push via OTLP — done.
No Prometheus servers to provision, no Thanos cluster to deploy, no Alertmanager to configure.
Auto-discovery picks up 100+ services out of the box.
Full-resolution metrics kept for 13 months — no downsampling, no data gaps, no Thanos or Cortex to operate. Capacity planning, post-mortems, year-over-year comparisons all stay accessible without a separate long-term storage tier.
Multi-zone redundancy with automatic failover and a 99.99% uptime SLA. When your cluster degrades or your application crashes, the platform keeps ingesting and alerting from outside your infrastructure — so the critical signal you need actually reaches you.
Self-hosted Prometheus eats 20-40 engineer-hours per month: storage growth, version upgrades, scrape-config drift, alert-rule tuning, Alertmanager clustering. Bleemeo gives that time back to your platform and product work.
What's included
Here's what ships with Bleemeo's managed Prometheus service — no sharding, no federation, no storage management. Whether you run a handful of microservices or thousands of containers across multiple clusters, the platform scales with you.
Point your Glouton agent at Prometheus endpoints or send metrics via OTLP (OpenTelemetry Protocol). No need to provision storage, configure retention policies, or set up replication. Metrics flow to the cloud within seconds of configuration.
Handle millions of time series without manual sharding or federation. Our multi-tenant architecture distributes load automatically and scales horizontally as your metrics volume grows.
Multi-zone redundancy with automatic failover ensures 99.99% uptime SLA. Every data point is replicated across multiple availability zones for durability and fast query performance. No need to run duplicate Prometheus instances or manage complex replication setups.
13 months of full-resolution metric data by default. No downsampling, no data gaps, no need for external storage solutions like Thanos or Cortex.
Define alerts using familiar PromQL expressions. Built-in notification channels (email, SMS, Slack, PagerDuty, webhooks) replace the need for separate Alertmanager infrastructure.
Pre-built dashboards auto-populate when services are detected. Create custom dashboards with PromQL queries or connect your existing Grafana installation via our Prometheus-compatible API endpoint.
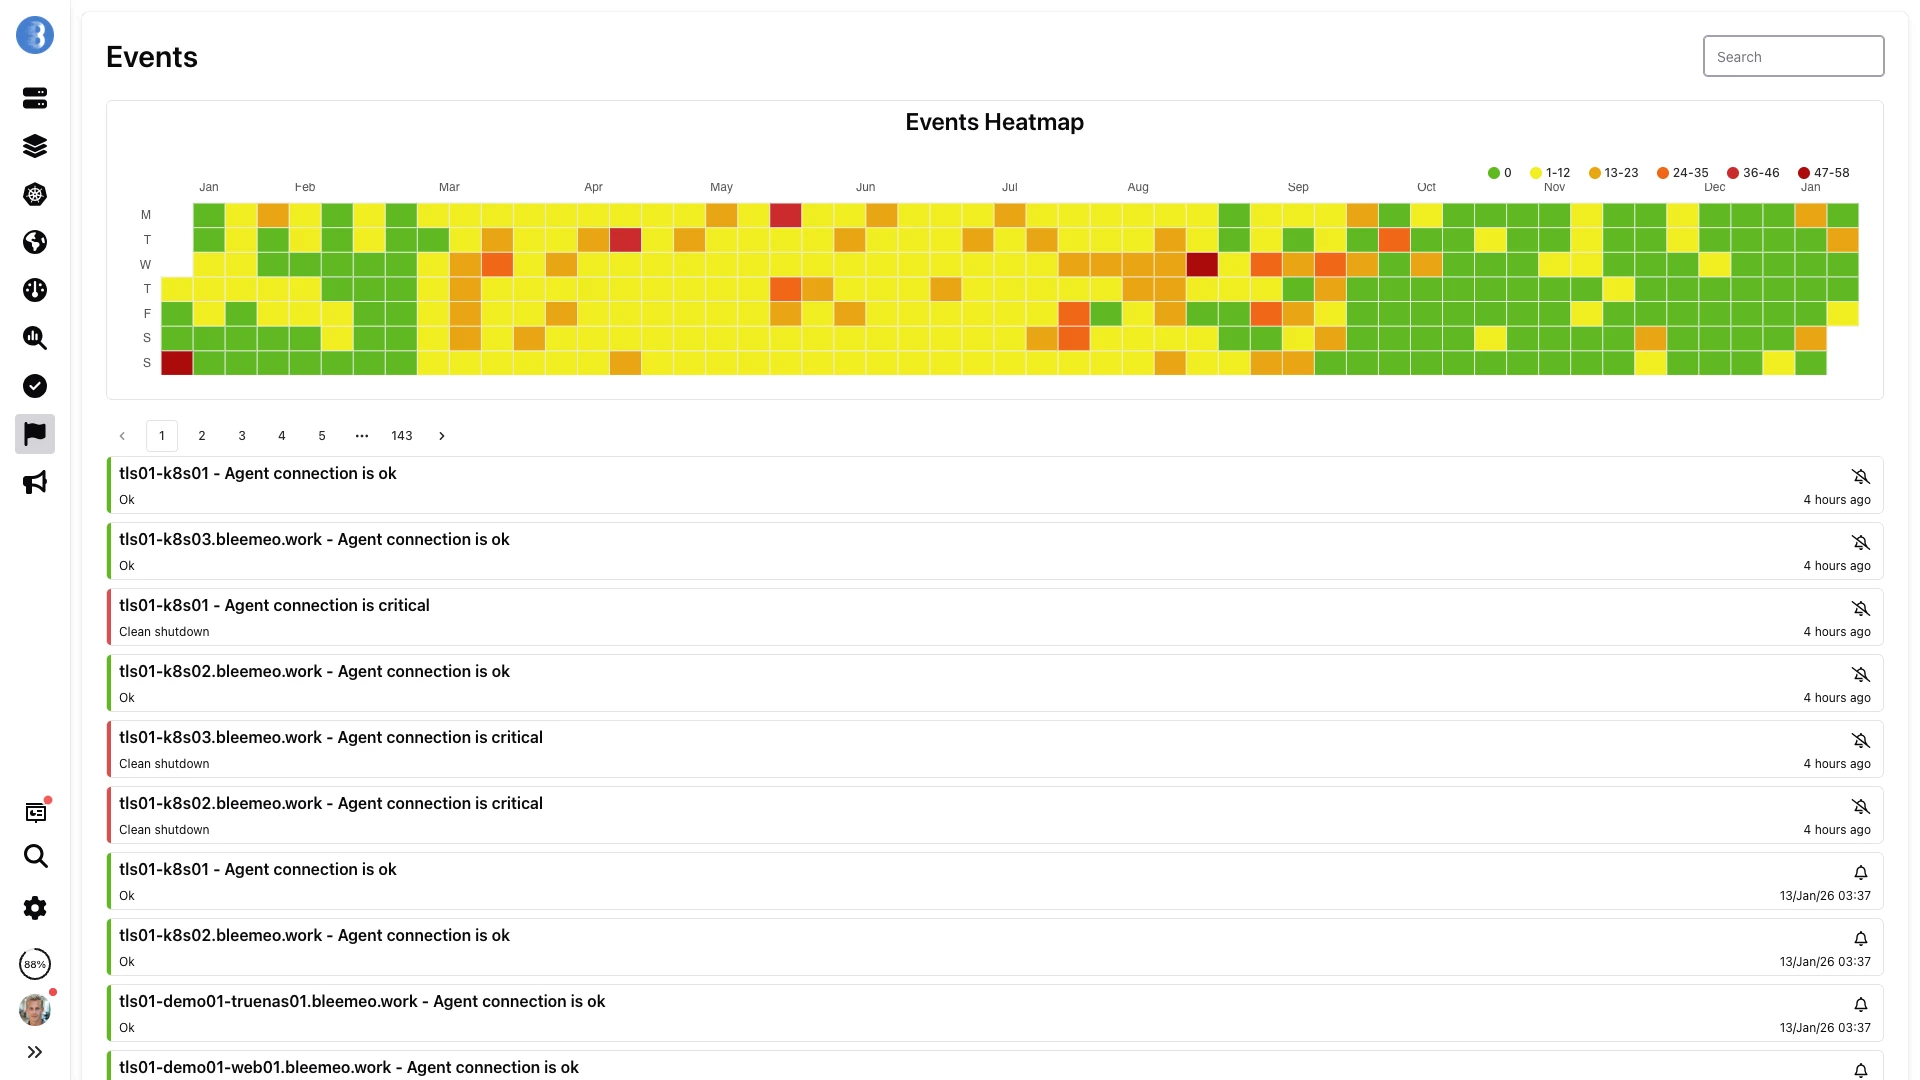
Visibility
Every triggered alert and state change is kept for the full 13 months retention window. Spot recurring incidents on the heatmap and drill down to the exact event.
Alerting
Define a recording rule with a raw PromQL query, attach Low/High Warning and Critical thresholds, and Bleemeo turns it into a live alert — no Alertmanager cluster, no YAML drift.

Comparison
| Feature | Self-Hosted | Bleemeo Prometheus |
|---|---|---|
| Setup Time | Days to weeks | Minutes |
| Scaling | Manual configuration | Automatic |
| High Availability | Complex setup required | Built-in |
| Long-Term Storage | Requires external solution | Included |
| Maintenance | 20-40 hours/month | Zero |
| Total Monthly Cost | $5,000-10,000 | $500-3,000 |
| Data Retention | 15 days (default) | 13 months |
On-premise or in the cloud, Bleemeo monitors my clients' Kubernetes clusters without any complexity. A tool I recommend for its simplicity and the clarity it brings.

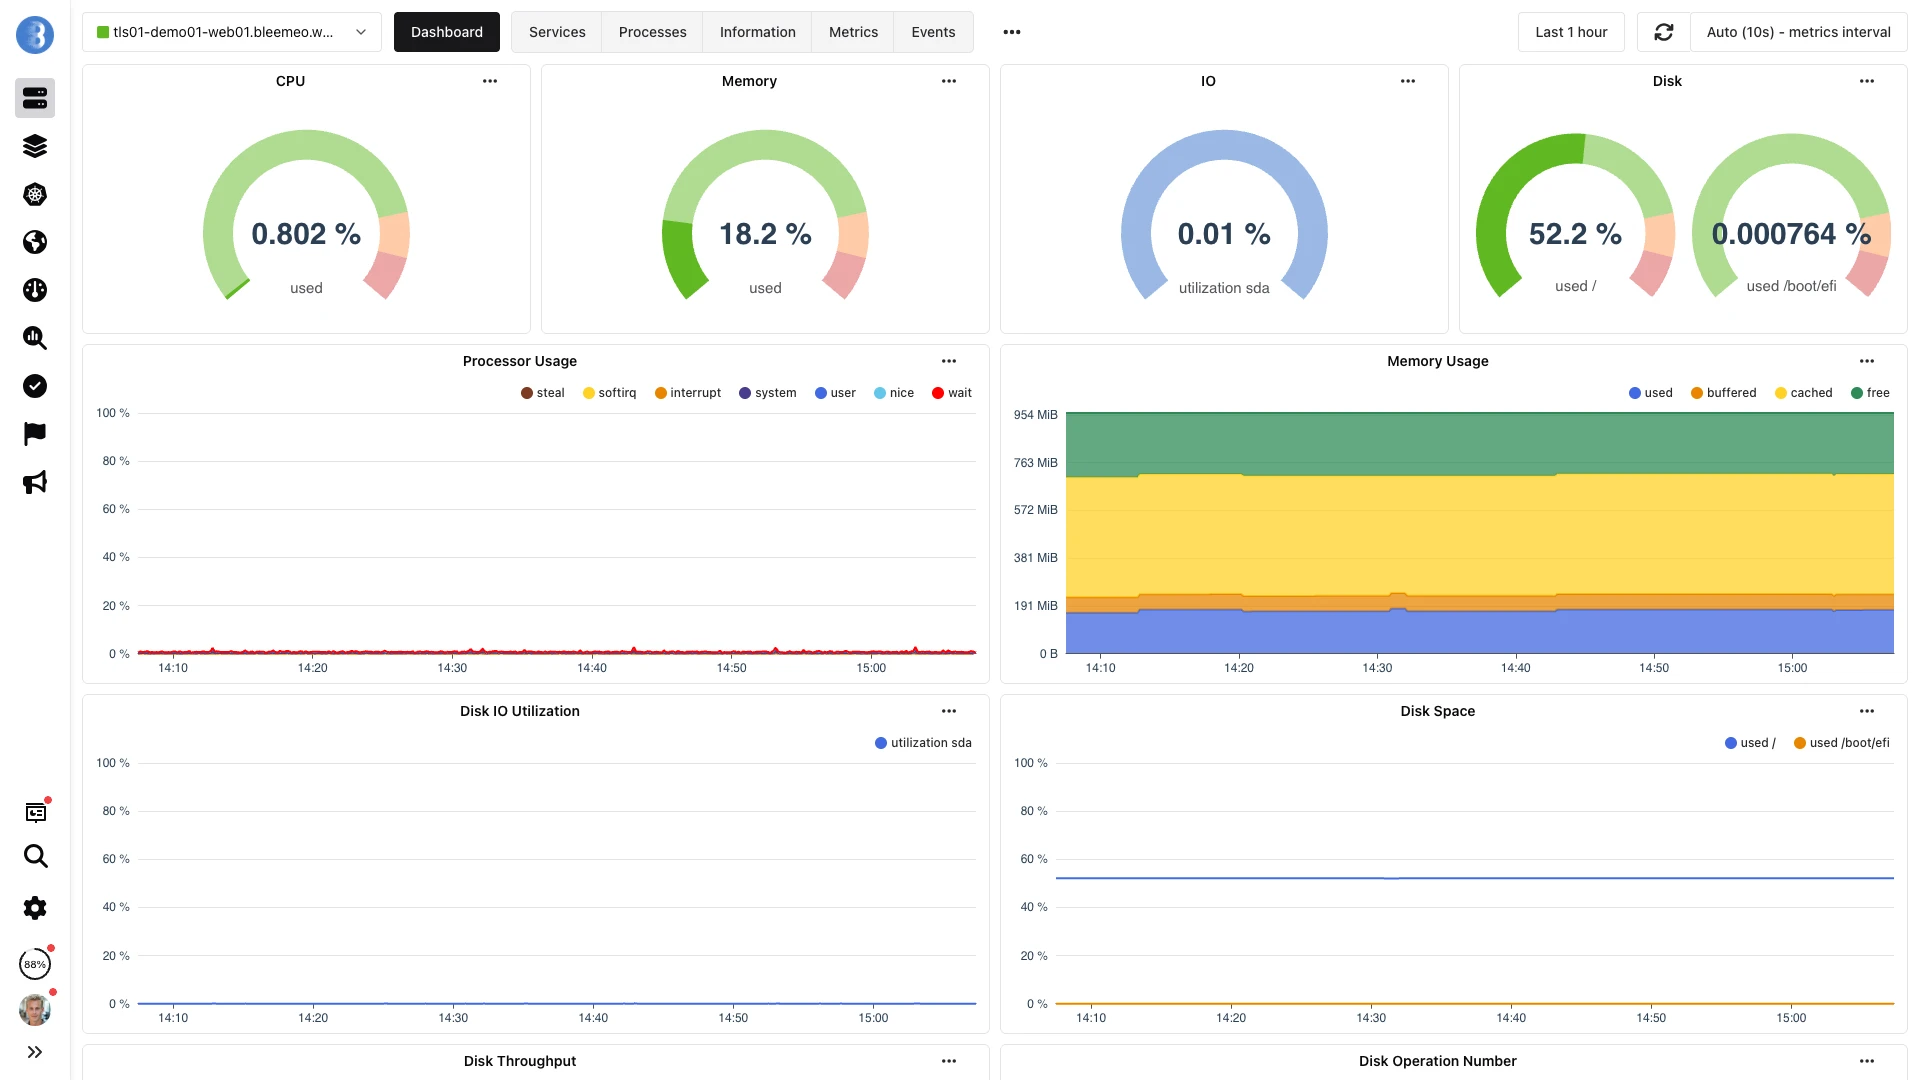
In action
/metrics to dashboardGlouton scrapes your Prometheus endpoints and Bleemeo's PromQL dashboards fill in — captured below.

From scrape to dashboard — under a minute, no configuration.
Architecture
Run your own metrics through this flow — same 30 seconds, same managed Prometheus cloud.
Getting started
Add metric targets to your Glouton configuration. Glouton scrapes your Prometheus endpoints and forwards metrics to Bleemeo. You can also send metrics via OTLP (OpenTelemetry Protocol) for teams already using OpenTelemetry instrumentation.
metric:
  prometheus:
    targets:
- url: http://localhost:9090/metricsYour metrics automatically flow to Bleemeo. Our platform performs automatic service discovery and populates pre-built dashboards for detected services such as PostgreSQL, Redis, NGINX, and many more. Access your data through the Bleemeo dashboard or connect your existing Grafana installation using our Prometheus-compatible API endpoint as a data source.
Configure alerts using our intuitive interface or import existing Prometheus alert rules. Define PromQL-based alert rules for precise conditions, create recording rules for derived metrics and frequently used aggregations, and choose from 15+ notification channel integrations including email, SMS, Slack, PagerDuty, Microsoft Teams, and webhooks.
Migration
No big-bang switch. Three incremental steps run in parallel with your existing stack.
Deploy the Glouton agent to scrape the same Prometheus endpoints your existing server monitors, while keeping your local storage active. Validate that every metric appears correctly in Bleemeo before decommissioning anything.
Bleemeo exposes a Prometheus-compatible API that works as a standard Grafana data source. Add Bleemeo as a second data source, compare dashboards side by side, then flip the default — panel layouts and variable templates stay the same.
Bleemeo's built-in alerting replaces Alertmanager entirely. Your existing PromQL alert expressions work without modification; configure email, SMS, Slack, PagerDuty or webhook channels in-platform and retire the Alertmanager cluster.
Use cases
Monitor Kubernetes clusters, microservices, and containers with automatic service discovery. Glouton deploys as a DaemonSet and automatically detects all running services on each node.
Start with 5 servers and scale to 5,000 without re-architecting. No capacity planning, no storage management, no federation complexity. Pay only for what you use.
Meet SOC 2 requirements with encrypted data in European data centers. 13-month retention satisfies most compliance frameworks without additional storage infrastructure. Role-based access control and SSO integration ensure only authorized team members access your metrics.
Eliminate 20-40 hours/month of Prometheus operations. Focus engineering time on feature development instead of managing monitoring infrastructure. No more upgrading Prometheus versions, resizing storage volumes, or debugging query timeouts — let Bleemeo handle it all.
Resources
A primer on Prometheus metrics, PromQL, naming conventions, and cardinality — useful background while you evaluate Bleemeo's hosted Prometheus.
Prometheus identifies each metric by a name plus a set of key-value labels. The data model makes it easy
to slice, filter, and aggregate across any dimension. For example, http_requests_total{method="GET", endpoint="/api/users", status="200"} captures GET requests to /api/users returning a 200
— and the same metric supports queries by method, endpoint, status code, or any combination, without
duplicating the definition.
Prometheus defines four core metric types. A Counter is a monotonically increasing value — request counts, bytes transferred. A Gauge goes up or down — CPU usage, active connections. A Histogram buckets observations for latency or size distributions. A Summary computes streaming quantiles (p95, p99) for real-time SLA tracking. Picking the right type per measurement is what keeps dashboards and alerts accurate.
Metric names should be lowercase with underscores and end on a unit suffix like _seconds,
_bytes, or _total (for counters). For instance, http_request_duration_seconds
tells you instantly what is being measured. Bleemeo preserves these conventions and accepts standard
Prometheus metric names as-is — migrating existing metrics requires no renaming.
PromQL (Prometheus Query Language) slices and aggregates time-series data in real time — rates, averages, percentiles, complex aggregations across thousands of series in a single expression. Bleemeo fully supports PromQL for dashboards, alert rules, recording rules, and ad-hoc queries, so your existing dashboard and alert definitions migrate without modification.
Cardinality is the number of unique label-value combinations per metric. High cardinality — user IDs, session tokens, unique request IDs in labels — makes Prometheus consume excessive memory and degrades query performance. As a best practice, keep cardinality to hundreds or at most a few thousand values per metric. Bleemeo's managed architecture handles higher cardinality more gracefully than self-hosted Prometheus, but following these best practices keeps queries fast and costs predictable.
Want to go further? Learn how to configure Prometheus scraping, write PromQL queries, and connect Grafana to your Bleemeo metrics.
Read the DocumentationEverything you need to know about Bleemeo's managed Prometheus service
You can send metrics to Bleemeo in two ways: the Glouton agent can scrape Prometheus endpoints locally and forward metrics to the cloud, or you can send metrics via OTLP (OpenTelemetry Protocol). Glouton is the recommended approach as it adds infrastructure context and requires minimal configuration.
Yes, Bleemeo fully supports PromQL (Prometheus Query Language). You can use PromQL for custom dashboard widgets, alert conditions, and ad-hoc queries. This means you can migrate existing Prometheus dashboards and alert rules with minimal changes. Our documentation provides examples and best practices for PromQL usage in Bleemeo.
Yes, Bleemeo provides a Prometheus-compatible API endpoint that works as a Grafana data source. You can connect your existing Grafana installation to Bleemeo and use your existing dashboards. This allows teams to continue using familiar tooling while benefiting from Bleemeo's managed storage and scalability.
Bleemeo retains metrics for 13 months by default, compared to Prometheus's typical 15-day local retention. This long-term storage enables year-over-year comparisons, capacity planning, and compliance requirements. All retention is automatic - no need to configure external storage solutions like Thanos or Cortex.
Self-hosted Prometheus at scale typically costs $5,000-10,000/month including infrastructure, storage solutions, and 20-40 hours of engineering time. Bleemeo's managed service costs $500-3,000/month with zero operational overhead. Use our calculator to compare costs for your specific use case. The savings increase with scale due to our efficient multi-tenant architecture.
No. Bleemeo is the managed Prometheus cloud that replaces Thanos, Cortex, and Mimir entirely. Long-term storage, horizontal scaling, deduplication and cross-cluster query are all built into the platform. You point Glouton (or OTLP) at your /metrics endpoints and stop running storage backends, queriers, compactors, or store gateways. Retention is 13 months out of the box with a 99.99% SLA.
Bleemeo provides built-in high availability with multi-zone redundancy and automatic failover. We achieve 99.99% uptime SLA. This is included in the standard service - no need to configure multiple Prometheus instances, set up replication, or manage failover manually. Your metrics are always available when you need them.
Yes, migration is straightforward. You can run Bleemeo alongside your existing Prometheus during transition. Deploy the Glouton agent to scrape the same Prometheus endpoints, validate data in Bleemeo, then decommission your self-hosted setup. Alert rules can be migrated using PromQL compatibility. We provide migration guides and support for enterprise customers.
Bleemeo's architecture handles millions of time series without manual intervention. As your metrics volume grows, our infrastructure scales automatically. You don't need to resize instances, configure sharding, or set up federation. This is handled transparently - you simply send metrics and we ensure they're stored and queryable regardless of volume.
Bleemeo includes a full alerting system compatible with Prometheus alerting rules. You can define alerts using PromQL conditions, configure multiple notification channels (email, SMS, Slack, PagerDuty, webhooks), set up escalation policies, and use features like grouping and maintenance windows. This replaces the need for separate Alertmanager infrastructure.
Yes, security is a priority. All data is encrypted in transit (TLS) and at rest. Bleemeo is hosted in European data centers with SOC 2 compliance. Each customer's data is isolated. We support SSO integration and role-based access control. See our security page for detailed information about our security practices and certifications.
About 30 seconds of actual configuration. Point the Glouton agent at your existing /metrics endpoints (or push via OTLP), provide your account credentials, and metrics start landing in Bleemeo within seconds. Auto-discovery picks up 100+ services without manual configuration; pre-built dashboards and PromQL alerting work out of the box. No Prometheus servers to provision, no storage to size, no Alertmanager to cluster.