

Built on Prometheus & OpenTelemetry
No vendor lock-in
Looking for a CheckMK alternative that eliminates manual setup? Checkmk inherits Nagios-era complexity — manual host registration, check plugin configuration, and a steep WATO learning curve. Bleemeo is a modern CheckMK replacement, cloud-native from day one: one agent, automatic discovery, instant dashboards, and zero servers to manage.
15-day free trialNo credit card requiredNo long-term commitment
No vendor lock-in
Data stays in EU · GDPR compliant
Across Europe and beyond
Trusted by 500+ teams replacing Checkmk's licence-heavy stack
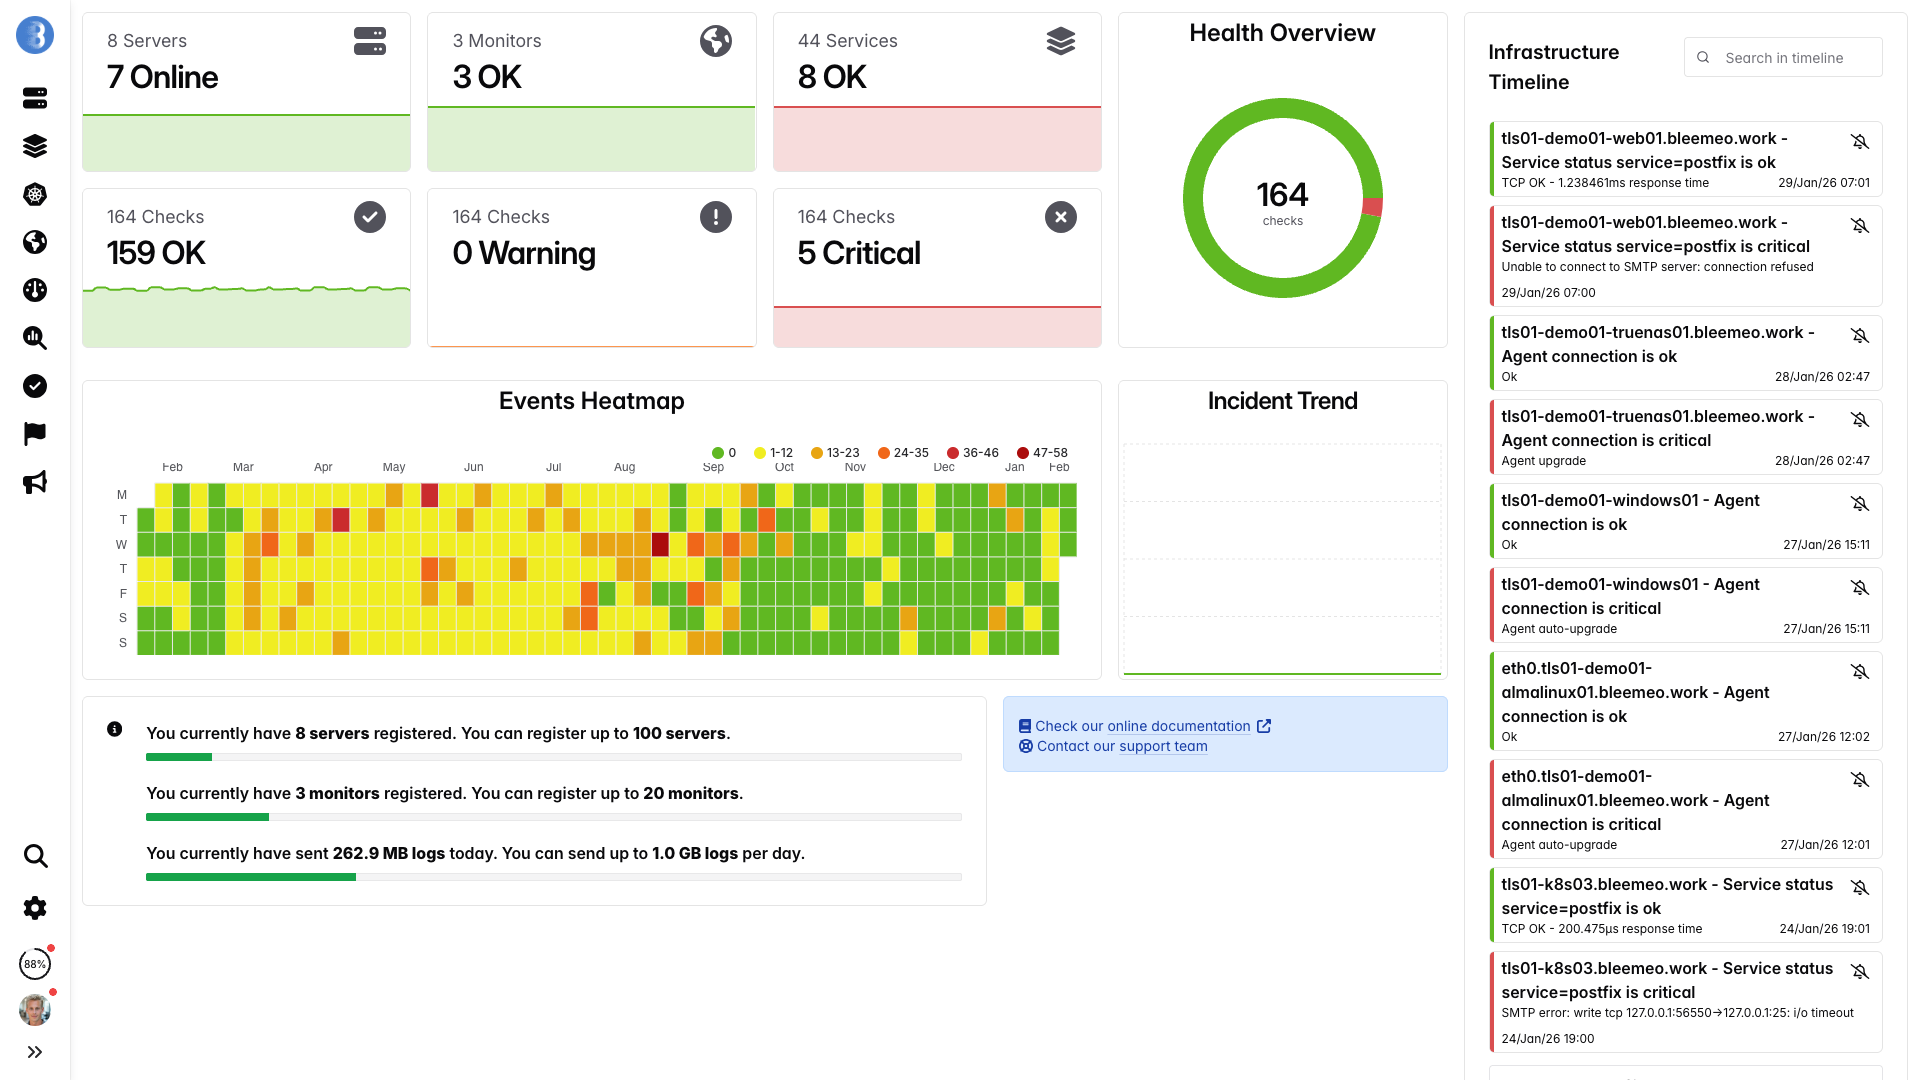
Real-time dashboards, ready in minutes — no configuration needed
From sign-up to dashboard in 30 seconds — no WATO, no rule trees
One command, no configuration — metrics flowing in under a minute.
Why switch
Checkmk requires every host to be registered explicitly, organized into folders, and assigned the correct check plugins. Automation rules can help, but writing and maintaining those rules demands deep knowledge of the Checkmk rule engine. Teams spend significant time configuring service discovery rules rather than actually monitoring their infrastructure.
Running Checkmk means provisioning and maintaining a dedicated monitoring server — handling OS updates, disk space management, database backups, and performance tuning. As your infrastructure grows, you also need to plan for distributed monitoring with remote sites, adding even more servers to maintain. Every version upgrade requires careful planning and testing to avoid downtime in your monitoring stack itself.
Built on Nagios foundations, Checkmk inherits a check-interval polling model that struggles with the ephemeral nature of containers and Kubernetes pods. Native container and cloud-native support is limited, often requiring third-party plugins or custom local checks. Modern infrastructure demands real-time streaming metrics, not periodic poll cycles designed for static server fleets.
With hundreds of check plugins available, teams must research, select, and configure the right ones for each host and service. The Agent Bakery simplifies agent deployment but introduces its own configuration layer with baking rules and plugin assignments. Additionally, features like Business Intelligence modules, advanced reporting, and the notification rules system are restricted to the Enterprise edition, creating confusion about what is available in each tier.
We deployed Bleemeo across our server infrastructure in only a few hours. Uptime monitoring now alerts us instantly whenever a service encounters an issue.

Head to head
| Feature | Checkmk | Bleemeo |
|---|---|---|
| Setup Approach | Install server, register hosts into folders, select and configure check plugins per host | One-line agent install with automatic discovery of all services |
| Infrastructure | Self-hosted monitoring server required, with distributed sites for scale | Fully managed SaaS — no servers to provision or maintain |
| Service Discovery | Rule-based discovery requiring manual activation and review per host | Fully automatic, discovers 100+ service types with zero configuration |
| Container/K8s Support | Limited plugin-based support, not designed for ephemeral workloads | Native first-class Kubernetes and Docker monitoring built from day one |
| Dashboards | Built-in views require manual configuration and custom graph creation | Pre-built dashboards auto-activate for every discovered service |
| Alert Configuration | Complex notification rules system with manual thresholds per check | Smart defaults with ML-based anomaly detection, ready out of the box |
| Long-term Storage | Self-managed RRD storage with limited retention and resolution loss over time | 13 months of data at full resolution, fully managed in the cloud |
| Maintenance | Regular server updates, backups, scaling, and version upgrade planning | Zero maintenance — platform is fully managed and always up to date |
| Learning Curve | Steep — WATO/Setup UI is powerful but requires significant training | Intuitive web interface, productive within minutes of first login |
| Pricing Model | Raw (free) vs Enterprise vs Cloud editions create feature confusion | Single plan with all features included, transparent per-agent pricing |
| Cloud-Native Support | Growing through add-ons and special agents, but not core architecture | Built into the core platform from day one |
| API & Integrations | REST API and Livestatus query language | REST API + scrapes Prometheus exporters natively |
Cost
For a typical 100-host infrastructure — including hidden operational costs most teams overlook
*With 1-year reservation. No server to maintain. No hidden costs. All features included.
The numbers above assume a 100-host setup. Plug in your own host count and add-ons to estimate how much you'd save by switching from Checkmk to Bleemeo.
Advantages
No hosts to register into folders, no check plugins to select and configure, no discovery rules to write. Install the Bleemeo agent and monitoring starts automatically within seconds. Unlike Checkmk's manual workflow, you skip the entire WATO/Setup configuration process entirely.
Built for containers, Kubernetes, and modern ephemeral infrastructure from day one — not bolted on through special agents and plugins. Bleemeo natively understands pod lifecycles, container orchestration, and dynamic scaling without the check-interval limitations inherited from Nagios-era designs.
Fully managed SaaS means no monitoring server to provision, update, backup, or scale. Eliminate the overhead of managing Checkmk sites, distributed monitoring setups, and the version upgrade planning that comes with every on-premise installation.
Pre-built dashboards activate automatically for every auto-discovered service, giving you immediate visibility without manual graph creation. Compare that to Checkmk where custom views and dashboard elements need to be configured individually for each host and service group.
Glouton, our monitoring agent, is Apache 2.0 licensed and fully open source. You get complete transparency into what data is collected and how, with no vendor lock-in. Audit the code, contribute improvements, or fork it — the choice is yours.
All monitoring data stays in Europe with full GDPR compliance built into the platform. For organizations with strict data sovereignty requirements, Bleemeo provides the regulatory certainty that self-hosted Checkmk offers but without the operational burden of running it yourself.
Features
Comprehensive CPU, memory, disk, and network metrics with automatic service discovery for over 100 service types. Unlike Checkmk where you select check plugins per host, Bleemeo detects and monitors everything running on your servers without any configuration.
Native monitoring for Docker containers and Kubernetes clusters, including pods, deployments, services, and node-level metrics. Ephemeral containers are tracked seamlessly as they scale up and down — no manual host registration required for each new pod.
Centralized log collection, indexing, and full-text search built into the platform. No separate log server or additional Checkmk Enterprise module needed. Correlate logs with metrics on the same timeline for faster root-cause analysis.
Machine-learning-based anomaly detection with intelligent pre-configured thresholds that adapt to your infrastructure patterns. Multi-channel notifications via email, Slack, PagerDuty, and webhooks — without the complex notification rule chains that Checkmk requires.
Metrics at 10-second resolution with pre-built dashboards for every discovered service. Includes a custom dashboard builder for tailored views. No manual graph creation or view configuration needed — dashboards appear as soon as services are detected.
HTTP, TCP, and ICMP availability checks from 7 global probe locations, providing external perspective on service health. Monitor websites, APIs, and network endpoints with detailed response time metrics and SSL certificate expiration tracking.
Migration
Most teams run Bleemeo alongside Checkmk for a few weeks before fully switching. The Bleemeo agent runs independently from the Checkmk agent, so there is no conflict during the transition period. Our team is available to help with migration planning and validation at every step.
Install the Bleemeo agent on your servers with a single command. The lightweight agent runs alongside the existing Checkmk agent without interference, so your current monitoring remains fully operational during the migration.
wget -qO- 'https://get.bleemeo.com?accountId=...'Within seconds of installation, Bleemeo automatically discovers all running services on each host. Compare the auto-discovered service list with your Checkmk host and service inventory to confirm full coverage. No check plugins to select or configure — everything is detected out of the box.
Bleemeo pre-builds dashboards for every discovered service, giving you immediate visibility. Compare these auto-generated dashboards with your existing Checkmk views and custom graphs. Most teams find that Bleemeo provides equivalent or better visibility without any manual dashboard configuration.
Set up your preferred notification channels — Slack, PagerDuty, email, or webhooks — in a straightforward interface. Unlike Checkmk's complex notification rules system with its cascading rule evaluation, Bleemeo makes alert routing simple and intuitive to configure in minutes.
Run both monitoring systems side by side for one to two weeks. Compare alert accuracy, metric coverage, and dashboard usefulness between the two platforms. This validation period lets your team build confidence in Bleemeo before making the final switch, with no risk to your existing monitoring.
Once validation is complete, remove the Checkmk agents from your hosts and decommission the Checkmk monitoring server. Reclaim the server infrastructure, storage, and the ongoing administrative time that was spent on updates, backups, and plugin maintenance.
Engineers and CTOs trust Bleemeo to monitor their infrastructure
We need our teams focused on our core business — digital signage — rather than on infrastructure monitoring. Bleemeo monitors our entire environment, from bare metal to Azure, and frees our teams from useless alerts while guaranteeing our quality of service.

Bleemeo has supported us for years: simple, reliable monitoring that is essential to the quality of service we owe our customers.

On-premise or in the cloud, Bleemeo monitors my clients' Kubernetes clusters without any complexity. A tool I recommend for its simplicity and the clarity it brings.

Customer since day one, I'm thrilled with Bleemeo. It's easy to install, efficient, and just keeps getting better!

During a short lunch break we installed Bleemeo, created a custom metric, tested alerts, and were ready for production. The speed of deployment is remarkable.

Bleemeo support is simply legendary — fast, knowledgeable, and always there when we need it.

Bleemeo was incredibly fast to deploy. In about an hour we rolled it out across more than 100 servers and immediately gained full visibility into our infrastructure.

We set up monitoring for all our servers in just a few hours. The dashboard is clear, powerful, and genuinely enjoyable to use.

We deployed Bleemeo across our server infrastructure in only a few hours. Uptime monitoring now alerts us instantly whenever a service encounters an issue.
See it live
Watch how teams go from install to full monitoring in under 5 minutes
Yes. Bleemeo monitors servers, containers, Kubernetes, and 100+ services with automatic discovery. No manual host registration or check plugin configuration needed.
No. Bleemeo is fully managed SaaS. No server to install, patch, backup, or scale — unlike Checkmk which requires dedicated server infrastructure.
Bleemeo's agent (Glouton) automatically detects running services within seconds. No folder organization, host registration, or discovery rules to configure.
Bleemeo includes all features in every plan — dashboards, alerting, ML anomaly detection, log management, mobile apps. No feature gating between editions.
Yes. Native Docker and Kubernetes monitoring with automatic discovery. No special agent or plugin needed — unlike Checkmk where container monitoring requires additional configuration.
Yes. Centralized log collection and search at 0.50€/GiB. No separate tool or add-on needed — logs are built into the platform.
Yes. Monitor up to 3 servers for free with no time limit. All features included — no Raw vs Enterprise edition distinction like Checkmk.
Simple per-agent pricing at 10.99€/month per server. All features included — dashboards, alerting, ML anomaly detection, mobile apps, log management. No per-user fees, no feature tiers.