

Built on Prometheus & OpenTelemetry
No vendor lock-in
Looking for a Datadog alternative that won't blow your budget? Datadog is powerful but expensive — 15+ SKUs, custom metric surcharges, and annual commits make budgeting a nightmare. Bleemeo is a production-ready Datadog replacement that delivers the same visibility with simple per-agent pricing, no surprise bills, and no vendor lock-in.
15-day free trialNo credit card requiredNo long-term commitment
No vendor lock-in
Data stays in EU · GDPR compliant
Across Europe and beyond
Trusted by 500+ companies switching from expensive monitoring tools
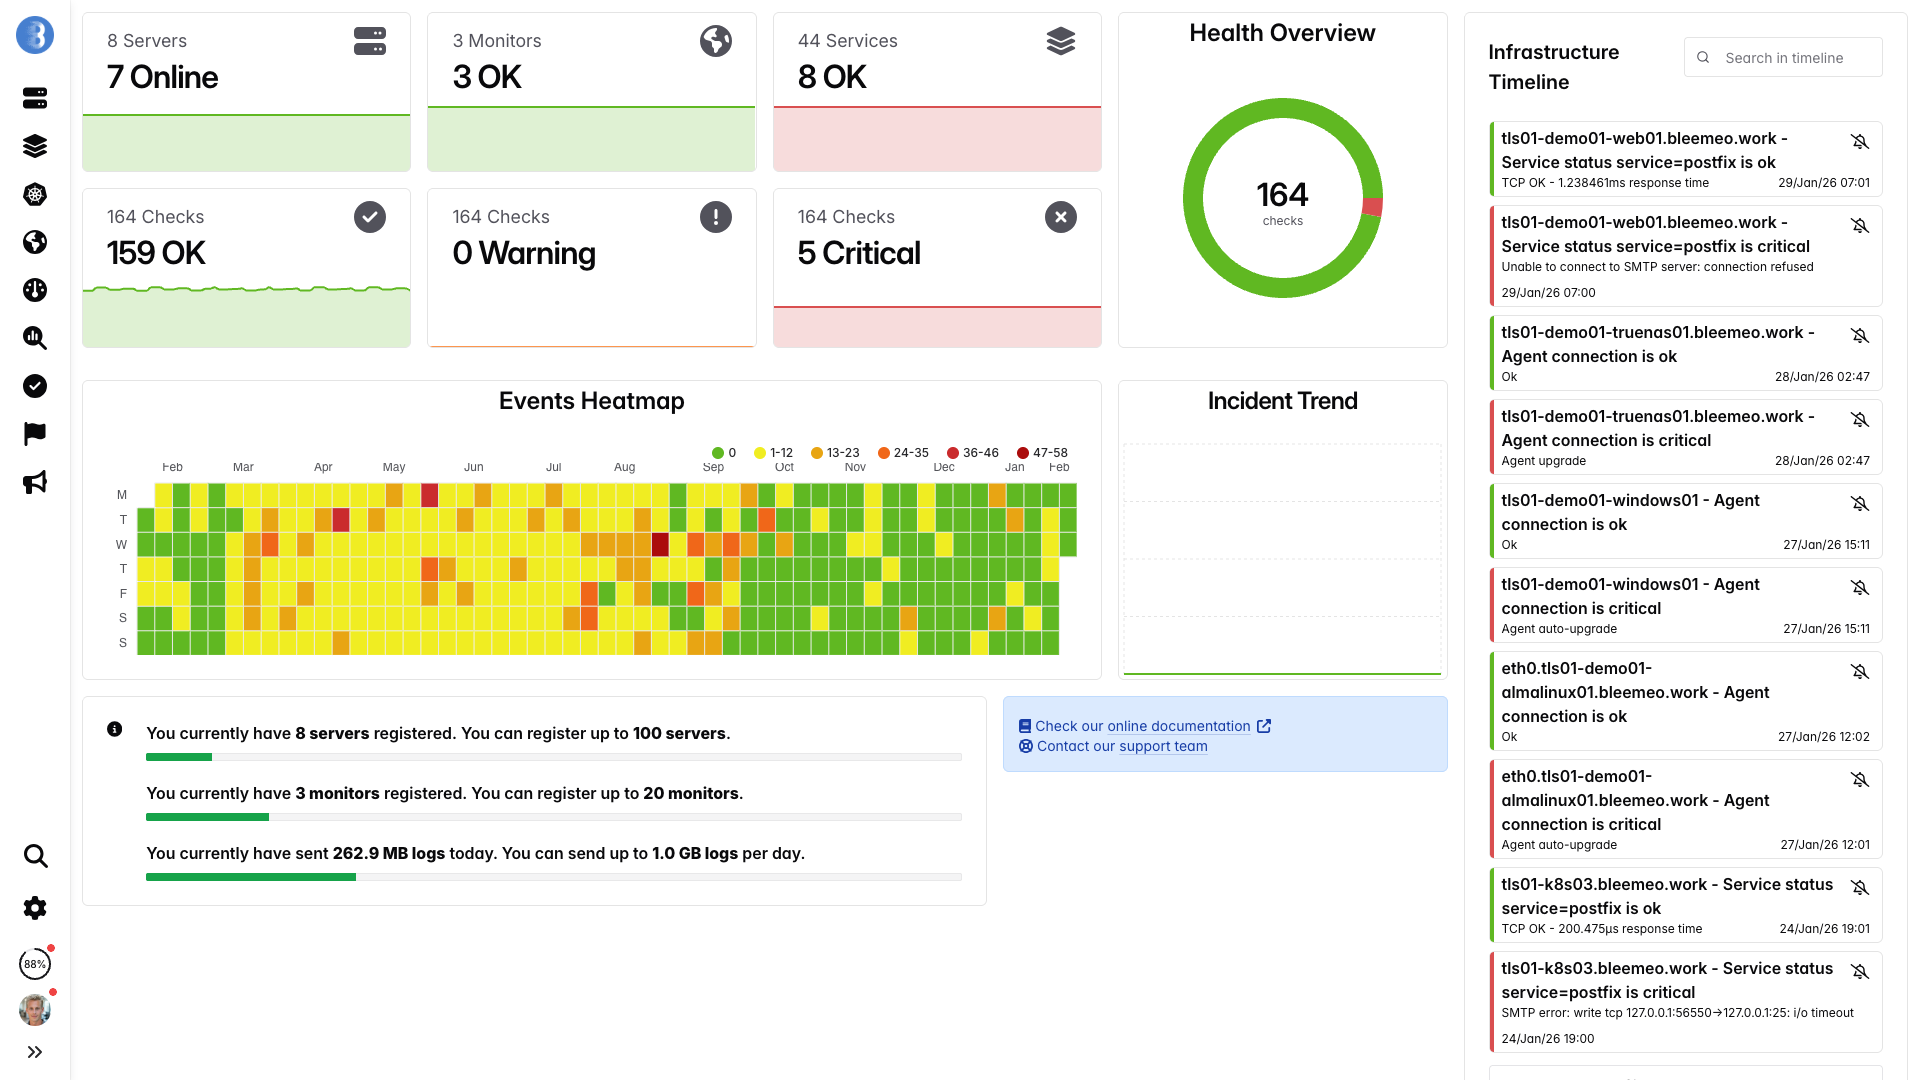
Real-time dashboards, ready in minutes — no configuration needed
From sign-up to dashboard in 30 seconds — see the difference
One command, no configuration — metrics flowing in under a minute.
Why switch
Datadog's per-host pricing is only the starting point. Once you add separate charges for logs, APM, custom metrics, and infrastructure monitoring, your monthly bill becomes nearly impossible to forecast accurately. Many teams report actual costs running 200-300% above initial estimates once production workloads scale, turning what appeared to be a manageable expense into a major line item that surprises both engineering leads and CFOs at quarter-end reviews.
With over 15 distinct product SKUs—infrastructure, APM, logs, RUM, synthetics, CSPM, database monitoring, network monitoring, and more—each carrying its own billing model and pricing tiers, FinOps complexity becomes a full-time job. Engineering teams must carefully track which features they enable, because activating a single new integration can trigger an entirely new billing dimension that was never part of the original budget forecast.
Custom metrics in Datadog are billed per unique metric name, and high-cardinality labels can multiply your metric count exponentially. Teams regularly discover five-figure overage invoices after deploying new application instrumentation or enabling Prometheus exporters that generate hundreds of custom metric series. A single misconfigured exporter can create thousands of unique time series, each billed individually, leading to invoice shock that forces emergency rollbacks.
Datadog uses a proprietary agent, a custom query language, and vendor-specific integrations that create deep dependencies throughout your infrastructure. Annual commit contracts with aggressive renewal terms give Datadog significant leverage when renegotiating pricing, because the cost of migration increases every year you stay. Teams often find themselves accepting double-digit price increases at renewal because the switching cost feels insurmountable after years of investment in Datadog-specific dashboards, monitors, and workflows.
We need our teams focused on our core business — digital signage — rather than on infrastructure monitoring. Bleemeo monitors our entire environment, from bare metal to Azure, and frees our teams from useless alerts while guaranteeing our quality of service.

Head to head
| Feature | Datadog | Bleemeo |
|---|---|---|
| Pricing Model | Per-host base price plus separate add-ons for each product, with overage charges when usage exceeds committed volumes | Single per-agent price that includes all core monitoring features with no hidden add-ons or overage fees |
| Custom Metrics | Billed per unique metric name with strict limits; overages can reach five figures | Included in base price with generous limits and no per-metric surcharges |
| Log Management | Separate SKU with per-GB ingestion pricing plus additional indexing and retention fees | Simple pricing: 0.50€/GiB ingested |
| Contract Terms | Annual commit contracts with usage limits; exceeding commits triggers steep overage charges and renewal leverage | Flexible monthly billing with optional annual reservation for savings; cancel anytime with no penalties |
| Infrastructure Monitoring | Comprehensive | Comprehensive |
| Container/K8s Support | Excellent | Native integration |
| Mobile Apps | iOS & Android | iOS & Android |
| Alerting | ML-based | ML-based anomaly detection |
| Cost Forecasting | Difficult to predict due to usage-based billing across multiple SKUs and overage charges | Straightforward per-agent pricing makes monthly and annual cost forecasting simple and reliable |
| Uptime Monitoring | Available through Synthetics, which is a separate paid product with its own per-test pricing | Built-in HTTP and TCP uptime monitoring included at no extra cost with every agent |
| Prometheus Support | Can ingest Prometheus metrics, but custom metrics from Prometheus exporters are billed per metric name | Native Prometheus compatibility — Glouton scrapes any Prometheus exporter, and metrics are stored in Prometheus-compatible format at no extra charge |
| OpenTelemetry | Supports OpenTelemetry ingestion for traces and metrics | Full OpenTelemetry support for metrics collection and integration with open standards |
| Agent | Proprietary closed-source agent with vendor-controlled updates and configurations | Open source agent (Glouton) with full source code transparency and community contributions |
| Data Portability | Limited data export options with proprietary formats that make migration difficult | Full data portability via Prometheus-compatible export, REST API, and open standard formats |
Cost
For a typical 100-host infrastructure with logs, uptime monitoring, container monitoring, and custom metrics. Prices based on publicly available pricing as of early 2026.
*Estimate based on published pricing. Actual costs often 2-3x higher with overages, additional indexed spans, and network monitoring add-ons.
*With 1-year reservation. Logs billed separately at 0.50€/GiB. All other features included in the per-agent price.
The numbers above are based on a typical 100-host setup. Plug in your own host count, log volume and add-ons to estimate how much you'd save by switching from Datadog to Bleemeo.
Advantages
Simple per-agent pricing includes all core monitoring features in a single line item. There are no separate SKUs to track, no overage surprises at the end of the month, and no annual commit requirements that lock you into estimated usage. Your finance team can forecast monitoring costs with confidence, knowing exactly what each agent costs regardless of how many metrics, dashboards, or alerts you create.
Our monitoring agent Glouton is fully open source and available on GitHub. You can inspect every line of code, contribute improvements, and verify exactly what data is being collected from your infrastructure. This transparency eliminates vendor lock-in and gives your security team complete visibility into agent behavior, unlike proprietary agents where you must trust the vendor implicitly.
All your monitoring data stays within the European Union on EU-based infrastructure. This makes GDPR compliance straightforward and eliminates concerns about cross-border data transfers. For organizations subject to European data sovereignty requirements or industry regulations, Bleemeo provides the data residency guarantees that US-headquartered vendors cannot always offer.
When you need help, you talk directly to the engineers who build the platform—not a tiered support system designed to funnel you toward premium support contracts. Our team focuses on helping you succeed with your monitoring goals, not on upselling additional product SKUs. Every customer gets access to responsive, knowledgeable support regardless of plan size.
Bleemeo's agent Glouton natively scrapes Prometheus exporters and stores all metrics in Prometheus-compatible format. This means you can use existing Prometheus queries, Grafana dashboards, and PromQL-based alerting rules without modification. Your data remains portable and accessible through open standards, so you are never locked into a proprietary ecosystem.
Every agent subscription includes infrastructure metrics, uptime monitoring, intelligent alerting, custom dashboards, and mobile app access. Logs are billed separately at a flat rate of 0.50€/GiB ingested—no separate indexing fees, no retention surcharges, and no hidden costs. You can see exactly what you will pay before you commit, and our pricing page shows every detail publicly.
Features
Monitor CPU, memory, disk, network, and process-level metrics across your entire infrastructure with automatic service discovery. Bleemeo's agent detects running services like databases, web servers, and message queues without manual configuration, so you get comprehensive visibility from the moment of installation.
Native integration with Docker and Kubernetes environments provides pod-level metrics, deployment health tracking, and full cluster overview dashboards. Monitor container resource usage, restart counts, and scheduling status without any additional cost or separate container monitoring add-on.
Collect metrics from AWS, Azure, and GCP alongside your on-premises infrastructure in a unified dashboard. Monitor cloud-specific services like RDS, Lambda, and managed Kubernetes clusters with the same agent and interface you use for bare-metal servers, providing a single pane of glass across hybrid environments.
Collect, search, and analyze logs from all your systems in a centralized platform. Full-text search, structured log parsing, and retention policies give you the visibility you need for troubleshooting and compliance, with straightforward per-GiB pricing that eliminates the complexity of separate indexing and archival tiers.
Machine learning-based anomaly detection identifies unusual patterns before they become outages, while smart alert routing ensures the right team member is notified through the right channel. Reduce alert fatigue with intelligent deduplication and escalation policies that keep your on-call engineers focused on real incidents.
Build the exact views your team needs with drag-and-drop widgets, custom metric queries, and shared dashboards that keep everyone aligned. Create operational dashboards for NOC teams, executive summaries for leadership, and detailed debugging views for engineers—all from the same intuitive interface without requiring a specialized query language.
Migration
Switching from Datadog to Bleemeo is straightforward and low-risk. Most teams run both systems in parallel for two to four weeks to validate coverage and build confidence before fully switching. Our engineering team provides hands-on migration support at no additional cost, helping you plan the transition and ensure nothing falls through the cracks.
Install the Bleemeo agent on your servers with a single command. The lightweight agent runs alongside your existing Datadog agent during the transition period without conflicts or performance impact. Deployment takes less than a minute per host and can be automated through your existing configuration management tools like Ansible, Puppet, or Terraform.
wget -qO- 'https://get.bleemeo.com?accountId=...'Once agents are deployed, verify that all running services are automatically detected. Bleemeo's agent identifies common services like MySQL, PostgreSQL, Redis, Nginx, Apache, Elasticsearch, and dozens more without any manual configuration. Review the auto-discovered services in your dashboard and confirm that coverage matches what you had in Datadog.
If you have custom application metrics, Bleemeo supports Prometheus exposition format natively. Point your existing Prometheus exporters at Glouton, which scrapes them directly and forwards the metrics to the Bleemeo platform. Custom metrics are included in your base pricing, so there are no additional charges regardless of cardinality.
Recreate your most critical dashboards using Bleemeo's drag-and-drop dashboard builder. Start with the operational views your NOC team relies on daily, then build out executive and team-specific dashboards. Our engineering team can assist in replicating complex Datadog dashboard layouts and ensuring metric parity across both platforms.
Configure your notification channels—email, Slack, PagerDuty, webhooks, and more—then set up alert rules that match your existing Datadog monitors. Bleemeo's ML-based anomaly detection often reduces alert noise compared to static thresholds, so your on-call team may experience fewer false positives while catching real issues earlier.
After running both systems side by side for two to four weeks, compare alert accuracy, dashboard coverage, and metric completeness. Once your team is confident that Bleemeo provides equivalent or better visibility, decommission the Datadog agents and cancel your subscription. From this point forward, enjoy predictable monthly billing with no surprise overages or complex SKU negotiations at renewal time.
Engineers and CTOs trust Bleemeo to monitor their infrastructure
We need our teams focused on our core business — digital signage — rather than on infrastructure monitoring. Bleemeo monitors our entire environment, from bare metal to Azure, and frees our teams from useless alerts while guaranteeing our quality of service.
Bleemeo has supported us for years: simple, reliable monitoring that is essential to the quality of service we owe our customers.

On-premise or in the cloud, Bleemeo monitors my clients' Kubernetes clusters without any complexity. A tool I recommend for its simplicity and the clarity it brings.

Customer since day one, I'm thrilled with Bleemeo. It's easy to install, efficient, and just keeps getting better!

During a short lunch break we installed Bleemeo, created a custom metric, tested alerts, and were ready for production. The speed of deployment is remarkable.

Bleemeo support is simply legendary — fast, knowledgeable, and always there when we need it.

Bleemeo was incredibly fast to deploy. In about an hour we rolled it out across more than 100 servers and immediately gained full visibility into our infrastructure.

We set up monitoring for all our servers in just a few hours. The dashboard is clear, powerful, and genuinely enjoyable to use.

We deployed Bleemeo across our server infrastructure in only a few hours. Uptime monitoring now alerts us instantly whenever a service encounters an issue.

See it live
Watch how teams go from install to full monitoring in under 5 minutes
Bleemeo uses simple per-agent pricing at 10.99€/month per server. No separate charges for custom metrics, dashboards, or alerting. Datadog's per-host pricing plus add-ons for logs, APM, and custom metrics typically costs 3-5x more.
Yes. Bleemeo provides infrastructure monitoring, log management, uptime checks, dashboards, alerts with ML anomaly detection, and mobile apps. The main difference is that Bleemeo focuses on infrastructure monitoring rather than APM/tracing.
Most teams complete the migration in a few days. Install the Bleemeo agent alongside Datadog, verify service discovery, then run both in parallel for validation before switching.
Yes. Glouton is fully open source under the Apache 2.0 license. Unlike Datadog's proprietary agent, you can inspect, modify, and contribute to the code.
Yes. Bleemeo natively monitors Docker containers and Kubernetes clusters with automatic pod, service, and node discovery. No separate container monitoring add-on needed — it's included in the base price.
Bleemeo sends notifications via email, Slack, PagerDuty, Microsoft Teams, webhooks, and mobile push notifications (iOS and Android). All channels are included — no extra cost per integration.
Yes. Bleemeo includes centralized log collection and search at 0.50€/GiB ingested. No separate SKU, no per-GB indexing fees on top of ingestion — one simple price.
Bleemeo infrastructure is hosted in Europe. All metrics and logs are stored in EU data centers with GDPR compliance built in.
Also compare Bleemeo to: