

Built on Prometheus & OpenTelemetry
No vendor lock-in
Looking for a New Relic alternative with transparent pricing? New Relic's "free forever" tier runs out fast, and per-GB data ingest plus $549/user/month seat pricing makes costs unpredictable. Bleemeo is a straightforward New Relic replacement with per-agent pricing — no data ingest surprises, no per-seat charges, no GB calculations.
15-day free trialNo credit card requiredNo long-term commitment
No vendor lock-in
Data stays in EU · GDPR compliant
Across Europe and beyond
Trusted by 500+ companies replacing New Relic's per-seat billing
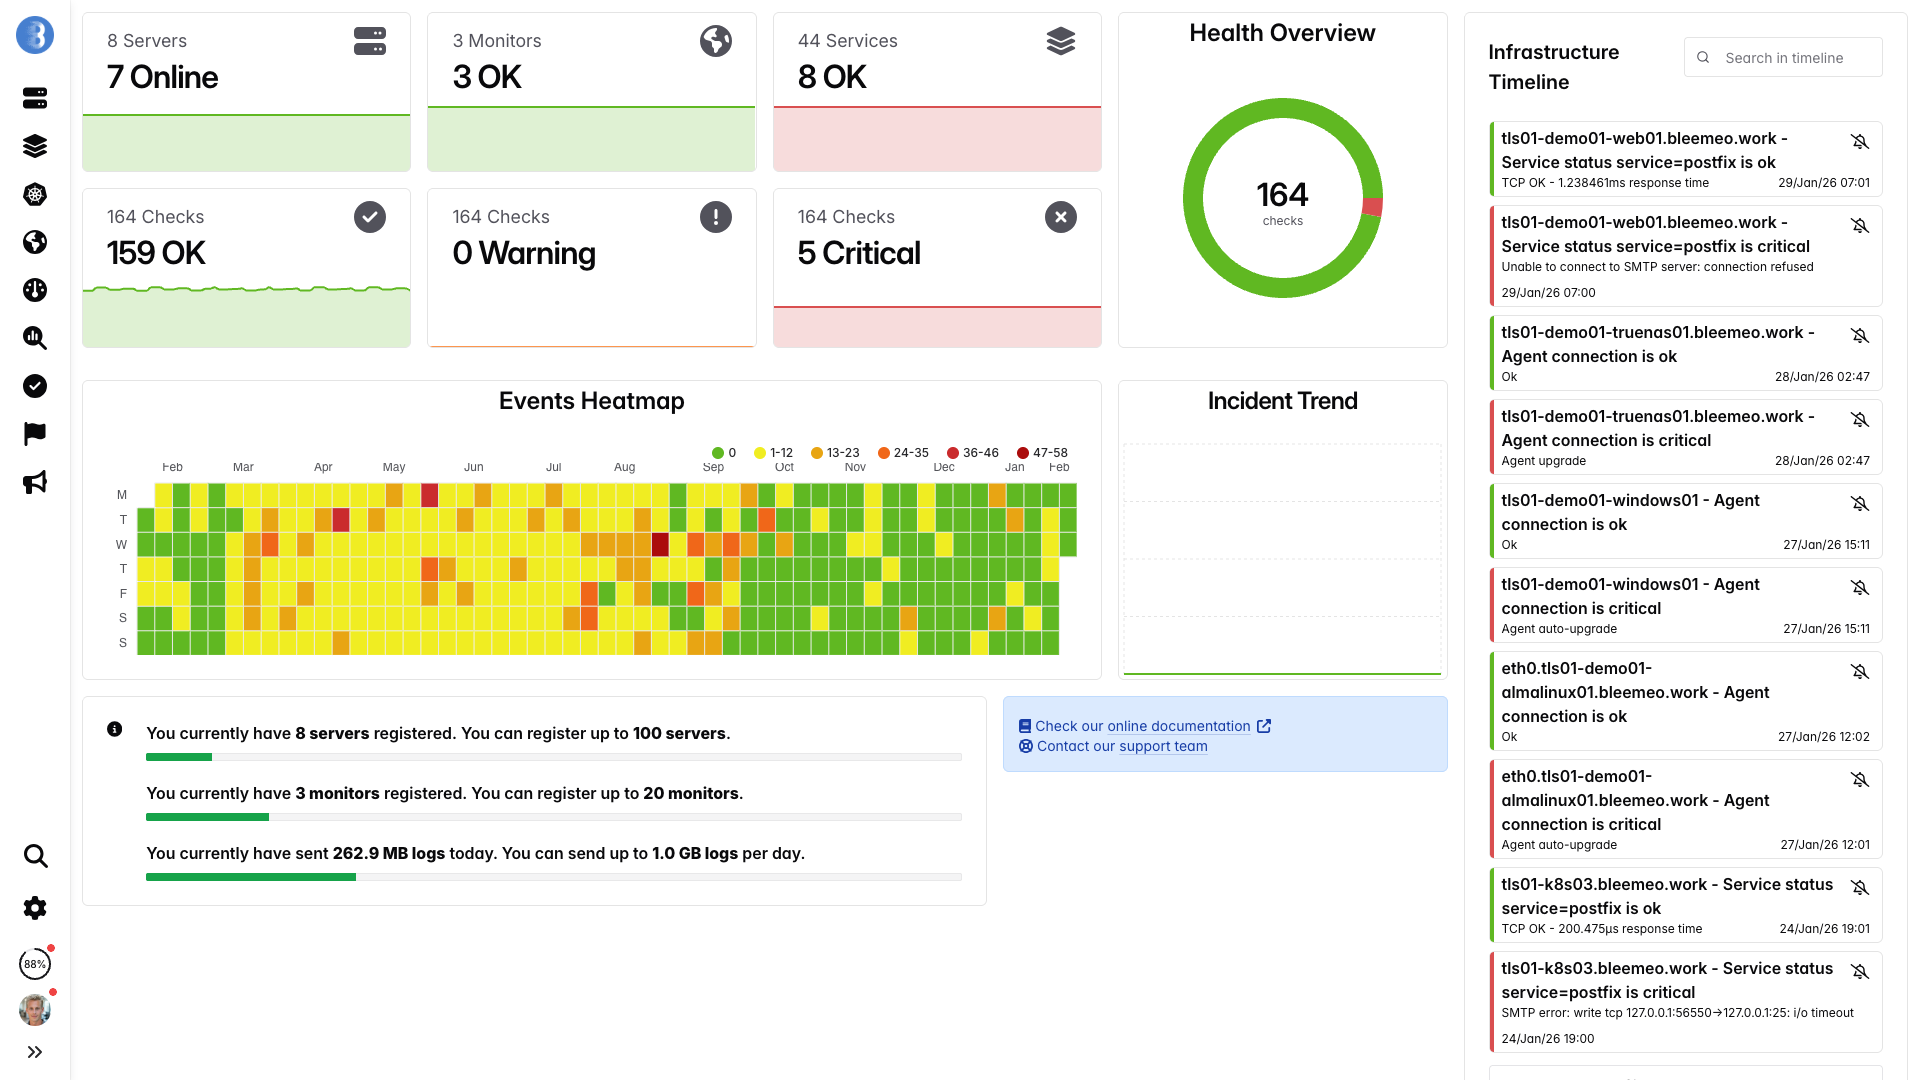
Real-time dashboards, ready in minutes — no configuration needed
From sign-up to dashboard in 30 seconds — no NRQL, no per-seat math
One command, no configuration — metrics flowing in under a minute.
Why switch
New Relic charges per GB of data ingested beyond the free 100GB/month tier. The more servers, containers, and services you monitor, the more telemetry data flows in — and costs escalate unpredictably. Teams frequently report monthly bills doubling or tripling after adding a new cluster or enabling distributed tracing across their microservices.
New Relic bundles over 30 products into its full-stack observability platform — APM, browser monitoring, synthetic monitors, mobile monitoring, serverless, and more. Most infrastructure teams only need server and container monitoring, yet they end up paying for feature sprawl they will never touch. This bundled approach inflates costs and adds unnecessary complexity to the user interface.
Every NRQL query you run against your telemetry data counts toward your compute usage limits. This means that simply building dashboards, investigating incidents, or running ad-hoc analyses can drive up your bill in ways that are difficult to forecast. Teams often hesitate to explore their own data because every query has a hidden cost attached to it.
NRQL is a proprietary query language that your team must learn from scratch before they can build useful dashboards or set up meaningful alerts. Combined with New Relic's complex data model — entities, relationships, attributes, and events — it takes weeks of training before new team members can be productive. This investment in vendor-specific knowledge does not transfer to other tools.
We deployed Bleemeo across our server infrastructure in only a few hours. Uptime monitoring now alerts us instantly whenever a service encounters an issue.

Head to head
| Feature | New Relic | Bleemeo |
|---|---|---|
| Pricing Model | Per-GB data ingest + per-seat user fees | Simple per-agent pricing |
| Cost Predictability | Varies monthly with data volume and queries | Fixed monthly cost per server |
| Setup Time | Agent install + manual instrumentation + YAML config | Single command install with full auto-discovery |
| Infrastructure Monitoring | Comprehensive | Comprehensive |
| Service Discovery | Manual instrumentation and tagging required | Automatic detection of 100+ services, zero config |
| Dashboards | Must build manually using NRQL queries | Pre-built dashboards, auto-activated per service |
| Data Retention | 8 days to 13 months depending on plan tier | 13 months at full resolution, all plans |
| Alerting | AI-powered | ML-based anomaly detection |
| Container/K8s | Full support | Native integration |
| Agent | Proprietary | Open source (Glouton) |
| Prometheus Compatibility | OpenTelemetry collector support | Native Prometheus exporter scraping and PromQL-compatible metrics |
| User Seat Pricing | $549/user/month on Pro plan | Unlimited users included |
| Query Language | Proprietary NRQL to learn | Standard PromQL support |
Cost
For a typical 100-host infrastructure with 5 team members generating ~500GB/month of telemetry data
*Costs increase unpredictably with data volume growth and additional team members
*With 1-year reservation. Logs billed separately at 0.50€/GiB.
The numbers above are based on a typical 100-host setup with 5 seats. Plug in your own host count, team size and ingest volume to estimate how much you'd save by switching from New Relic to Bleemeo.
Advantages
Per-agent pricing means your bill scales linearly with your infrastructure, not your data volume. Unlike New Relic where adding a busy microservice can spike your ingest costs overnight, Bleemeo charges a flat rate per monitored server. You always know exactly what next month's bill will be, making budgeting straightforward.
Auto-discovery means dashboards and alerts are ready within minutes of installing the agent, not days of writing NRQL queries and configuring instrumentation. Bleemeo automatically detects your running services — databases, web servers, message queues — and activates the right dashboards and alert thresholds without any manual configuration.
Monitor, query, and alert as much as you need without worrying about usage-based billing on data access. With New Relic, every NRQL query and dashboard refresh consumes compute capacity units that add to your bill. With Bleemeo, your team can investigate incidents and explore metrics freely without cost anxiety.
Glouton, our monitoring agent, is fully open source under the Apache 2.0 license. You can inspect every line of code running on your servers, audit it for security, and even contribute improvements. Unlike New Relic's proprietary agent, there is no vendor lock-in — your data collection layer remains transparent and under your control.
All monitoring data is stored and processed in European data centers, ensuring full GDPR compliance without extra configuration or contractual add-ons. For organizations with strict data sovereignty requirements, this eliminates the complexity of negotiating data processing agreements with US-based vendors like New Relic.
Talk directly to the engineers who build and maintain the platform, not outsourced support agents or chatbots. Every Bleemeo customer gets access to our technical team who understand your infrastructure and can help resolve issues quickly. No tiered support plans, no paying extra for faster response times.
Features
Full system metrics collection including CPU, memory, disk I/O, network traffic, and swap usage. Automatic service discovery identifies and monitors over 100 services out of the box — from MySQL and PostgreSQL to Redis, Nginx, Apache, and RabbitMQ — all without writing a single line of configuration.
Native Docker and Kubernetes monitoring that automatically detects containers, pods, deployments, and services. Get per-container resource metrics, pod restart tracking, and cluster-level health views without deploying complex DaemonSets or configuring custom Helm charts.
Centralized log collection, indexing, and full-text search at a transparent 0.50€/GiB rate. Unlike New Relic's log management where costs are buried inside your data ingest quota, Bleemeo keeps log pricing separate and predictable. No complex log pipelines or parsing rules to configure — start searching your logs immediately.
Intelligent alerting with pre-configured thresholds based on industry best practices, plus machine learning anomaly detection that adapts to your infrastructure's normal behavior. Notify your team through email, Slack, PagerDuty, Microsoft Teams, webhooks, or any custom integration — all included in every plan.
Pre-built, production-ready dashboards that activate automatically for every discovered service on your infrastructure. Unlike New Relic where you must craft each dashboard from scratch using NRQL, Bleemeo gives you immediate visibility. Need something custom? Our dashboard builder lets you create tailored views without learning a proprietary query language.
Full-featured iOS and Android mobile applications with real-time push notifications for critical alerts. Check dashboards, acknowledge incidents, and monitor your infrastructure health from anywhere — whether you are on call, commuting, or away from your desk. Available on all plans at no additional cost.
Migration
Switching from New Relic to Bleemeo is straightforward because there is no complex instrumentation to replicate. Most teams run both systems in parallel for a week to validate coverage before fully switching. Our engineering team can help with migration planning and ensure a smooth transition.
Install the Glouton agent on each server with a single command. No complex instrumentation libraries, no language-specific SDKs, no YAML configuration files to write. The agent starts collecting system and service metrics immediately after installation.
wget -qO- 'https://get.bleemeo.com?accountId=...' | sudo bashLog into the Bleemeo dashboard and verify that your running services — databases, web servers, caches, message brokers — have been automatically detected and are reporting metrics. Unlike New Relic, there is no manual instrumentation step required for infrastructure monitoring.
Compare the automatically generated Bleemeo dashboards with the ones you built manually in New Relic using NRQL. You will find that most infrastructure views — CPU, memory, disk, network, and per-service metrics — are already available out of the box without writing a single query.
Connect your existing notification channels — Slack, PagerDuty, Microsoft Teams, email, or custom webhooks. Bleemeo comes with sensible default alert thresholds already active, so you are protected from the moment the agent starts reporting. Fine-tune thresholds later based on your specific requirements.
Run Bleemeo alongside New Relic for one to two weeks to ensure complete coverage. Compare alert accuracy, dashboard completeness, and metric availability between both platforms. This parallel period gives your team confidence that nothing is missed before cutting over.
Uninstall the New Relic agents from your servers and cancel your subscription. From this point forward, enjoy predictable per-agent billing with no data ingest overages, no per-seat user fees, and no surprises on your monthly invoice. Most teams see cost reductions of 60-80% compared to their New Relic bill.
Engineers and CTOs trust Bleemeo to monitor their infrastructure
We need our teams focused on our core business — digital signage — rather than on infrastructure monitoring. Bleemeo monitors our entire environment, from bare metal to Azure, and frees our teams from useless alerts while guaranteeing our quality of service.

Bleemeo has supported us for years: simple, reliable monitoring that is essential to the quality of service we owe our customers.

On-premise or in the cloud, Bleemeo monitors my clients' Kubernetes clusters without any complexity. A tool I recommend for its simplicity and the clarity it brings.

Customer since day one, I'm thrilled with Bleemeo. It's easy to install, efficient, and just keeps getting better!

During a short lunch break we installed Bleemeo, created a custom metric, tested alerts, and were ready for production. The speed of deployment is remarkable.

Bleemeo support is simply legendary — fast, knowledgeable, and always there when we need it.

Bleemeo was incredibly fast to deploy. In about an hour we rolled it out across more than 100 servers and immediately gained full visibility into our infrastructure.

We set up monitoring for all our servers in just a few hours. The dashboard is clear, powerful, and genuinely enjoyable to use.

We deployed Bleemeo across our server infrastructure in only a few hours. Uptime monitoring now alerts us instantly whenever a service encounters an issue.
See it live
Watch how teams go from install to full monitoring in under 5 minutes
Bleemeo charges per agent (10.99€/month per server), not per GB of data or per user seat. No data ingest limits, no query charges, no per-seat fees.
Yes. Bleemeo covers infrastructure metrics, log management, uptime monitoring, dashboards, and alerting with ML anomaly detection. If you primarily use New Relic for infrastructure, Bleemeo is a direct replacement at a fraction of the cost.
No. Bleemeo's dashboards are pre-built and auto-activated for every discovered service. No query language required for day-to-day monitoring.
Unlimited. There are no per-user or per-seat charges. Your entire team can access dashboards, alerts, and logs at no extra cost.
Yes. Native Docker and Kubernetes monitoring with automatic pod, service, and node discovery. No additional instrumentation or agent configuration needed.
Bleemeo includes centralized log collection at 0.50€/GiB ingested. Unlike New Relic where log data counts toward your ingest quota, Bleemeo's log pricing is separate and predictable.
Yes. Bleemeo offers a free tier to monitor up to 3 servers with no time limit. No data ingest caps, no user seat restrictions.
Bleemeo infrastructure is hosted in Europe with GDPR compliance built in. All metrics and logs stay in EU data centers.
Also compare Bleemeo to: