AI & Machine Learning
Bleemeo brings machine learning into your monitoring workflow — no data science expertise required, and no model to train. These features work out of the box, watching your metrics around the clock so your team can move from reactive firefighting to proactive operations.
Overview
Why AI-Powered Monitoring Matters
Traditional monitoring relies on static thresholds: alert when CPU exceeds 90%, when memory drops below 10%, when disk usage crosses 80%. These rigid rules generate constant false positives because they cannot distinguish between a harmless nightly backup spike and a genuine runaway process. Teams learn to ignore alerts, and when a real problem surfaces, it gets lost in the noise.
Intelligent Anomaly Detection
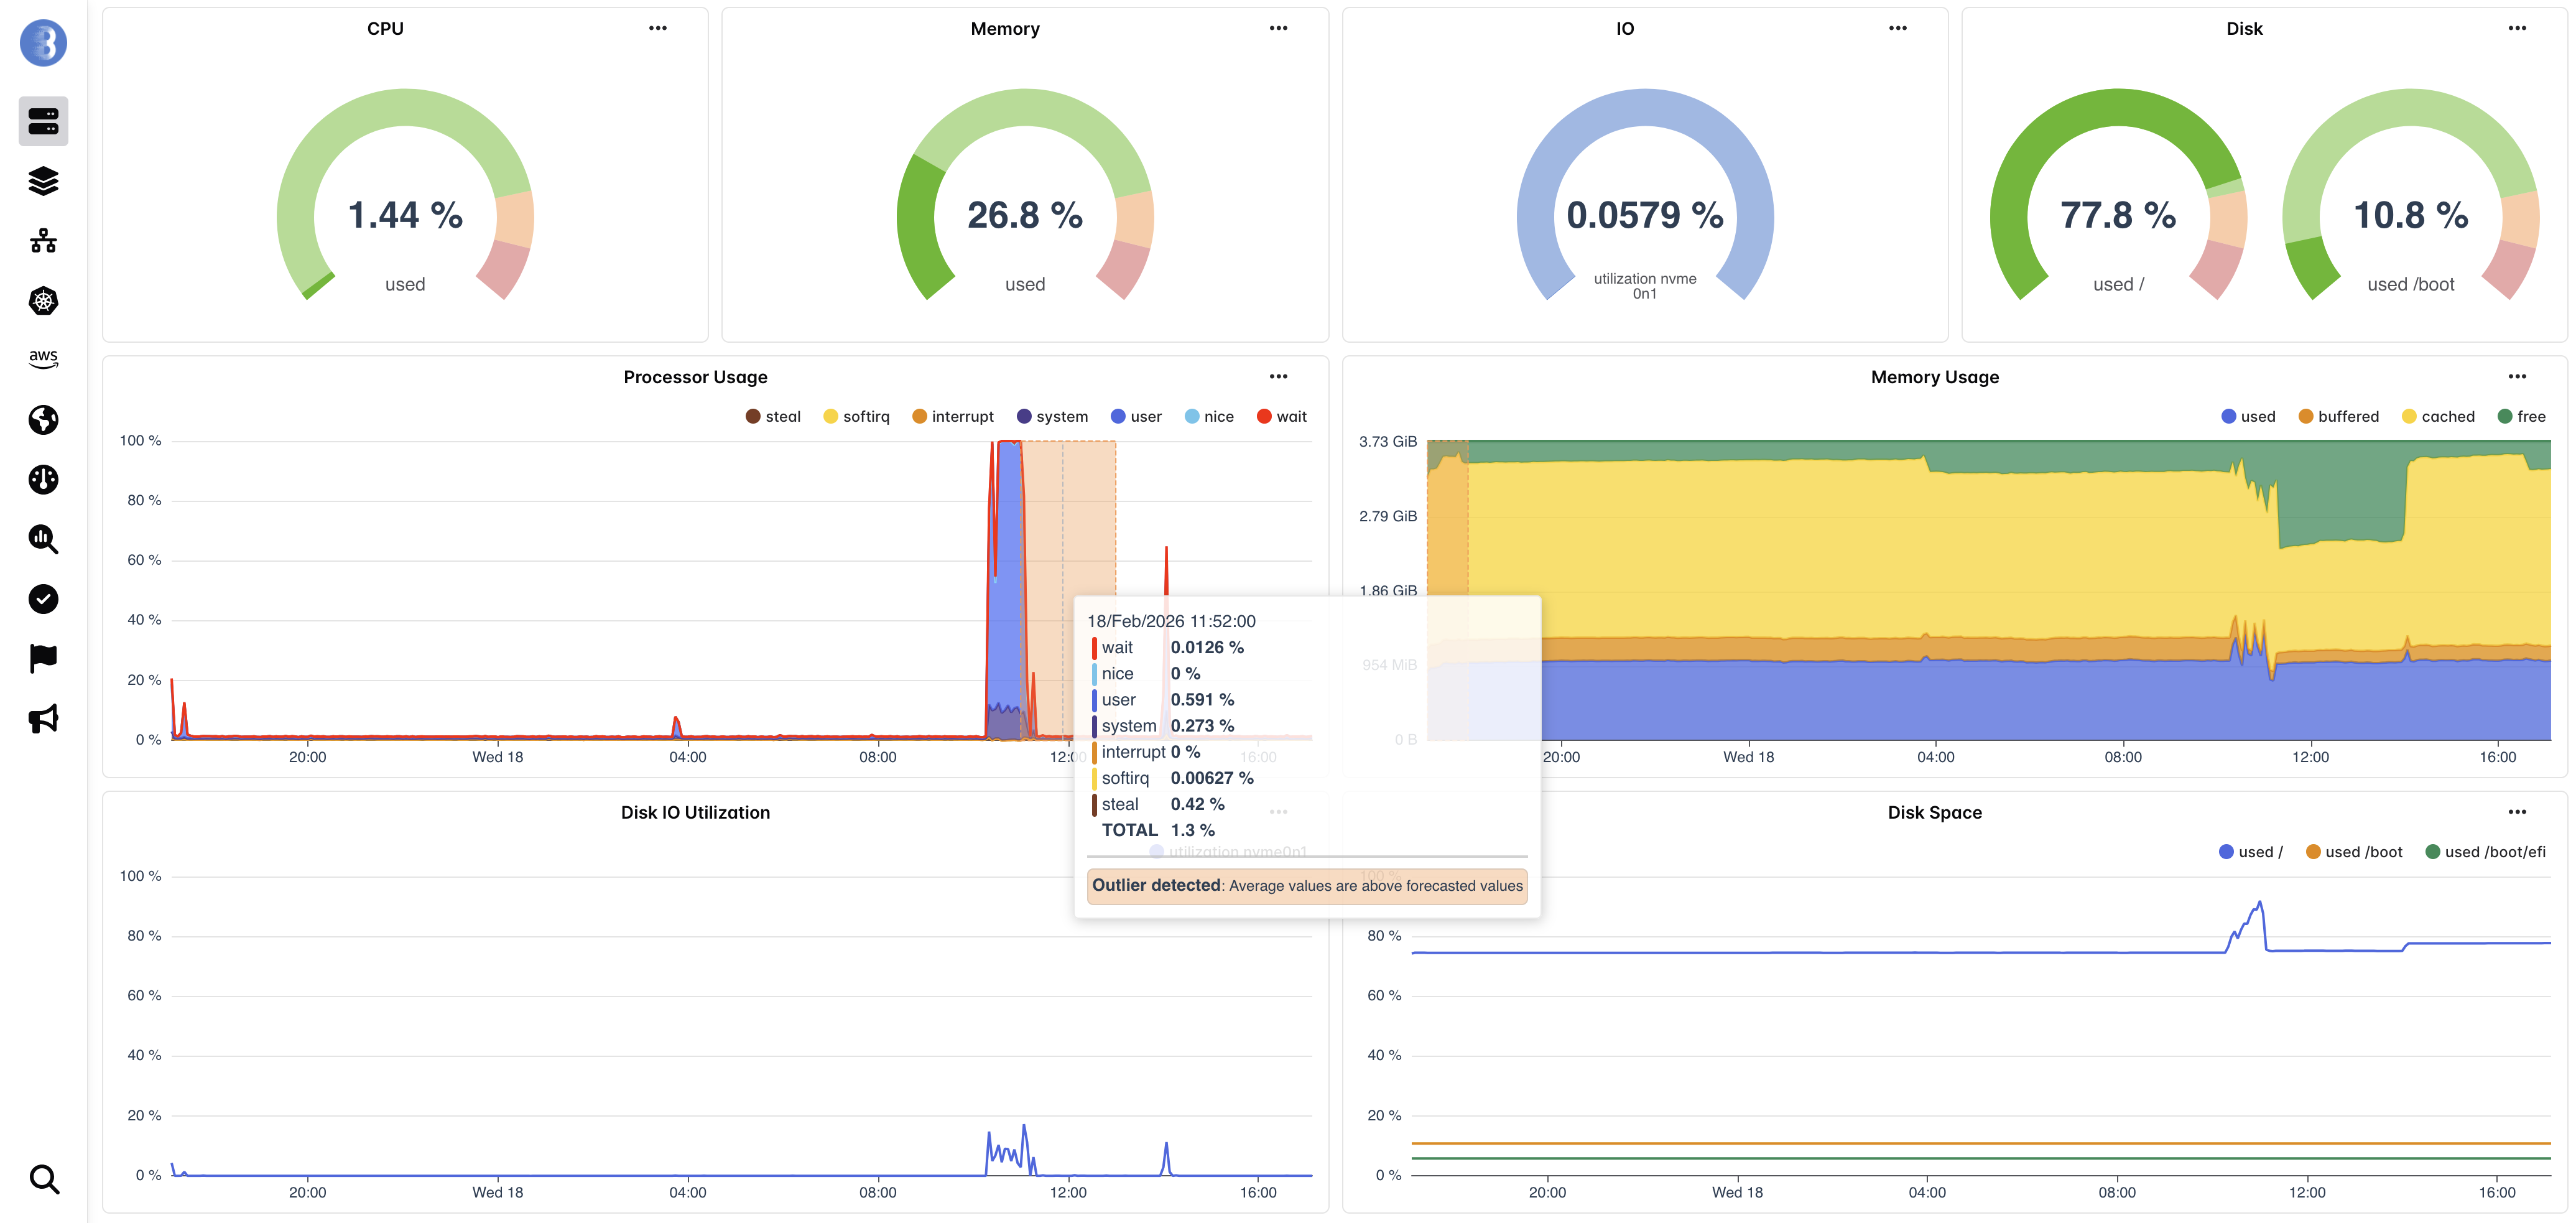
Instead of asking you to define what "normal" looks like for every metric on every server, Bleemeo learns it. A time-series foundation model reads the last two weeks of CPU, memory and swap usage on each server and predicts the range those metrics should stay in over the next 24 hours, following their daily and weekly rhythm. Your data is never used to train the model — it is read at inference time and nothing else. When the hourly average leaves that range, you know something genuinely unusual is happening.
Predictive Capacity Planning
Running out of something is one of the most common causes of infrastructure outages. Bleemeo fits a trend to the usage history of your disks, memory and swap and calculates when each will reach warning, critical, and full. Instead of discovering a full disk at 3 AM when a database crashes, your team gets a date — with time to act. And a date is only announced when the drift behind it actually held, so a service that starts and takes half the RAM is not reported as a leak.
Conversational Infrastructure
The Bleemeo MCP server bridges the gap between your monitoring data and modern AI assistants. Connect Claude (Desktop and Code), ChatGPT, Mistral Le Chat, Gemini CLI, Cursor, VS Code, Windsurf, Zed or another of the 13 documented clients to your account and ask questions in natural language: "Which servers have critical alerts?", "What changed this week?" The MCP server provides read-only access to 30+ monitoring tools, transforming your platform into a conversation partner that understands your infrastructure.
Pipeline
How AI Enhances Your Monitoring
Capabilities
AI-Powered Capabilities
Time-Series Foundation Model
Amazon's Chronos-Bolt reads two weeks of hourly history and returns the range a metric should stay in, directly as quantiles. It runs zero-shot — the model is used as published, never fine-tuned on customer data — and produces a forecast in about 6 milliseconds on a CPU, so every watched metric on every server is re-forecast around the clock.
Predictive Capacity Planning
A verified linear trend projects disk, memory, swap and monthly bandwidth usage to the date each will reach warning (80%), critical (90%), and full (100%). Not a vague "running low", but "this volume will be full on March 15th" — and nothing is announced unless the drift held across two independent windows.
MCP Server for AI Assistants
Connect Claude (Desktop and Code), ChatGPT, Mistral Le Chat, Gemini CLI, Cursor, VS Code, Windsurf, Zed or another documented client to your Bleemeo account and query your infrastructure using natural language. 30+ read-only tools let AI assistants search agents, services, containers, events, logs, and audit trails — transforming monitoring data into a conversational experience.
Zero-Configuration Intelligence
There is no threshold to pick and no model to train. Bleemeo enrols CPU, memory and swap on every server once the metric has eight days of history, refreshes the forecast every four hours, and opens an anomaly when the hourly average leaves the expected range for two hours in a row. Servers with less than 1 GB of RAM are skipped, where the signal is too noisy to be worth acting on.
Reduced Alert Fatigue
A range that follows daily and weekly patterns does not fire on a nightly backup that happens every night. And an anomaly is not a severity: it shows up on the charts, on the home page and on the agent, but it never pages anyone. It is there when you look, not at three in the morning.
It Learns From Your Answers
Every anomaly can be marked useful or not. Repeated false alarms pause detection on that metric rather than asking you to tune anything, so the signal gets quieter over time instead of louder. The forecast itself is recomputed every four hours, following your infrastructure as it changes.
Anomaly detection
Anomaly Detection Without a Threshold
Bleemeo learns the daily and weekly rhythm of CPU, memory and swap usage on each server from the last two weeks, and predicts the range those metrics should stay in over the next 24 hours. The model behind it is Amazon's Chronos-Bolt, a time-series foundation model that returns its forecast directly as quantiles. It is used zero-shot: the published model is applied to your metrics as-is, and your data is never used to train it.
An anomaly opens when the hourly average leaves the expected range for two hours in a row, and closes after two hours back inside. Detection starts once a metric has eight days of history, and skips servers with less than 1 GB of RAM, where the signal is too noisy to be worth acting on. The forecast is refreshed every four hours, so a change of regime during the day is picked up the same day rather than at the next midnight.
- No Threshold to Configure
There is nothing to pick and nothing to tune. The expected range comes from the metric's own history, so 95% CPU at 2 AM during the nightly ETL is normal and 75% CPU at noon on a Tuesday is not — without anyone writing that rule down.
- The Lead Time Is Measured, Not Promised
Each anomaly is matched with the first warning or critical event that followed it on the same host. The card shows the gap — "alert 42 minutes later" — and each view summarises how many anomalies were followed by an alert and the median lead. You can see what the detection is actually worth on your own infrastructure.
- It Learns From Your Answers
Every anomaly takes a yes or no. Repeated false alarms pause detection on that metric on their own, so a noisy signal goes quiet instead of training you to ignore the feature.
- An Anomaly Is Not a Severity
Anomalies appear on the charts as a band, on the home page, on the agent header and next to the metric in the status list — and they never page anyone. They are context for when you look, not another reason to be woken up.
- Automatic Coverage
CPU, memory and swap are enrolled on every eligible server without configuration. No per-server setup, no metric selection, no model to retrain when you deploy something new.
Capacity
Capacity Forecasting: Disk, Memory and Swap
Running out of disk space remains one of the top causes of unexpected downtime. Databases crash, log files stop writing, applications fail with cryptic errors, and backups silently stop completing. The damage often extends far beyond the immediate outage — corrupted data, incomplete transactions, and cascading failures across dependent services. Yet exhaustion is almost always preventable with enough advance warning.
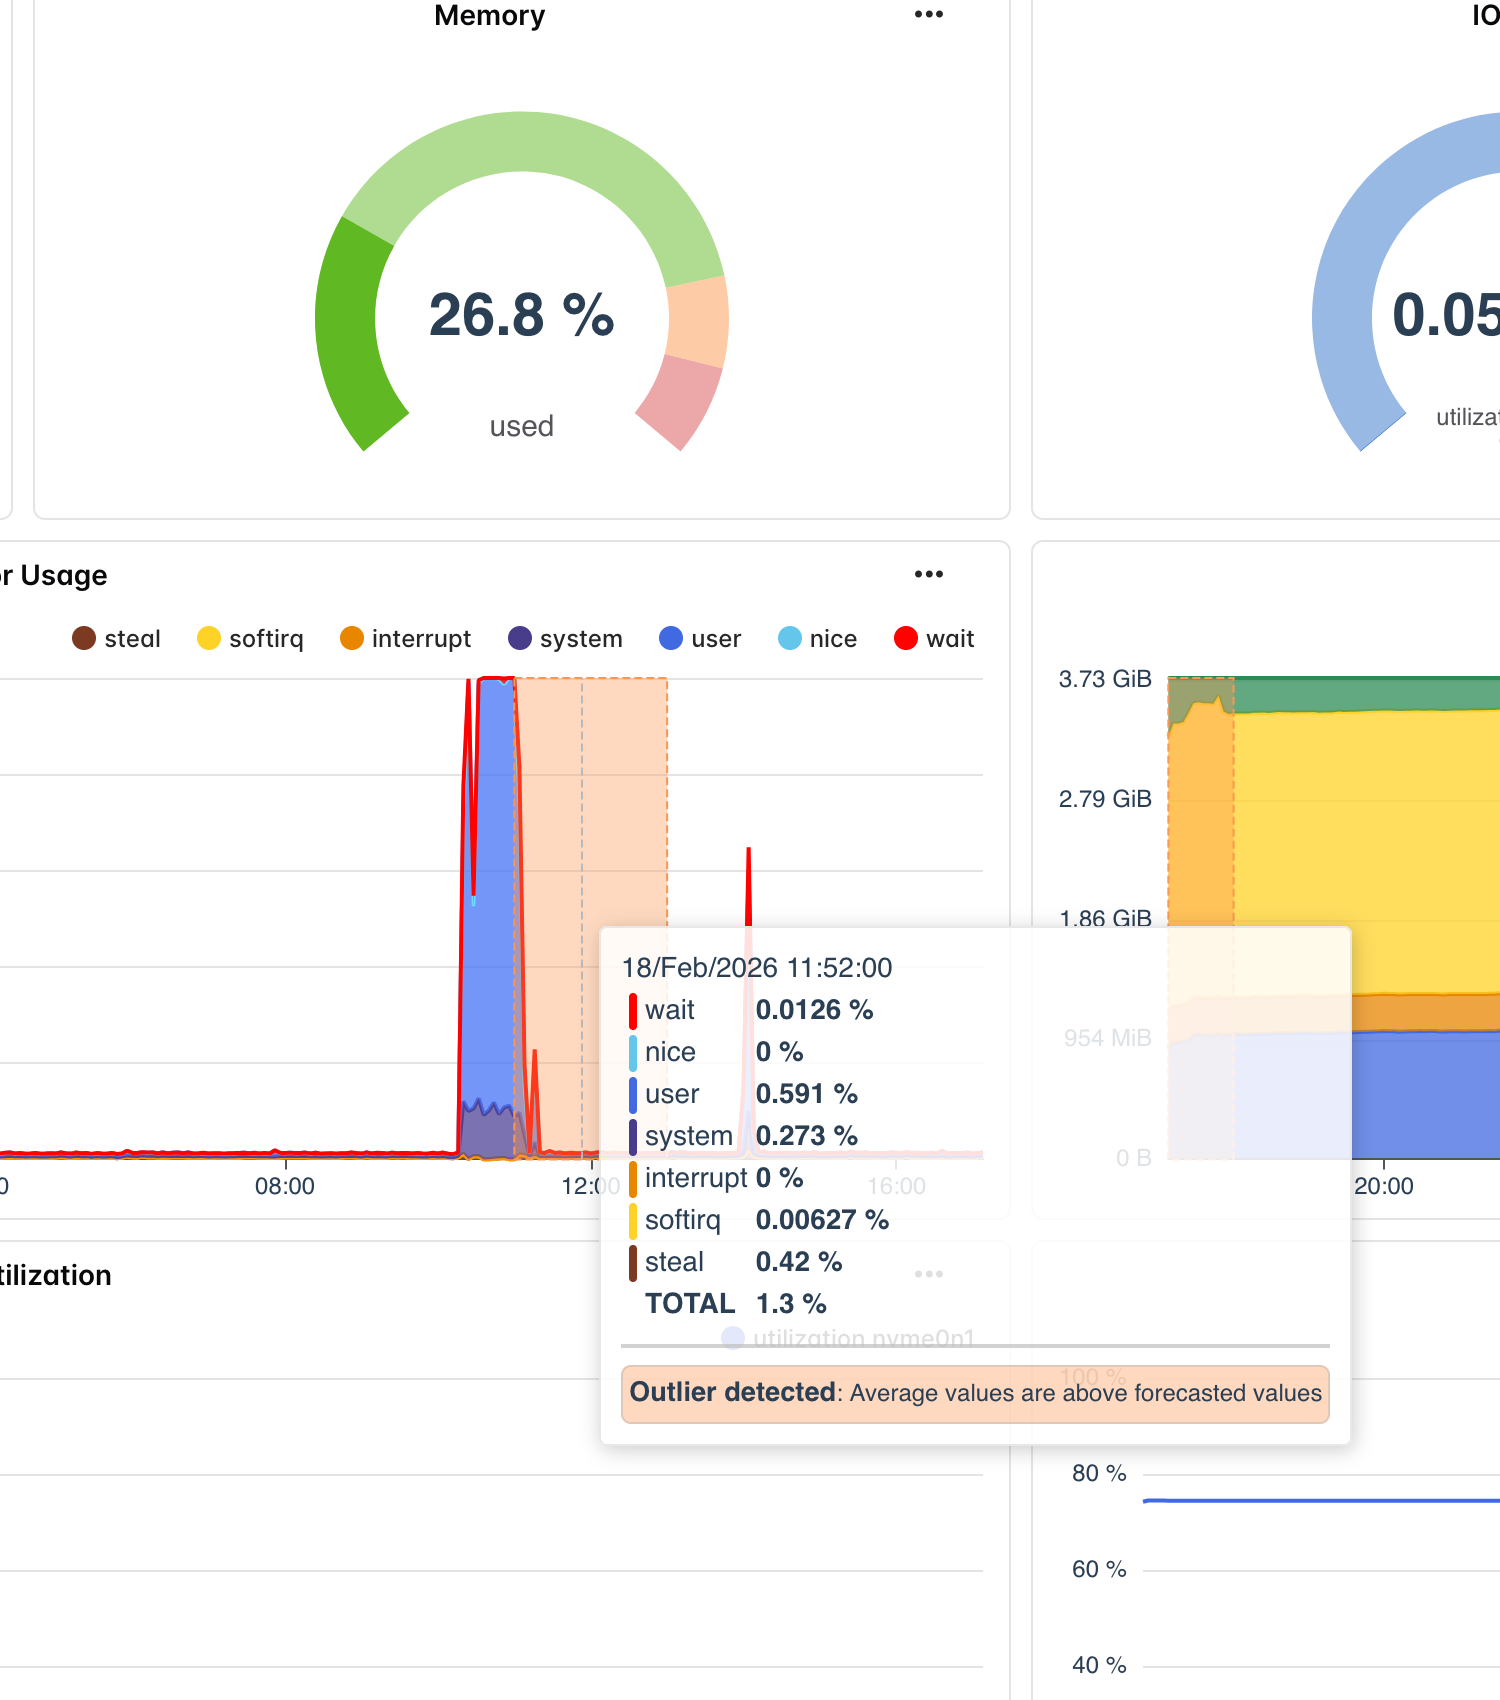
Bleemeo fits a linear trend to the usage history of every monitored disk partition, and to memory and swap on every server, and projects it to the date each will cross three thresholds: warning at 80%, critical at 90%, and shortage at 100%. Each prediction returns a specific timestamp — not a vague "running low" warning, but an exact date like "this partition will reach 90% capacity on April 3rd, 2026 at 14:30 UTC." Monthly network bandwidth is projected the same way.
Memory is the case that needed both models. A slow leak stays inside the anomaly band, because the band relearns the drift as the new normal on every run — so the trend model answers the question the band cannot: not "is this normal right now?" but "when does this break?"
- Three-Tier Threshold Predictions
Get advance warning at warning (80%), critical (90%), and shortage (100%) levels. Each threshold generates its own predicted timestamp, letting you prioritize response: plan cleanup at the warning stage, schedule expansion at the critical stage, and escalate at the shortage stage.
- Memory and Swap, Not Just Disk
A slow memory leak is invisible to a band that relearns it as normal, and no threshold catches it before the machine starts swapping. Memory and swap carry both a daily shape worth learning and a drift towards a limit that has an absolute meaning, so they get both models.
- Only a Drift That Really Happened
A single step looks like a rise across the whole window: an application that starts and holds half the memory, or a dataset copied onto a disk, used to get a date for an exhaustion that never comes. A date is now announced only if the drift the slope predicts actually held over two independent windows.
- Close Predictions Stay in the Fast Lane
A disk announced full in 26 hours is re-checked every four hours, so it stops warning quickly once someone frees space. A disk that fills next spring is re-checked once a day — its answer moves on a scale of days and its query reads a month of history.
- Automatic Coverage
Every monitored partition, and memory and swap on every server, is enrolled without configuration. As soon as the Glouton agent reports usage, history accumulates and predictions start — no per-server or per-partition setup.
- It reaches you before you look
A capacity date landing in the next 29 days is carried into the weekly report, alongside expiring TLS certificates and domain registrations. The soonest one leads the email with its countdown, so a disk filling in three weeks is something you read on a Monday morning rather than something you discover.
MCP server
MCP Server: Talk to Your Infrastructure
Query your monitoring data using natural language through your favorite AI assistant
The Bleemeo MCP (Model Context Protocol) server connects your monitoring platform to the world of AI assistants. Once configured, you can ask questions about your infrastructure in plain English and receive instant, contextual answers backed by real-time monitoring data. There is no need to learn query languages, navigate complex dashboards, or write custom scripts — simply describe what you want to know, and the AI assistant queries Bleemeo on your behalf.
The MCP server exposes 30+ read-only tools that cover every aspect of your monitoring data. AI assistants can list all deployed agents and their status, retrieve service health details, check container metrics, query events and alerts, search across all resources globally, inspect audit logs, and even list invoices. Ask about your metrics, not just your inventory: PromQL queries and metric history are among the tools. All access is authenticated via OAuth and strictly read-only — the MCP server cannot create, modify, or delete any resources on your Bleemeo account, ensuring your infrastructure remains safe while enabling powerful AI-driven analysis.
Infrastructure Health
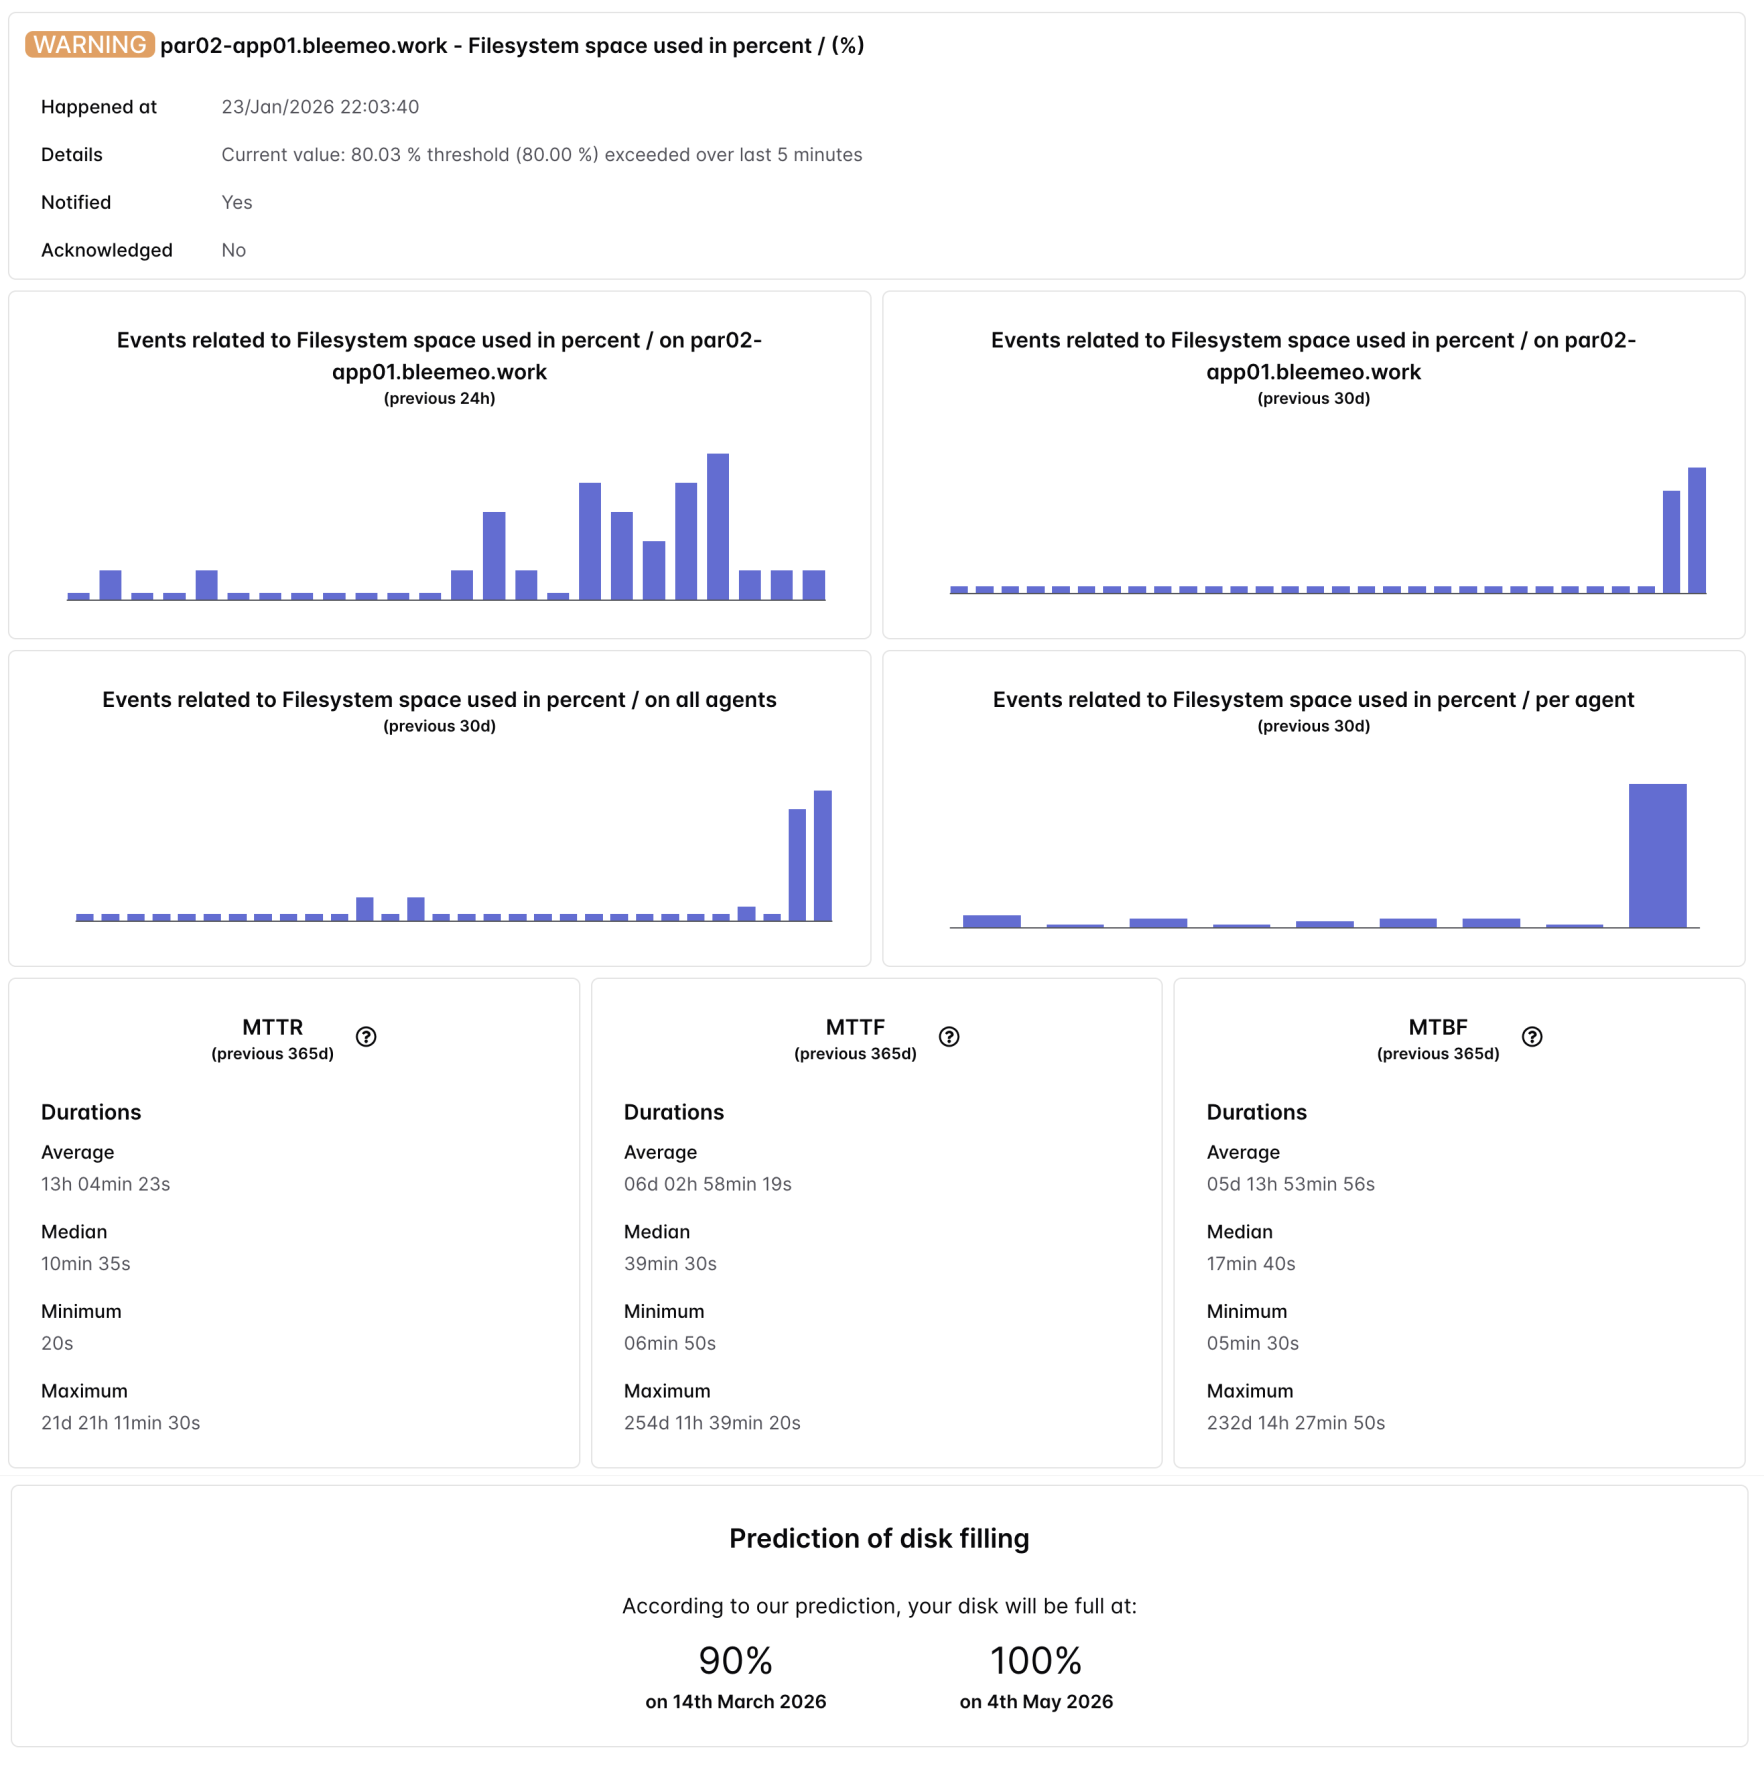
Ask your AI assistant "What is the overall health of my infrastructure?" and get a comprehensive summary of server statuses, active alerts, service availability, and resource utilization across your entire fleet. The MCP server queries agents, events, and services simultaneously to build a complete picture.
- List and inspect agents
- Query active events and alerts
- Check service health status
- Global search across resources
Troubleshooting & Analysis
During an incident, ask "Which services have critical alerts right now?" or "What changed in the last hour?" The AI assistant cross-references alert data, recent events, audit logs, and container statuses to help you identify root causes faster than navigating multiple dashboard views manually.
- Review logs from infrastructure
- Inspect container status and metrics
- Access audit trail of changes
- Examine healthcheck results
Conversational Monitoring
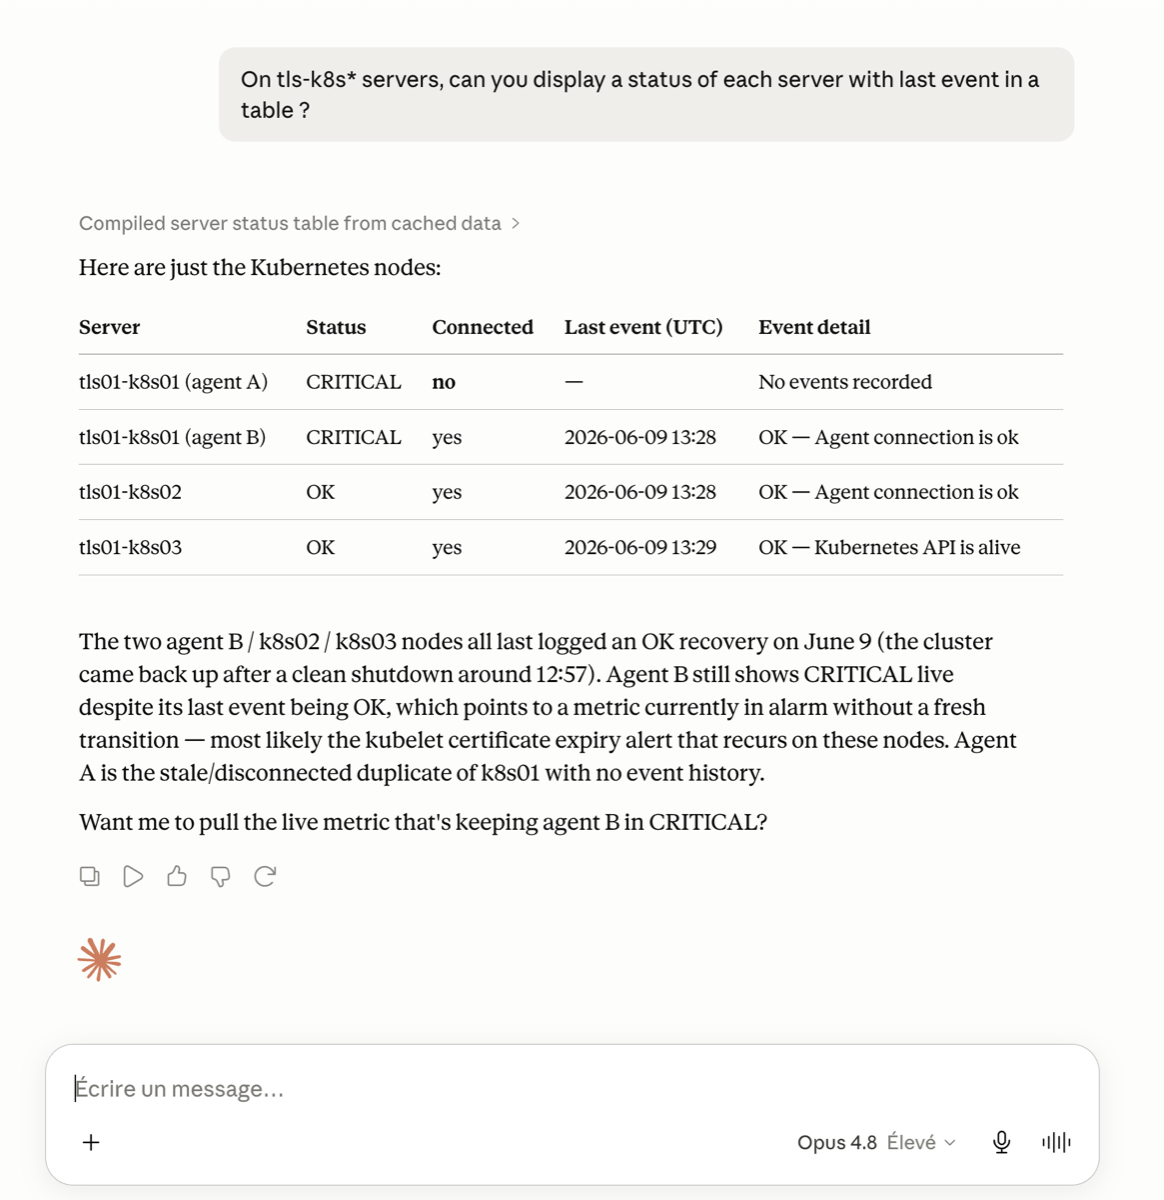
Go beyond simple queries with follow-up questions. Start with "Show me my Kubernetes agents" and then drill down: "Which one has the highest CPU usage?", "What services are running on that node?", "Are there any recent alerts for it?" The AI maintains context across the conversation.
- List agent types (AWS, K8s, SNMP)
- Retrieve agent facts and metadata
- List applications and details
- Query Glouton configuration
Supported AI Assistants
The MCP server integrates with the leading AI assistants, code editors and CLI tools. Authentication is handled via OAuth — launch the MCP connection, authorize in your browser, select your Bleemeo account, and you are ready to start querying.
- Claude (Desktop and Code), ChatGPT
- Mistral Le Chat, Gemini CLI
- Cursor, VS Code, Windsurf, Zed
- And more — 13 clients documented
Suggestions
Noise Reduction and Search by MeaningBeta
Every event your infrastructure raises is turned into a vector, so alerts can be compared by what they mean rather than by the words they happen to contain. The embedding model is a static one — no GPU, no transformer runtime, a few megabytes of dependency — and it embeds well over a thousand events per second on a plain CPU.
That makes three questions answerable that a text filter cannot touch: which of my alerts are the same alert repeating, has anything like this been seen before, and what would it take to make this noise stop.
- Silence suggestions
Bleemeo clusters your recurring events and proposes the silence that would mute them, showing the pattern it found, a representative event you can open, and how many events it covers. Accepting one opens a prefilled creation form — the platform proposes, you decide, and nothing is ever applied on your behalf.
- Flappy configuration suggestions
Metrics that repeatedly switch state get a proposed flappy configuration that groups their notifications instead of sending one per flip. Same shape: a suggestion, a representative event, a prefilled form.
- Search your events by meaning
Search returns exact matches first, then the events that mean the same thing ranked by relevance — so a search for "disk full" also finds the alert someone worded as "no space left on device".
- "Have we seen this before?"
Any event gets a tab listing its nearest historical neighbours. That is the question a new team member cannot answer from a runbook, and the one that turns a 2 AM page into a five-minute fix.
- Beta, and off by default
These features are an account-scoped opt-in, disabled on every plan until you ask for them. Ask us to enable them on your account and the Suggestions drawer appears on the home and silences pages.
Outcomes
Why AI Monitoring Helps Your Team
The real value of AI in monitoring is not the technology itself — it is the operational transformation it enables. Teams using Bleemeo's AI features consistently report fewer middle-of-the-night pages, shorter incident resolution times, and more effective capacity planning. Here is how each capability translates into concrete business outcomes.
Smarter, quieter alerts
Anomaly detection eliminates the guesswork of threshold tuning. Every SRE team has spent hours debating whether CPU alert should fire at 85% or 90%, only to have both values generate noise during predictable peaks. With AI-driven bounds, those debates disappear. The model learns that 95% CPU at 2 AM during the nightly ETL job is normal, while 75% CPU at noon on a Tuesday is unusual. Your team responds to the alerts that matter and ignores the ones that do not, without touching a single threshold configuration.
Plan ahead, not in panic
Capacity forecasting turns reactive scrambling into planned maintenance. The cost of a disk-full outage is not just the downtime — it includes data recovery, transaction replay, customer impact, and the post-mortem. Bleemeo turns that into a scheduled task. When you know a volume will reach capacity on March 15th, or that a service has been leaking memory for a week, you can order storage, schedule expansion, or ship a fix — during business hours, with zero customer impact.
Monitoring for everyone
The MCP server makes monitoring accessible to everyone on the team. Not everyone on a team speaks PromQL or knows where to find the right dashboard during an incident. With conversational access to monitoring data, a product manager can check service health, a developer can investigate deployment impact, and an on-call engineer can triage alerts — all using natural language. This democratizes operational intelligence without requiring everyone to become a monitoring expert.
Want to go further? Learn how to configure the MCP server with your AI assistant, understand anomaly detection thresholds, and set up disk full prediction alerts.
Read the DocumentationFrequently Asked Questions
Everything you need to know about Bleemeo's AI and machine learning features
What AI and machine learning features does Bleemeo offer?
Three: anomaly detection built on a time-series foundation model, predictive capacity planning that projects disk, memory and swap to a date, and an MCP server that lets AI assistants like Claude, ChatGPT, Le Chat, Cursor and VS Code query your monitoring data. None of them asks you to configure a threshold or train a model.
How does Bleemeo's anomaly detection work?
Bleemeo learns the daily and weekly rhythm of CPU, memory and swap on each server from the last two weeks and predicts the range they should stay in for the next 24 hours. An anomaly opens when the hourly average leaves that range for two hours in a row, and closes after two hours back inside. Detection starts once a metric has eight days of history and skips servers with less than 1 GB of RAM. The forecast is refreshed every four hours.
How far in advance can Bleemeo predict that a disk or memory will run out?
Bleemeo fits a trend to disk, memory, swap and monthly bandwidth usage and projects the date each will reach warning (80%), critical (90%) and full (100%). Depending on the growth rate that ranges from days to months ahead, with a specific timestamp per threshold. A date is only announced when the drift behind it held across two independent windows, so a one-off jump is not reported as a trend.
What is the Bleemeo MCP server?
The Bleemeo MCP server implements the Model Context Protocol, allowing AI assistants to query your monitoring data using natural language. It provides 30+ read-only tools covering agents, services, containers, events, logs, and audit trails. Authentication uses OAuth, and all access is strictly read-only for security.
Which AI assistants are compatible with the MCP server?
The Bleemeo MCP server works with Claude (Desktop and Code), ChatGPT, Le Chat, from French company Mistral AI, Gemini CLI, Cursor, VS Code, Windsurf, Zed and more — 13 clients documented.
Is the MCP server access read-only?
Yes, the Bleemeo MCP server is entirely read-only. It can query and retrieve data — metrics, alerts, logs, events, configurations, and audit trails — but it cannot create, modify, or delete any resources on your Bleemeo account. This design ensures your infrastructure remains completely safe while enabling powerful AI-driven analysis.
Do I need to configure anything for anomaly detection?
No. There is no threshold to pick and no model to train. Bleemeo enrols CPU, memory and swap on every eligible server, refreshes the forecast every four hours and opens an anomaly on its own. The only input it asks for is optional: marking an anomaly useful or not, which pauses detection on a metric that keeps raising false alarms.
What machine learning models does Bleemeo use?
Two complementary models. Amazon Chronos-Bolt, a time-series foundation model used zero-shot — applied as published, never fine-tuned on customer data — returns the expected range as quantiles. A verified linear trend handles capacity, projecting usage to a date and announcing it only when the drift actually held. Chronos-Bolt runs on CPU in about 6 milliseconds per forecast.
How does AI-powered monitoring reduce alert fatigue?
Traditional threshold-based alerts fire on fixed values that ignore normal variations. Bleemeo's AI learns your infrastructure's actual patterns — daily cycles, weekly trends, seasonal changes — and only alerts when behavior genuinely deviates from the predicted range. This eliminates false positives from expected load spikes, nightly jobs, and routine batch processing.
Which Bleemeo plans include AI and ML features?
The MCP server is available on Free, Starter, and Professional plans. Anomaly detection and predictive capacity planning are available on Starter and Professional plans. All features work automatically without additional configuration, setup, or extra costs beyond the plan subscription.