Dashglass:Prometheus dashboards, in one Go binary.
One Go binary, no database, nothing else to deploy — the dashboard part of Grafana, and only that.
Built by Bleemeo on the same charting and PromQL components as our own monitoring panel. Edit in the browser, review the diff in git.
Quick start
Point it at a Prometheus and open a browser
Run the published image against your own Prometheus.
docker run -p 8080:8080 -v "$(pwd)/dashboards:/dashboards" \
  ghcr.io/bleemeo/dashglass -prometheus-url http://your-prometheus:9090
Then open http://localhost:8080. Dashboards are plain files in the mounted directory — put that directory under git and you have GitOps. Images are tagged latest and per release (CalVer, e.g. 2026.07.25.120000); a moving snapshot tag tracks the main branch and may break.
Starting from an empty instance? The home screen offers one-click example dashboards — "Prometheus overview" and "Prometheus internals" — built only from the metrics Prometheus exposes about itself, so they show real data on any install.
Prefer a single binary? Prebuilt builds for Linux, macOS and Windows are attached to every release:
./dashglass -prometheus-url http://localhost:9090 -dashboards-dir ./dashboardsNo Prometheus at hand? The repository ships a Compose demo with a Prometheus scraping itself, so the example dashboards have real data:
git clone https://github.com/bleemeo/dashglass && cd dashglass
docker compose up
One thing to know before you expose it: a fresh instance starts with authentication disabled, so anyone who can reach it is an anonymous admin — a banner in the UI says so. Create the first user from Admin → Users to switch everyone to signing in, or set DASHGLASS_BOOTSTRAP_ADMIN_PASSWORD for an automated deploy.
The app
A dashboard grid, a PromQL editor, and a kiosk mode
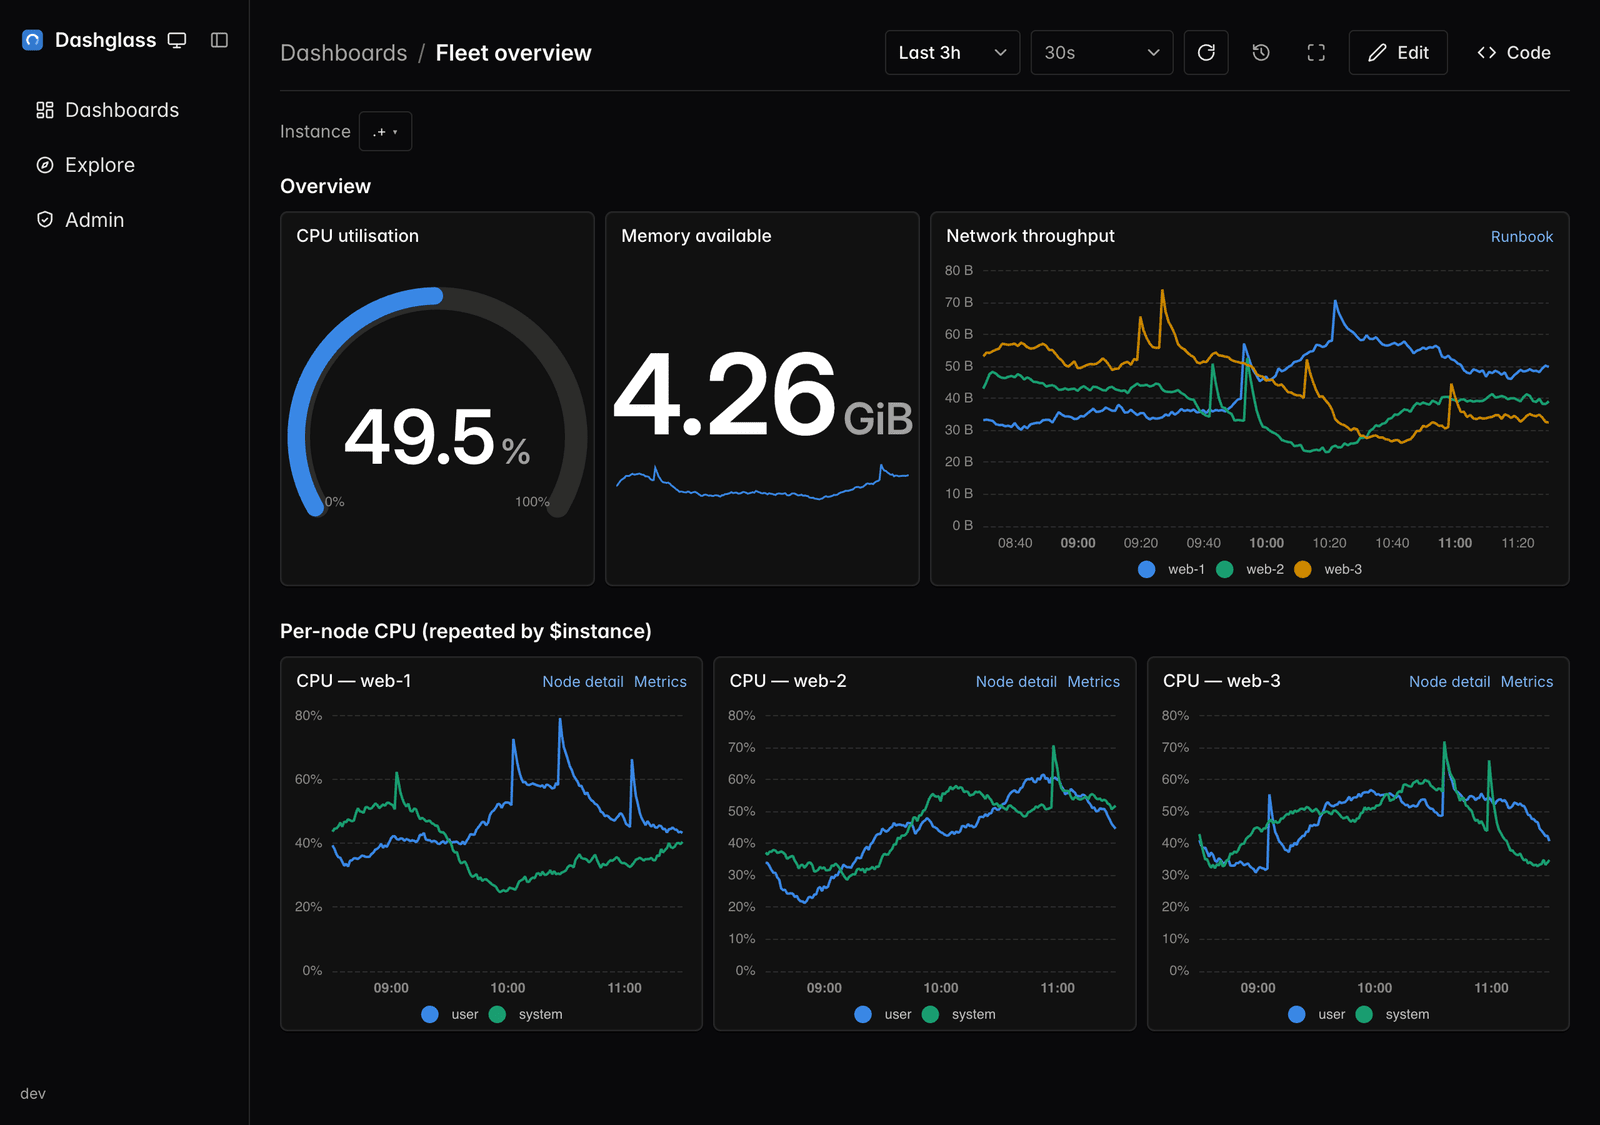
A 24-column grid with sections, undo/redo and a live preview that uses your real variables and time range. Panels repeat across the values of a variable, data links carry the current variables and time range to another dashboard or an external tool, and every chart supports zoom and brush. Light and dark themes, plus a kiosk mode for wall screens.
What it does
Build, connect, version
Dashboards are edited in the UI and stay plain files you can put under git. Queries never leave the backend. That is the whole design.
Build
- Time series, stat, gauge, table, bar, heatmap, status grid, markdown, image and clock panels, with units and thresholds.
- PromQL editor with live autocompletion and linting, backed by the Prometheus API.
- Variables, including chained ones where a list depends on another.
- Panel repeat by variable: one definition, one tile per instance.
- Data links and drill-down carrying the current variables and $__from / $__to.
- Two editors: a visual grid, and an as-code view of the raw file validated on save.
- Explore mode for ad-hoc queries, plus a kiosk mode and light and dark themes.
Connect
- The browser never talks to Prometheus: every query goes through a read-only backend proxy.
- Credentials stay server-side — basic auth or a bearer token, never in the page.
- Extra headers for Mimir/Cortex tenancy (X-Scope-OrgID) or a custom Authorization scheme.
- Custom CA for a private-CA endpoint, and client certificate + key for mTLS.
- Test connection probes TLS, headers and credentials before anything is saved.
- Provision the datasource in dashglass.yaml, or configure it at runtime from Admin.
Version
- Deterministic JSON, YAML or TOML serialization — a one-field edit produces a one-line diff.
- Git history in the UI: browse the commits touching a dashboard, diff them, restore one.
- Commit-on-save, authored by the signed-in user, so git blame stays honest.
- Remote sync pulls on an interval and pushes after a commit, rebasing a diverged history.
- File watch with live reload over SSE: edit a file on disk and the open dashboard follows.
- Provisioned mode (-readonly) refuses every write, admins included.
- dashglass lint validates dashboard files, so a broken dashboard fails in CI, not in a browser.
Run it
One artifact, however you deploy
The SPA is embedded in the Go binary, so there is nothing else to serve.
Docker
The quick start command above, from ghcr.io/bleemeo/dashglass. Tags follow CalVer per release, plus latest and a moving snapshot.
Single binary
Prebuilt binaries for Linux, macOS and Windows are attached to each release. One static file — only the git history features want anything else, namely the git binary on PATH.
Compose demo
A docker compose up in a clone gives you Dashglass plus a Prometheus scraping itself, so the example dashboards show real data.
From source
pnpm install, then pnpm build-binary produces the single binary with the SPA embedded. The contributing guide covers the dev loop.
Documentation:User guideAnnotated configurationDesign document
Migration
Coming from Grafana
Import what you already have, and see exactly what changed.
From grafana.com
Paste a dashboard URL or its numeric id and press Load. The backend accepts only a numeric id and only talks to grafana.com, which rules out SSRF.
From a JSON export
Paste or upload the Share → Export JSON from Grafana. Conversion runs in the browser.
Best-effort, and explicit about it
Common panels, rows into sections, PromQL targets, templating and label_values variables are converted. Anything unmapped is imported as-is rather than dropped, and every approximation is listed before you save.
Scope
What Dashglass is not
These are non-goals in the design document, not gaps waiting to be filled.
- Not an alerting system. No alert rules, no notification channels, no incident management. Dashglass draws what your Prometheus already knows; paging people is not its job — that belongs to Alertmanager, or to a platform that does it for you.
- Not a multi-datasource platform. Prometheus only. The data source layer is an interface, so another one is possible later, but SQL, Loki and traces are explicitly out of scope today. Mimir and Cortex work, through the tenancy header.
- Not multi-tenant. Three fixed roles — viewer, editor, admin — with local users, reverse-proxy headers or OIDC. No per-dashboard ACLs, no teams, no organizations. Self-hosted users get real roles; fine-grained and multi-tenant is where the line is drawn.
- Not a plugin marketplace. Panels are plugins, but they are composed at build time. There is no runtime loading of third-party plugins, and no marketplace to browse.
Questions we get about Dashglass
Where it fits, and where it deliberately stops.
Is it a Grafana replacement?
For the dashboard part, that is exactly the intent — and it imports what you already built. For anything else, no: alerting, non-Prometheus data sources and a plugin ecosystem are deliberate non-goals. If you need those, keep Grafana.
Which data sources are supported?
Prometheus, and anything that speaks its HTTP API — including Mimir and Cortex, where the tenancy header goes in the datasource configuration. SQL, Loki and traces are out of scope.
Can the browser reach my Prometheus directly?
It never does. Every query goes through a read-only proxy in the Go backend, so the URL, the credentials, the CA and the client certificate all stay server-side and never reach the page.
Can dashboards be provisioned and locked?
Yes. Start with -readonly (or dashboards.readonly: true) and the API refuses writes while the UI drops every edit affordance — admins included. The dashboards are then managed entirely by editing the files in git.
How does authentication work?
A fresh instance is open on purpose: until the first user exists, everyone is an anonymous admin, and a banner says so. Create the first admin to switch everyone to signing in. From there: local users with three cumulative roles, reverse-proxy header authentication, or OIDC with authorization code + PKCE and group-to-role mapping. LDAP is planned, not shipped.
Do I need git to use it?
No. Dashboards are files; git is what makes those files reviewable. The History features need the dashboards directory to be a git work tree and the git binary on PATH — without either, everything else still works and those features simply do not appear. Turn the directory into a repository whenever you are ready.
Built on tools you already trust
Dashglass ships several open source projects as libraries: Apache ECharts for the charts, the official Prometheus CodeMirror PromQL package for editing and autocompletion, react-grid-layout for the dashboard grid, Zod for the dashboard schema and file validation, Chakra UI and React on the front end, and Go with an embedded SPA for the single artifact you deploy.