Which Redis metrics predict an incident — memory, eviction, hit ratio, persistence, replication — what a bad value looks like, and how to collect them.
Bleemeo announces the release of a new monitoring agent written in Go: Glouton! It combines Telegraf, Prometheus node exporter, Nagios NRPE in a single binary.
A host at 70% CPU names no culprit. Per-process CPU, memory, I/O and restarts turn 'the server is busy' into 'this service is leaking', with what to alert on.
Connection ceilings, InnoDB buffer pool pressure, disk temp tables and why Seconds_Behind_Source can read zero on broken replication — with how to collect it.
Apache does not slow down when it runs out of workers, it queues. Busy workers, the scoreboard, and why prefork and event fail in completely different ways.
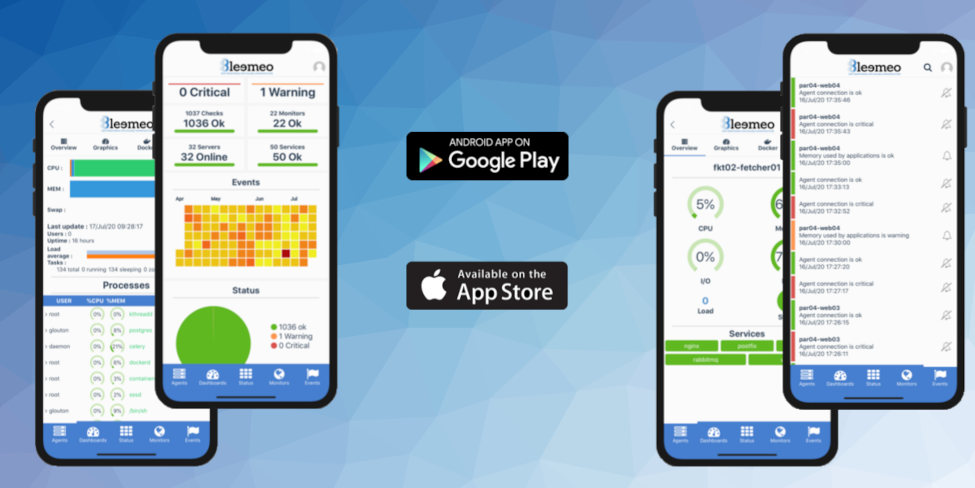
Bleemeo released a new version of its mobile application, available on Android and now on iOS! Servers, containers, and applications monitoring goes mobile.
Observability tips, Prometheus & OpenTelemetry deep-dives, Bleemeo product updates, and field lessons from real infrastructure teams. One issue per quarter.
Check your inbox
We have sent you a confirmation email. Click the link in it within 3 days to start receiving the newsletter.