Dashboards answer the questions you knew you would ask. The other kind — “is it only this server, or all of them?”, “since when?”, “what does memory look like on the ones that restarted?” — used to start with creating a dashboard, adding a widget, picking a metric, and deleting the whole thing afterwards.
Bleemeo now has a page for those questions. It is called Metrics: you write a PromQL query, run it, and look at the answer. When an exploration turns out to be worth keeping, a library of ready-made recording rules is there to turn it into a metric you can chart and alert on.
Ask, run, look
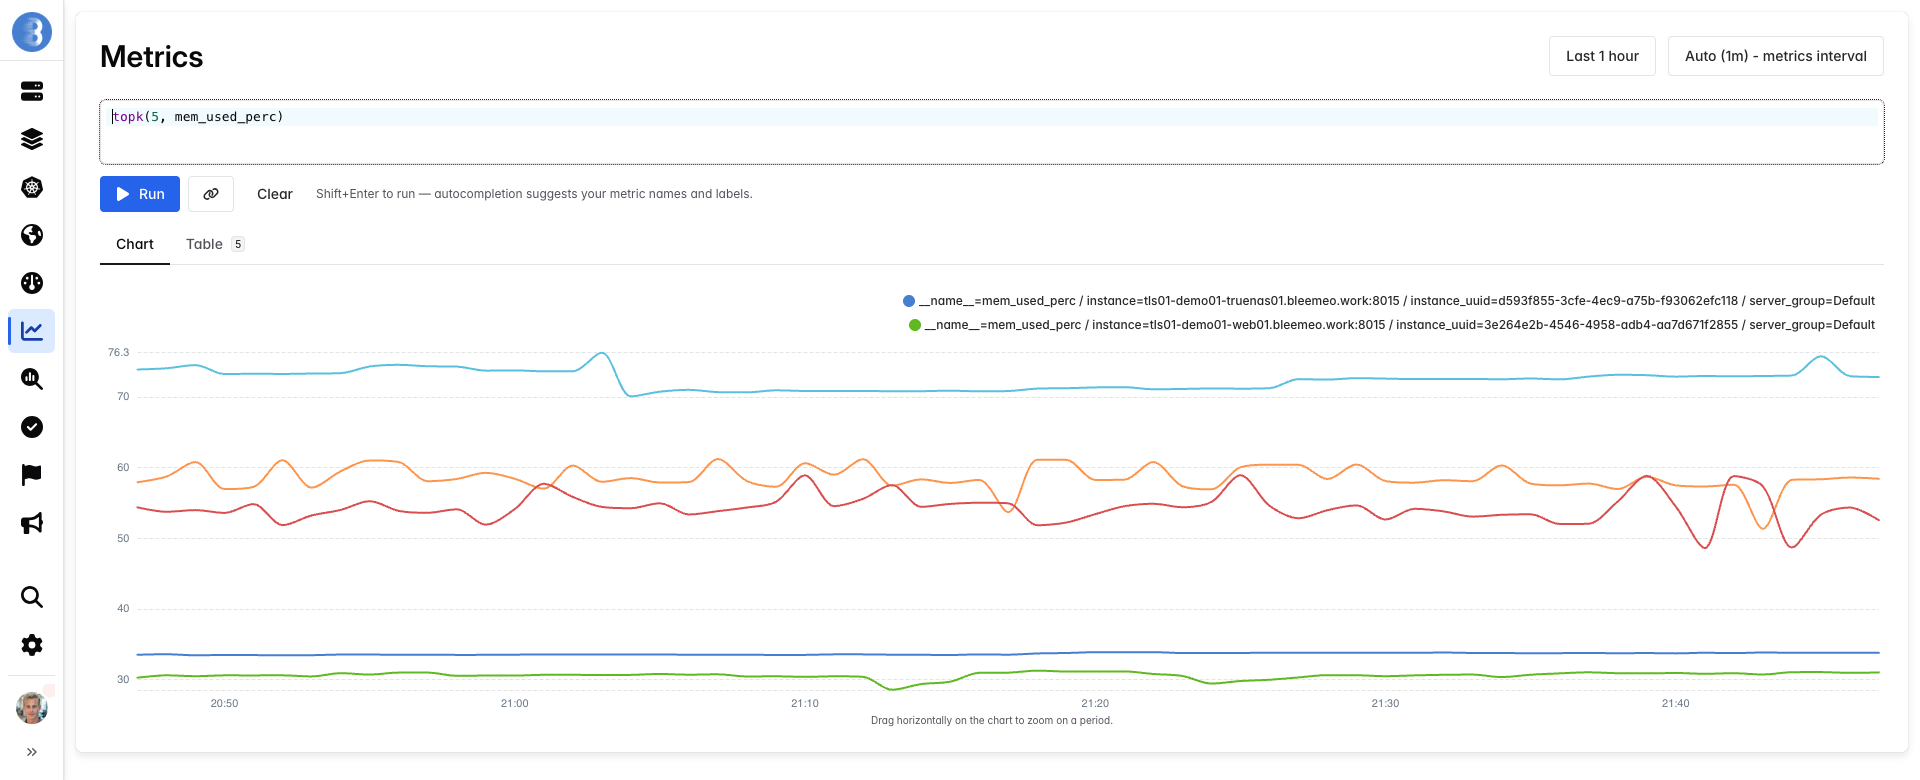
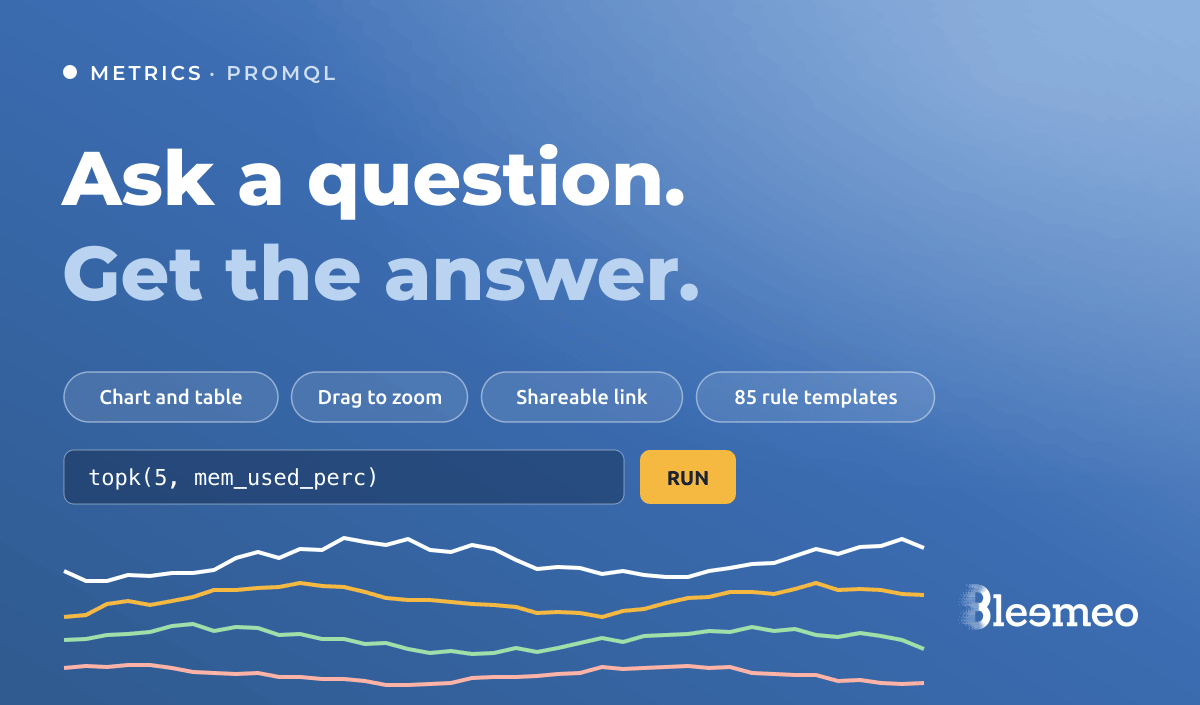
The page is deliberately plain: a query editor with autocompletion on your own metric names and labels, a Run button (or Shift+Enter), and two views of the result.
- Chart. The same renderer as your dashboard widgets, so what you see here is what a widget would show. Drag across the chart to zoom on a period.
- Table. Every series returned, with its labels and current value. Above 50 series the chart stops drawing — it would be unreadable — and says so; the table still lists them all.
Your recent queries stay one click away, so an exploration you ran this morning is not lost by the afternoon.
A few queries to start from
If PromQL is not fresh in your mind, these cover most first questions:
# Which five servers use the most memory right now?
topk(5, mem_used_perc)

# Disk reads per second, smoothed over five minutes
rate(io_reads[5m])

# Average CPU across the web servers only
avg(cpu_used{instance=~"web.*"})

# Will a disk fill up in the next four hours, at the last hour's pace?
predict_linear(disk_used_perc[1h], 4 * 3600) > 90
The last one is the kind of query that starts as a question and ends as a rule — which is where templates come in.
From the incident to the explorer
Most explorations start somewhere else: an alert fired, and you want to know whether the metric that crossed the threshold is alone. The event and metric drawers now carry an Open in Metrics explorer button. It opens the page with that metric already in the query, so the next step — widen the filter to the whole fleet, aggregate by a label, compare with another metric — is an edit, not a new search.
When you have found it, Copy a link to this exploration puts the query and the period in the URL. A colleague who opens it lands on the same chart, which is more useful in an incident channel than a screenshot nobody can zoom into.
When an exploration is worth keeping
A query you run every week is a metric waiting to be recorded. Bleemeo’s recording rules evaluate a PromQL expression continuously and store the result as a metric of its own: you can chart it, and with a warning or critical threshold it becomes an alert routed through your usual notification rules.
Writing those rules from a blank editor is where most teams stop. The recording rule form now opens on a library of 85 templates, grouped by what they are for:
- Fleet — server count (alert on a drop to catch a mass outage), fleet average CPU, the five most loaded servers, each server’s load relative to the fleet average, load imbalance across the fleet, and disks predicted to fill within four hours.
- SLO — the service level indicator over five minutes and over the 30-day compliance window, the error budget remaining, the burn rate, and the multi-window fast-burn and slow-burn detectors from the Google SRE workbook.
- Per technology — rules for PostgreSQL, Cassandra, Kafka, HAProxy, NGINX, Redis, containers, AWS services and more, plus a Seasonality & spikes group.
Each template comes with a description of what it measures and when to alert on it, its unit, and parameters for the parts that depend on you — a label filter for the fleet rules, the “good” and “total” series and the target for the SLO ones. Fill them in, check the preview, and the rule is running.
Where it fits
The explorer does not replace dashboards: a dashboard is still the right answer for what you want to see every day. It replaces the throwaway dashboard — the one created to answer a single question and forgotten afterwards. And the templates do not replace knowing PromQL; they replace reconstructing the same burn-rate expression from a blog post every time a team adopts an SLO.
Frequently asked questions
Do I need to know PromQL to use the Metrics page?
It helps, but the editor autocompletes your metric names and labels, and a handful of patterns — topk, avg with a label filter, rate over a window — cover most first questions. The recording rule templates are written for you and only ask for their parameters.
Can I share an exploration with a colleague?
Yes. Copy a link to this exploration puts the query and the period in the URL; anyone with access to the account who opens it sees the same chart.
What is the difference between a recording rule and a dashboard widget?
A widget evaluates its query when you look at it. A recording rule evaluates continuously and stores the result as a metric, so it has history, can carry warning and critical thresholds, and can trigger notifications like any other metric.
Are recording rules available on every plan?
Recording rules are available on the Starter and Professional plans. See the pricing page for what each plan includes.
Try it
The Metrics page is in the sidebar of the panel, and the templates open from New recording rule. If you are not using Bleemeo yet, the Prometheus in the cloud page explains how PromQL fits in the platform, and the 15-day trial includes both.