Most teams that run on Azure do not run only on Azure. There is a database on a VM nobody wants to move, a Kubernetes cluster somewhere else, a few servers in a rack, and a monitoring setup that grew around all of it. Azure Monitor sees the Azure part very well and nothing else, so the picture of an incident ends up split across two consoles, two alerting configurations and two sets of dashboards.
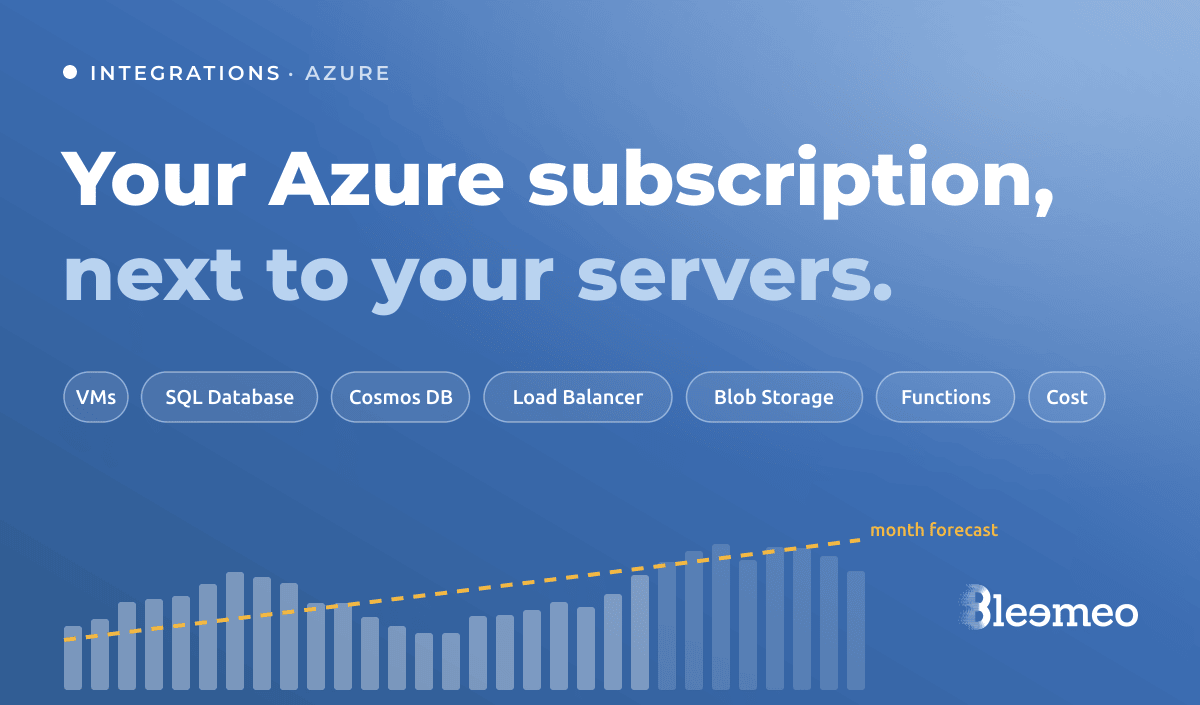
Bleemeo now connects to Azure the same way it already connects to AWS: you point it at a subscription, and the Azure Monitor metrics of your resources land next to your servers, containers and uptime checks — same dashboards, same alerting, same retention.
Three steps, done once
The integration uses a dedicated identity in your tenant, so you stay in control of what it can read and when it stops.
- Create an app registration in Microsoft Entra ID — “Bleemeo Azure Monitoring”, for instance — and a client secret for it.
- Give it the Monitoring Reader role on the subscription you want to
monitor, and check that the
Microsoft.Insightsresource provider is registered on that subscription. - Paste four values into Bleemeo — tenant ID, subscription ID, client ID and client secret — on the Cloud Provider page, then tick the services you want.
Monitoring Reader grants read access only. It is also enough for the cost metrics: it covers the Cost Management read operations, so there is no second role to assign.
One thing to put in your calendar: Azure client secrets expire — the portal defaults to six months and caps them at two years. When the secret expires, collection stops. Rotating it is a matter of creating a new secret on the same app registration and pasting it into the integration; the role assignment does not change.
What gets collected
| Service | What you get | Polling |
|---|---|---|
| Virtual Machine | CPU, memory, disk and network | 1 minute |
| SQL Database | CPU, memory, storage and connections | 1 minute |
| Cosmos DB | Request counts and request unit consumption | 1 minute |
| Load Balancer | Availability, packets, bytes and SNAT connections | 1 minute |
| Blob Storage | Transactions, availability, capacity, object and file counts | 1 hour |
| Function App | Executions, errors, requests and response time | 1 minute |
| Cost metrics | Amortized daily cost, month-to-date cost and monthly forecast | Daily |
Each service gets its own dashboard as soon as resources are discovered, and the resource lists show the same CPU, memory and disk gauges as the server lists. The metrics are ordinary Bleemeo metrics from then on: you can put an Azure SQL database and the application servers that query it on the same dashboard, or alert on a Function App’s error count with the same rules and notification channels as everything else.
Your spend, charted like any other metric
The cost service deserves a word, because it is the one teams tend not to expect from a monitoring tool. Bleemeo reads Azure Cost Management for the subscription and records three values: the amortized daily cost, the month-to-date cost and the forecast for the month.
Once spend is a metric, the usual tools apply. A forecast line on the same dashboard as the resources that drive it makes a scaling decision visible the day it happens rather than on the invoice. And a threshold on the month’s forecast is an alert like any other — routed to the same people, through the same channels, as a disk filling up.
Some Azure offers are excluded from Cost Management by Microsoft — Azure Sponsorship, Azure for Students and CSP subscriptions among them — so the cost service is not available on those, whatever the role.
Choosing what is monitored
Discovery runs across the whole subscription: Bleemeo lists the resources of each enabled service through the Azure Resource Manager APIs, and new resources are monitored as they appear, with nothing to declare one by one.
When a subscription holds more than you want to watch, Azure tags decide:
bleemeo:enable = falsekeeps a resource out — it is never created in Bleemeo;bleemeo:enable = truelocks monitoring on, and the toggle in the panel is disabled;- with neither tag, a resource is monitored by default and can be switched off from the panel.
Because the decision lives in a tag, it travels with your infrastructure as code: a Terraform module can mark a scratch environment as excluded at the moment it creates it.
What this is not
The Azure integration reads Azure Monitor metrics. It does not install anything in your virtual machines. For what only the inside of a machine can tell — per-process figures, the services running on it, application metrics, logs — install the Glouton agent on the VM as on any other server: the two views complement each other, and the VM then shows both.
Azure Monitor API calls can also appear on your Azure bill. Azure includes a free allowance of roughly $10 a month, and Bleemeo batches its queries — up to 50 resources of the same service in the same region per call — so the billable unit is the batch rather than the resource. The configuration page gives the estimate per service.
Frequently asked questions
Which permissions does Bleemeo need on my Azure subscription?
The Monitoring Reader role on the subscription, assigned to an app registration you create for Bleemeo. It is read-only, and it also covers the Cost Management data used by the cost metrics — no second role is needed.
Do I need to install an agent in my Azure VMs?
No. VM metrics come from Azure Monitor, without anything installed in the guest. You can still install the Glouton agent on a VM when you want what only the inside of the machine knows — processes, services, application metrics and logs.
How do I exclude a resource from monitoring?
Tag it bleemeo:enable = false in Azure and it is never created in Bleemeo. bleemeo:enable = true locks monitoring on. Without either tag, monitoring is on by default and can be toggled from the panel.
Which Bleemeo plans include the Azure integration?
Starter and Professional.
Getting started
If you already use Bleemeo, the integration is on the Administration → Cloud Provider page of the panel, and the setup guide walks through the Azure portal screens. If you do not, the Azure monitoring page is a good place to start — and the 15-day trial includes it.