Monitoring Nginx web server with Bleemeo
Configure NGINX monitoring with Bleemeo to automatically collect metrics and configure dashboards to track your web server activity.
Read moreLatest articles, tutorials, and insights about infrastructure monitoring, Kubernetes, Prometheus, and cloud observability.

Configure NGINX monitoring with Bleemeo to automatically collect metrics and configure dashboards to track your web server activity.
Read more
Configure Redis monitoring with Bleemeo to automatically collect metrics and configure dashboards to track your Redis activity.
Read more
In this article, we will show you how to replace your Nagios NRPE with Glouton and how to configure a dashboard on the Bleemeo panel.
Read more
In this article, we will describe infrastructure monitoring best practices and how to start even if you only have a small infrastructure.
Read more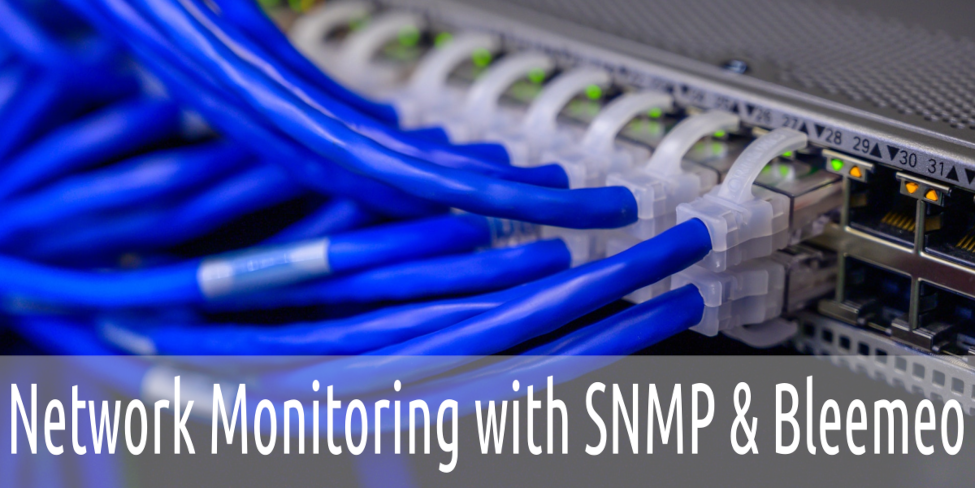
Monitor your network devices (routers, switches, wireless access points, ...) using SNMP with Bleemeo Cloud Monitoring Solution.
Read more
Bleemeo announces the release of a new monitoring agent written in Go: Glouton! It combines Telegraf, Prometheus node exporter, Nagios NRPE in a single binary.
Read more
This article explains how to monitor the service process on your service with Bleemeo using MySQL as an example.
Read more
Configure MySQL monitoring with Bleemeo to automatically collect metrics and configure dashboards to track your database activity.
Read more
Configure Apache monitoring with Bleemeo to automatically collect metrics and configure dashboards to track your web server activity.
Read more