

This blog article will cover how to monitor your nginx web server with Bleemeo, what is monitored and graphed by default and how to go further by configuring custom dashboards to have a global overview of your infrastructure.
What is NGINX?
The NGINX web server was created by Igor Sysoev and was officially released in 2004. Nowadays it is one of the most popular web server on the World Wide Web. Many organizations such as Atlassian, LinkedIn, Apple and Bleemeo use it. It’s an open source web server, maintained by F5 Networks. Nginx architecture choices resulted in a low resources consumption and a very high performance compared to the historic Apache httpd.
Configuring NGINX for Bleemeo
After installing NGINX with your favorite distribution package and installing Bleemeo monitoring agent, Bleemeo will auto-discover nginx presence and start doing ports checks for service availability.

To gather metrics, Bleemeo monitoring agent relies on the mod status of nginx that you need to enable on the default virtualhost (/etc/nginx/sites-enabled/default by default on Debian/Ubuntu). Just add the following lines in the site definition:
location /nginx_status {
    stub_status on;
}
As for every location in NGINX, you can restrict the location to only some IP addresses, to limit the source IP that can query the status. For example, you could do something like this to limit to localhost and the 172.16.0.0/16 network:
location /nginx_status {
    stub_status on;
    allow 127.0.0.1;
    allow 172.16.0.0/16;
    deny all;
}
Check our documentation for more information on this configuration.
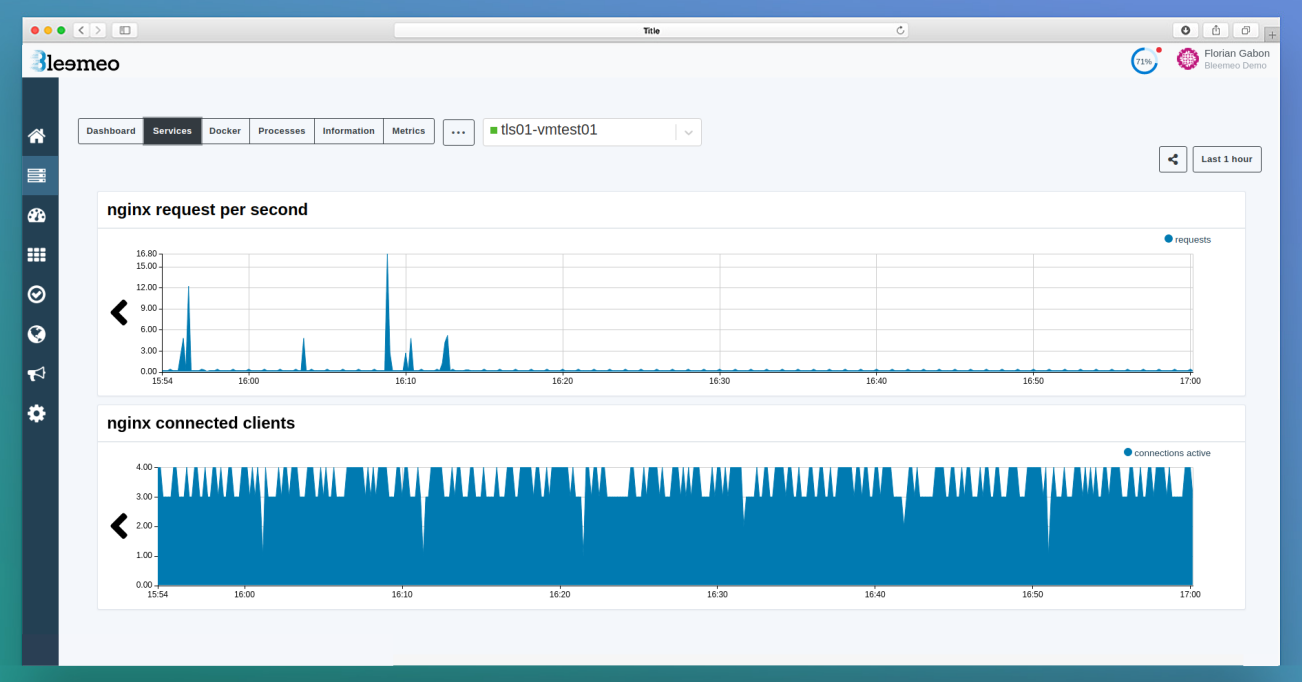
Bleemeo default service dashboard
Once Bleemeo agent has been able to access the NGINX status, a new default dashboard appears, here is an example of such a dashboard:
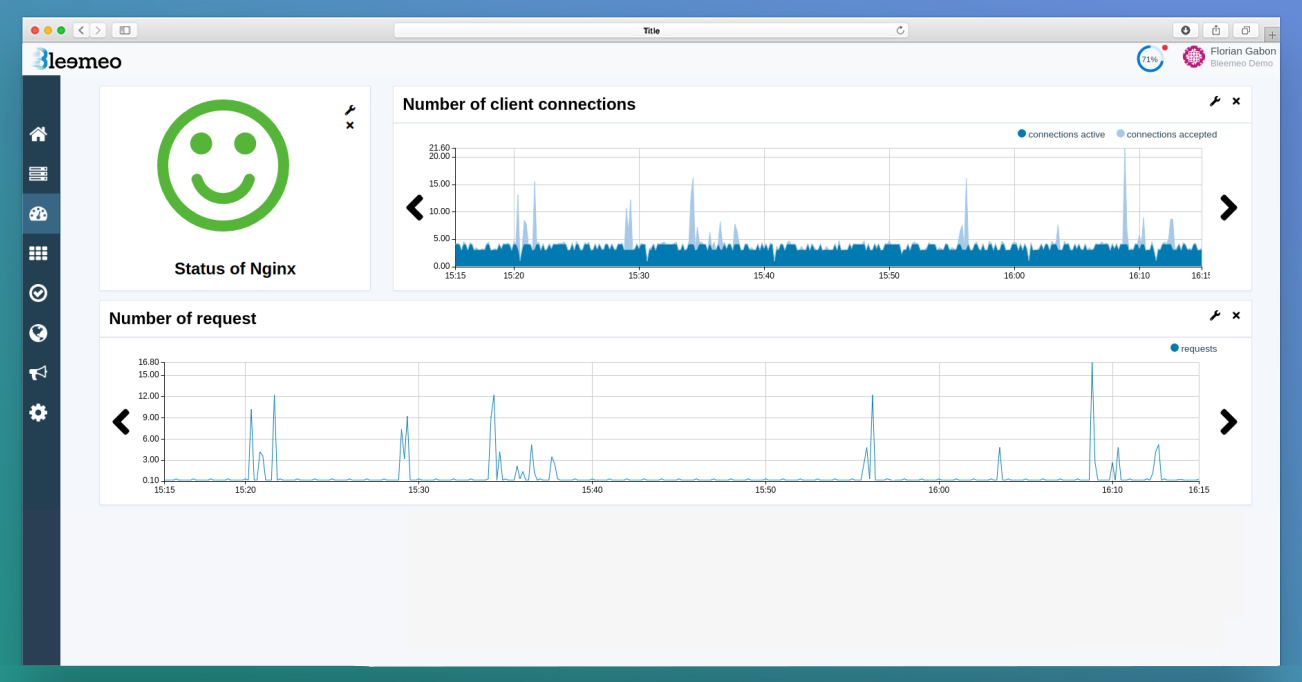
Customizing your dashboard
You can also configure a custom dashboard with metrics that aren’t graphed in the default service dashboard to match your expectations. You could also add to this dashboard business metrics like the number of checkouts or sign up to correlate information. In this example, the following metrics will be graphed:
- Status of NGINX
- Number of requests per second
- Number of client connections established per second
- Number of client connections processed per second
Check our documentation for getting the complete list of metrics available in Bleemeo.
Another example of similar dashboard adding system metrics to correlate system metrics with your http traffic. You can add any metrics supported by Bleemeo. It is possible to add metrics from another agent. In this second example the following metrics will be added to our previous dashboard:
- CPU
- Memory
- Number of packets sent per second.
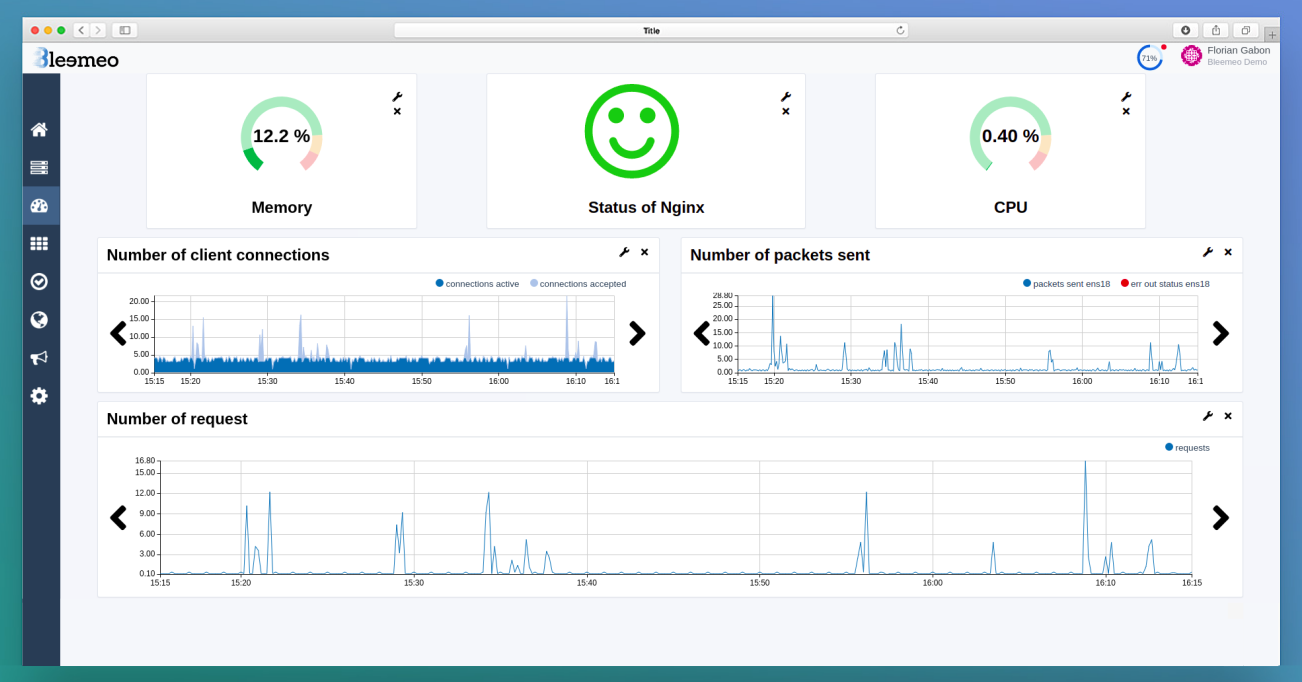
This dashboard can be customized as needed.
Monitoring NGINX web server and creating custom dashboards only take a couple of minutes with Bleemeo.