

When Apache runs out of workers it does not get slower in a way you can see. It stops accepting requests, they queue in the kernel’s TCP backlog, and users experience a page that hangs and eventually times out. Apache itself reports nothing unusual: every worker it has is busy, which is what busy means.
So the number that matters is not requests per second. It is how close busy workers are to the maximum, and — because it changes what that maximum can possibly be — which MPM you are running.
What Apache is, briefly
The Apache HTTP Server, released in 1995 and maintained by the Apache Software Foundation, is still one of the most deployed web servers on the internet. It is cross-platform, though the overwhelming majority of instances run on Linux.
Unlike nginx, Apache’s concurrency model is configurable, and that choice dominates everything about how it behaves under load — and therefore about what you should watch.
First, know which MPM you are running
Apache’s Multi-Processing Module decides what a “worker” actually is. Check with
apachectl -V | grep MPM, because the answer changes how every number below
should be read.
prefork— one process per connection, no threads. Memory-bound: your real ceiling isMaxRequestWorkers× the resident size of one process. Withmod_phploaded, that is often 40–80 MB each, so 256 workers wants 10–20 GB of RAM. Configure more workers than fit and the host swaps, which is far worse than queueing.worker— threads inside a few processes. Much cheaper per connection.event— likeworker, but it hands idle keepalive connections off to a dedicated listener instead of pinning a thread to each. This is the default on modern distributions and the one to want, unless a non-thread-safe module (classicallymod_php) forces you back to prefork.
The practical consequence: on prefork, one slow client with an open keepalive
connection occupies an entire process doing nothing. A few hundred of those and
you are out of capacity while the CPU sits idle. That single fact is why event
exists, and why “Apache is slow” and “Apache is out of workers” are different
problems with different fixes.
The metrics that matter
Busy and idle workers
mod_status reports busy workers and idle workers. Watch busy as a share of
MaxRequestWorkers — not the absolute number, which means nothing without the
limit next to it.
Under about 70% you have headroom. Sustained above 90% and you are one traffic
bump from queueing. At 100%, new connections sit in the listen backlog until
ListenBacklog fills, after which the kernel refuses them outright.
The reason this is worth alerting on rather than graphing is that it has no other symptom. CPU may be low. Memory may be fine. The application is not erroring. Requests simply take forever, and nothing in Apache’s own numbers says why unless you are looking at this one.
Note the naming: the directive was MaxClients before Apache 2.4 and is
MaxRequestWorkers from 2.4 onward. A great deal of tuning advice on the
internet predates the rename.
The scoreboard
mod_status publishes a per-worker state string. The letters worth knowing:
_ |
Waiting for a connection — this is idle capacity |
R |
Reading the request |
W |
Sending the reply (for a proxy, this includes waiting on the backend) |
K |
Keepalive, connection open with no request in flight |
C |
Closing |
G |
Gracefully finishing after a reload |
L |
Writing to the log |
The distribution is the diagnosis. Lots of W means requests are in flight and
slow — look at your application. Lots of K means keepalive connections are
holding workers: on event that is exactly what should happen, and on prefork
it is a capacity emergency, fixed by lowering KeepAliveTimeout or, better, by
moving to event. A pile of G long after a reload means old workers are not
retiring, usually because long-lived requests are still running on them.
Throughput, for the dashboard
With extended status enabled, mod_status also gives total accesses, total bytes
served, requests per second, bytes per second and bytes per request. In Apache
2.4, loading mod_status turns extended status on by default; older versions
need ExtendedStatus On explicitly.
These belong on a dashboard and nowhere near your alerting rules. Bytes per request is quietly the most useful of them: a sudden jump usually means a caching layer stopped working and you are serving full pages where you were serving 304s.
What mod_status will not tell you
Same limitation as nginx’s status module, and worth being explicit about: no
status codes, no latency distribution, no per-vhost breakdown. A backend
returning 500 to every request produces a perfectly ordinary mod_status page.
For those, the access log is the source — %>s for the status and %D for the
request duration in microseconds.
Collecting it with Bleemeo
Once the agent is installed, it needs access to Apache’s status module.

On Debian and Ubuntu this is usually enabled already; if not:
sudo a2enmod statusRestrict the endpoint. A /server-status page reachable from the internet
publishes your traffic volumes, your vhost names and, in the extended
scoreboard, the URL each worker is currently serving:
<Location "/server-status">
    SetHandler server-status
    Require local
</Location>
Require local covers the agent, which queries over the loopback interface.
The service dashboard you get for free
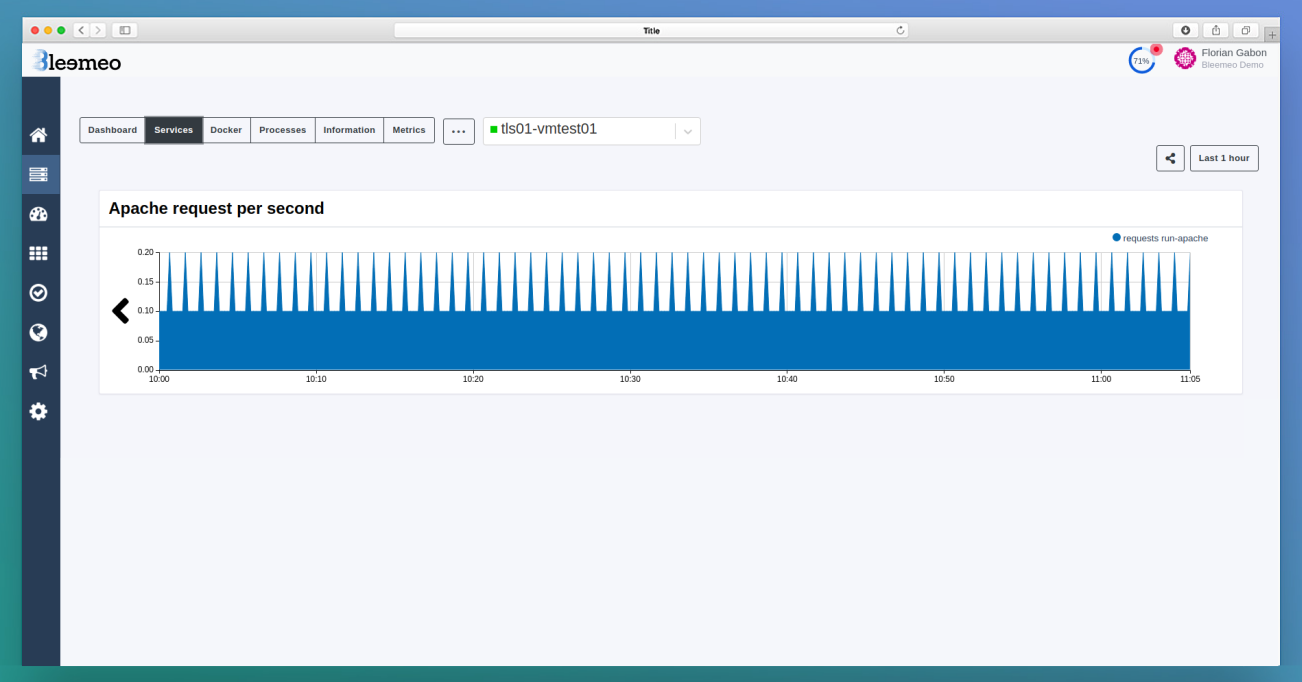
Once the agent can reach the status module, a default dashboard appears:
Building the dashboard you actually want
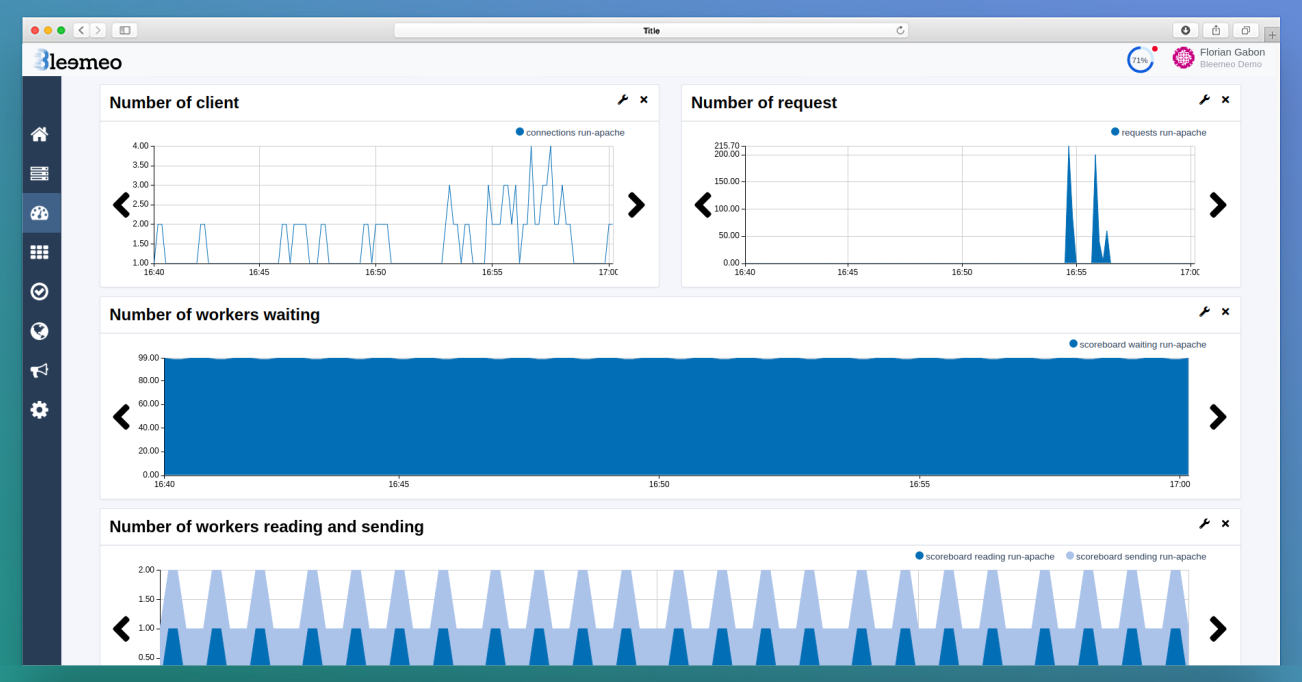
A custom dashboard for the rest. The example graphs:
- Number of client connections to the Apache server
- Number of requests per second
- Number of workers waiting for an incoming request
- Number of workers processing a request, and workers reading a request
Those last two are the scoreboard, split up. Graph waiting workers and busy workers together and the moment idle capacity reaches zero is unmissable. The complete metric list is in the documentation.
You can add anything else Bleemeo collects. For a containerised Apache:
- Status of the Apache container
- CPU used by the Apache container
- Memory used by the Apache container
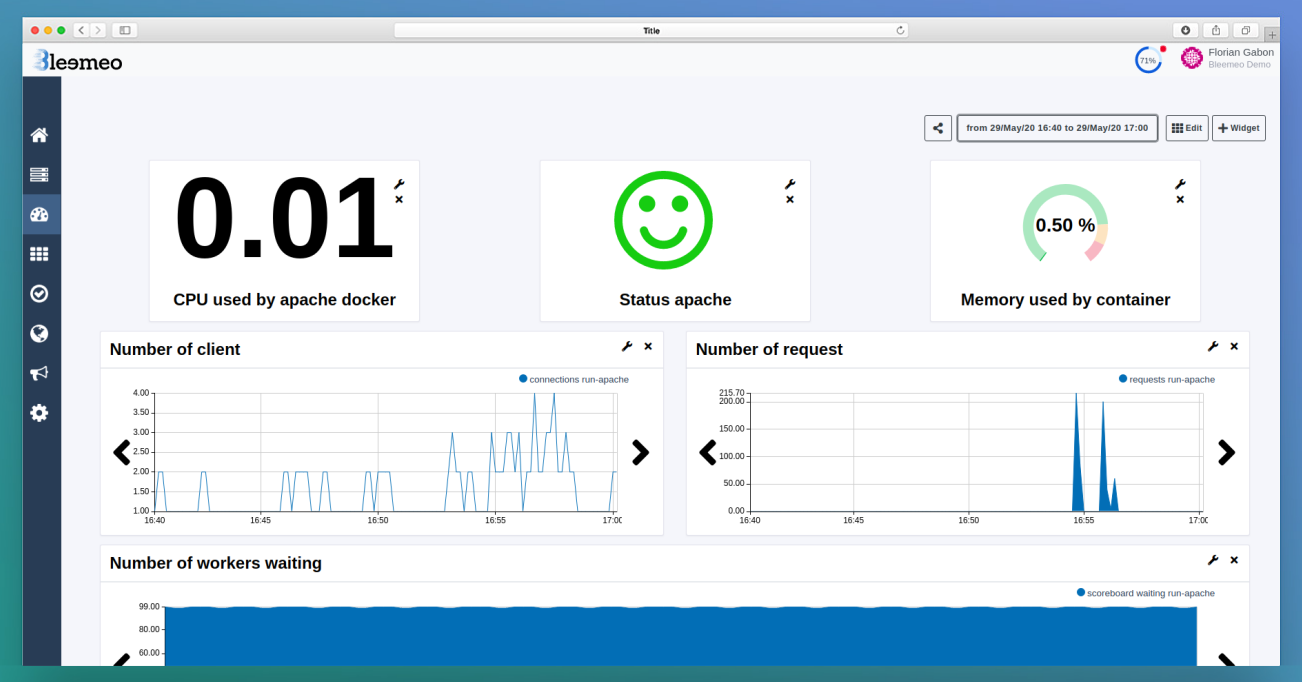
Memory on the same screen as busy workers is the pairing that matters on prefork, because that is the trade-off you are actually managing: every extra worker is more RAM, and running out of either one takes the site down.
Which of these deserve an alert
| Alert on | Why |
|---|---|
Busy workers above 80% of MaxRequestWorkers |
At 100% requests queue and Apache still looks healthy |
| Idle workers at zero | The same fact, from the other side, and easier to graph |
| Apache process or port down | Still the most common incident |
Scoreboard dominated by K on prefork |
Keepalive is consuming your capacity |
| Host memory high on prefork | The worker ceiling and the memory ceiling are the same constraint |
| 5xx rate from the access log | mod_status will never show it |
Requests per second stays on the dashboard. It describes your traffic, and an idle Saturday looks identical to a broken upstream.
Apache monitoring FAQ
What happens when Apache runs out of workers?
New connections wait in the kernel's listen backlog until ListenBacklog is full, after which they are refused. Users see requests that hang and then time out, while Apache reports every worker busy — which is accurate and gives no hint that it is the problem. It is the main reason to alert on busy workers as a share of MaxRequestWorkers rather than graph them.
Which MPM should I be running?
event, unless a non-thread-safe module forces otherwise — classically mod_php, which is why so many installations are still on prefork. The difference is not academic: on prefork a worker is a whole process and one slow keepalive client occupies it entirely, so your ceiling is memory rather than CPU. Check with apachectl -V | grep MPM.
My scoreboard is full of K. Is that bad?
It depends entirely on the MPM. On event it is what should happen — idle keepalive connections are handed to a listener instead of pinning a thread. On prefork each of those letters is a whole process doing nothing, so a scoreboard full of K means you are out of capacity with an idle CPU. Lower KeepAliveTimeout as a stopgap, move to event as the fix.
Why does the tuning advice I find mention MaxClients?
Because it predates Apache 2.4, where the directive was renamed MaxRequestWorkers. The concept is unchanged. Configuration using the old name still works through a compatibility alias, but a lot of surrounding advice from that era assumes prefork and a very different memory footprint per worker.