

This article explains how to monitor service process on your service with Bleemeo, using MySQL as an example. This feature is what we called “Key Process Monitoring” and is described by our documentation. Currently, you can monitor any service process automatically discovered by Bleemeo.
All metrics are detailed in our documentation, in a few words, metrics related to memory, CPU, network and i/o used by this process are gathered by the agent. If you have a critical service on your server, this kind of metrics can be useful to measure the performance of this process and troubleshoot any issue.
How to configure Key process monitoring?
Our Open Source agent automatically detects more than 60 services and creates associated metrics automatically. There is nothing to do!
This blog post uses MySQL process monitoring as an example. In addition to MySQL service metrics, memory, CPU, network and i/o usage metrics will be created. For service metrics, bleemeo agent connect to the MySQL service to fetch metrics. On most Linux distributions, system account is used and there is nothing to configure:

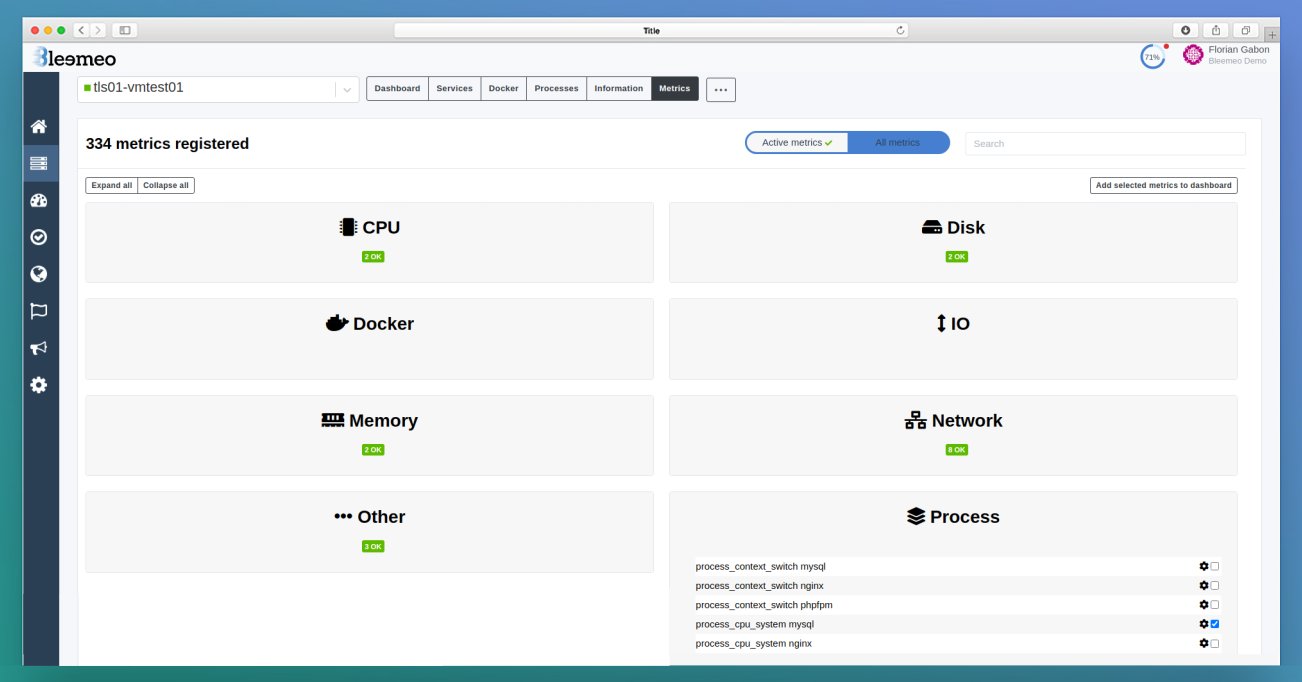
Key Process Monitoring metrics are shown in the agent metrics tab in the process section as shown in the screenshot above:
Create a custom dashboard
The Key Process Monitoring metrics are not graphed by default. It’s up to the user to create a custom dashboard in Bleemeo to graph those metrics if he needs to. Here is an example of a custom dashboard with the following key process monitoring metrics:
- Memory used by MySQL in bytes.
- Status of MySQL
- CPU used by MySQL
- Io read used by MySQL in bytes
- Io write used by MySQL in bytes
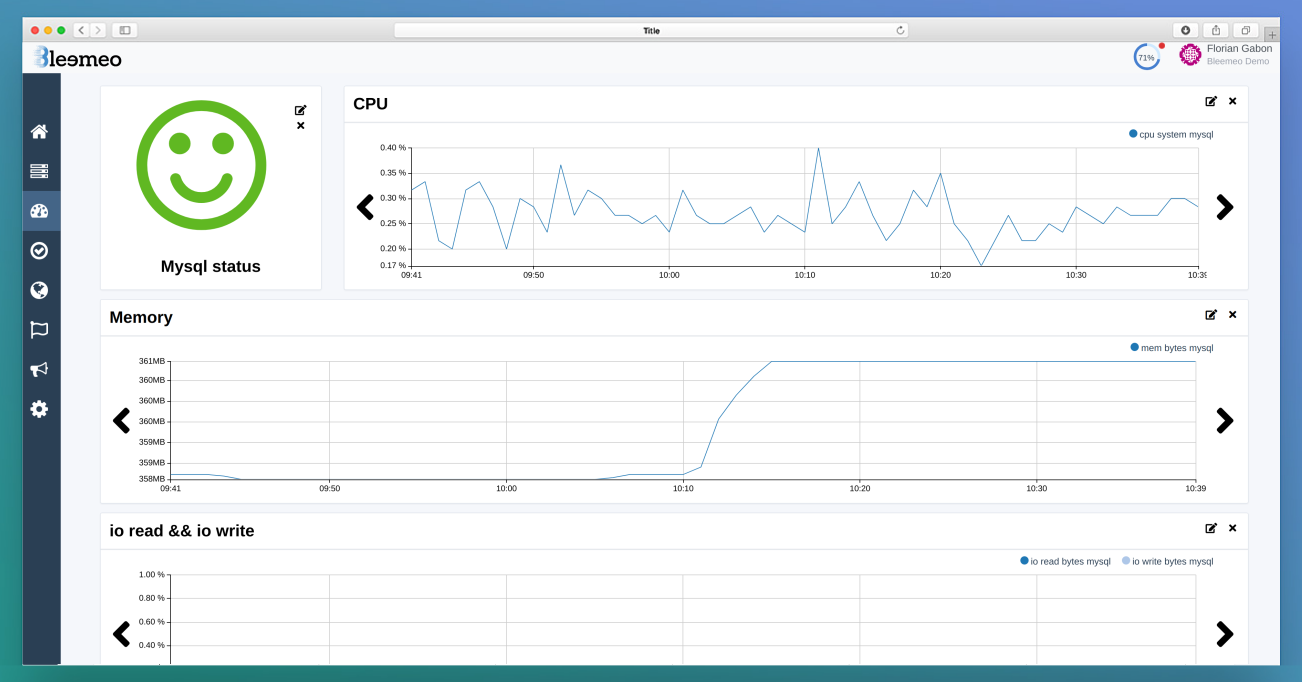
This type of dashboard covers all metrics of a service: usage metrics (requests) and resources metrics (CPU, memory, i/o) and allows to diagnose issue or have a better understanding of the behaviour of this specific service.
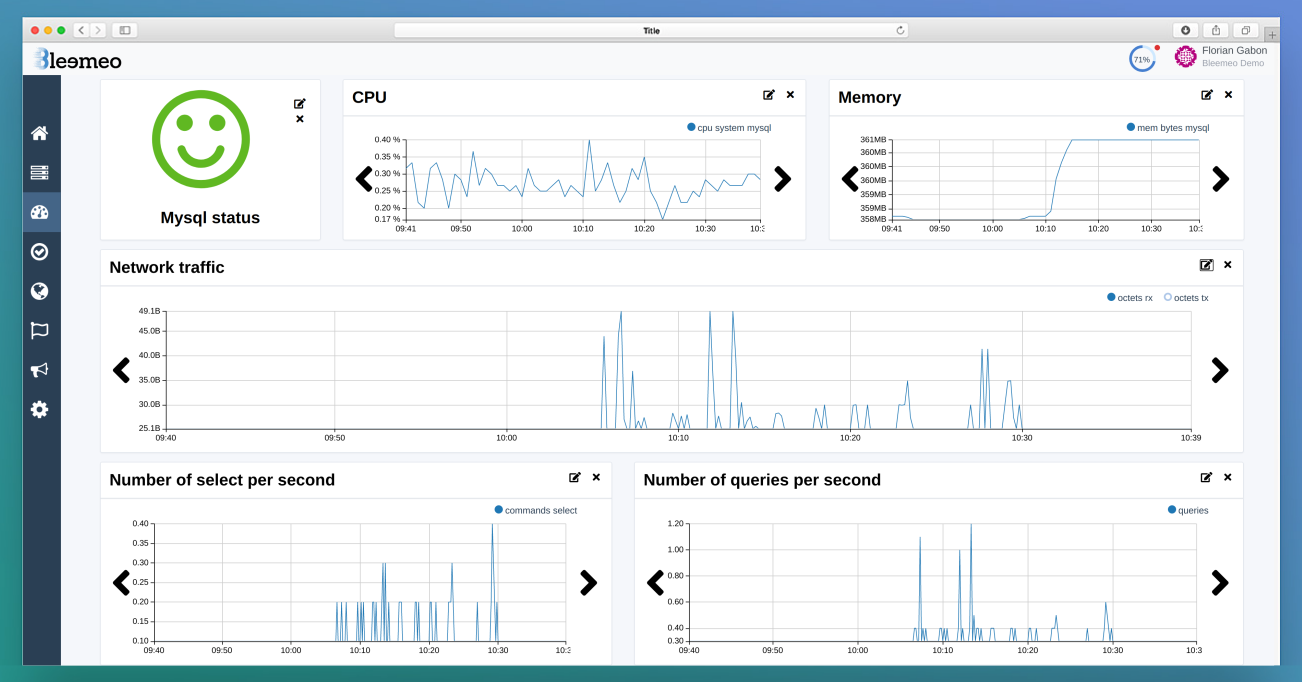
Here is another example of mixing Key Process Monitoring metrics with more classical service metrics:
- Number of queries per second
- Number of select per second.
- Network traffic received from clients in bytes per second
- Network traffic sent to clients in bytes per second
With Bleemeo, you can start monitoring your key process and building custom dashboards within minutes.