
There is a specific way MySQL monitoring goes wrong: the replication lag graph reads zero,
everything looks healthy, and the replica has not received a byte in six hours. It is not a
bug in your dashboard — it is what Seconds_Behind_Source reports when the wrong thread has
died.
This guide covers the MySQL and MariaDB counters worth watching, the traps in reading them, and how to collect them with Bleemeo.
What MySQL is, briefly
MySQL is an open-source relational database first released in 1995, and still the most common database behind web applications — Twitter, Facebook and YouTube among them. Oracle acquired it in 2010, at which point co-founder Michael Widenius forked the project as MariaDB. Almost everything below applies to both; where the two diverge, the variable names changed but the concepts did not.
MySQL 8.0 also renamed the replication status fields from Master/Slave to
Source/Replica. Both spellings appear here because both are still in the wild.
The metrics that matter
Connections, and the ceiling you hit at 3 a.m.
Threads_connected against max_connections is the headroom. Reach the limit and MySQL
refuses new clients — including the connection you wanted for diagnosing it. MySQL reserves
one slot for SUPER, which is the only reason those incidents are recoverable at all.
Three counters tell the story better than the gauge:
Max_used_connections— the high-water mark since startup. If it is close tomax_connections, you have already come near the ceiling, whatever the current value says.Connection_errors_max_connections— clients actively refused because the limit was reached. Should be zero. Any non-zero value is a past outage you did not notice.Aborted_clientsversusAborted_connects— the first is clients that vanished without closing cleanly (often a pool with a shorter idle timeout thanwait_timeout), the second is failed handshakes: wrong credentials, or a host that cannot resolve.
The InnoDB buffer pool
This is MySQL’s memory story. The buffer pool caches data and index pages; when it is too small for the working set, every query starts touching disk.
Read hit ratio as 1 - (Innodb_buffer_pool_reads / Innodb_buffer_pool_read_requests):
read_requests counts logical reads, reads counts the ones that had to go to disk. Above
99% is typical for a well-sized pool on an OLTP workload.
Also watch Innodb_buffer_pool_pages_free. A pool that has been at zero free pages since
startup is not necessarily unhealthy — it filled up and is doing its job — but combined with a
falling hit ratio it is a clear sizing signal.
Ignore the query cache entirely. It was deprecated in 5.7 and removed in 8.0, and
dashboards still graphing Qcache_hits are measuring a feature that no longer exists.
Query quality, without a slow-query log
Two counter pairs tell you about bad queries without parsing any logs:
Created_tmp_disk_tablesagainstCreated_tmp_tables. MySQL builds temporary tables in memory until they exceedtmp_table_size, then writes them to disk. A high disk ratio means sorts and grouping are spilling — eithertmp_table_sizeis too small or the queries are returning too much.Select_scanandSelect_full_join. Full table scans and joins with no usable index. A risingSelect_full_joinafter a deploy is almost always a missing index on a new query path.
Slow_queries counts statements exceeding long_query_time. Useful, but only if
long_query_time is set to something meaningful — the default of 10 seconds catches
catastrophes and misses everything that matters. One second is a more informative setting.
Locks and contention
Innodb_row_lock_waitsandInnodb_row_lock_time_avg. Row-level contention. A rising average wait means transactions are queuing behind each other, usually because something holds a lock longer than it should.Table_locks_waited. On InnoDB this should be near zero; if it is not, something is still using MyISAM, or aLOCK TABLEScrept into application code.
Replication, and the metric that lies
This is the one to get right. On a replica, three things must be true, and lag alone covers only one of them:
Slave_IO_Running/Replica_IO_RunningisYes— the replica is receiving from the source.Slave_SQL_Running/Replica_SQL_RunningisYes— the replica is applying what it received.Seconds_Behind_Master/Seconds_Behind_Sourceis low.
The trap: that third value is computed from the applied relay log. If the I/O thread dies, the replica stops receiving new events, faithfully finishes applying the ones it already has, and then reports zero seconds behind — because it has caught up with everything it knows about. The graph flatlines at healthy while the data ages.
So alert on the two threads, not just the lag. And note the value is NULL when replication
is stopped, which a naive threshold check reads as “not greater than 30” and passes.
Collecting it with Bleemeo
Once the agent is installed, it discovers MySQL and connects on its own in the common cases.

Where MySQL needs explicit credentials, the options are in
the documentation. Grant the monitoring user
only PROCESS, REPLICATION CLIENT and SELECT on the schemas it needs — enough for every
counter above, and nothing more for a credential that sits in a config file.
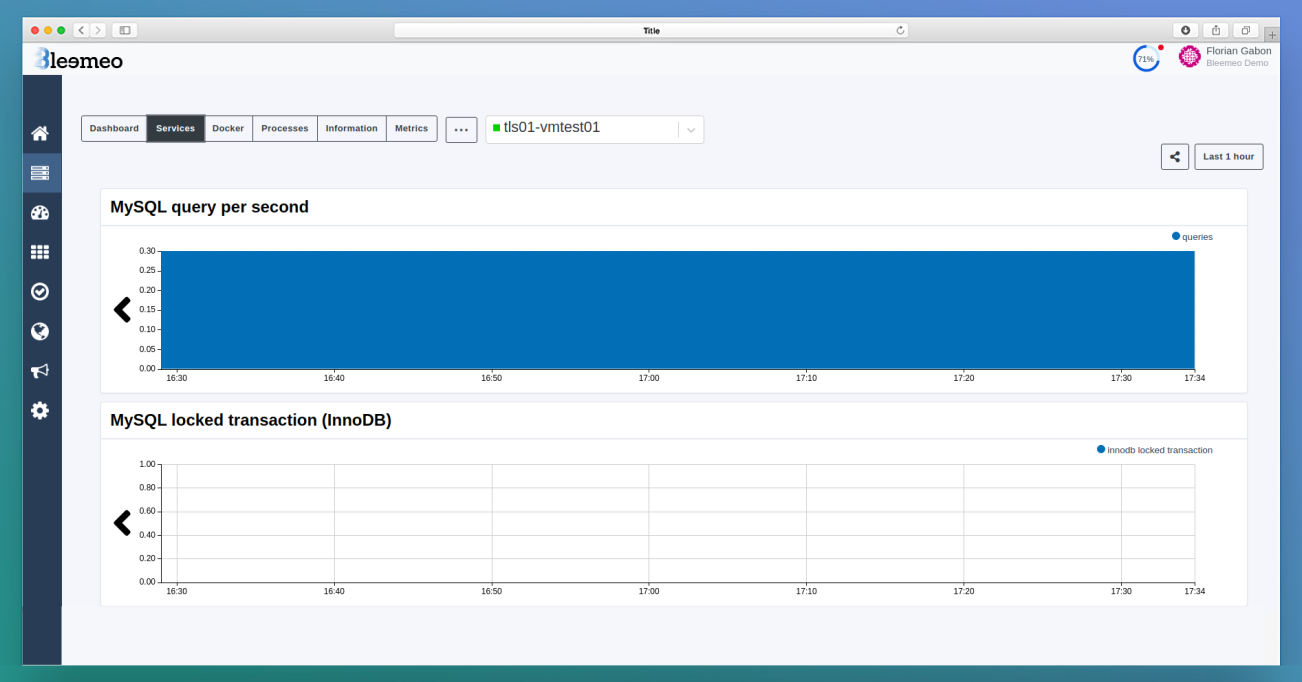
The service dashboard you get for free
Once the agent can reach MySQL, a default dashboard appears:
Building the dashboard you actually want
A custom dashboard for what the default one does not show. The example below graphs:
- Number of queries per second
- Number of threads connected, running and cached
- Status of MySQL
- Number of selects per second
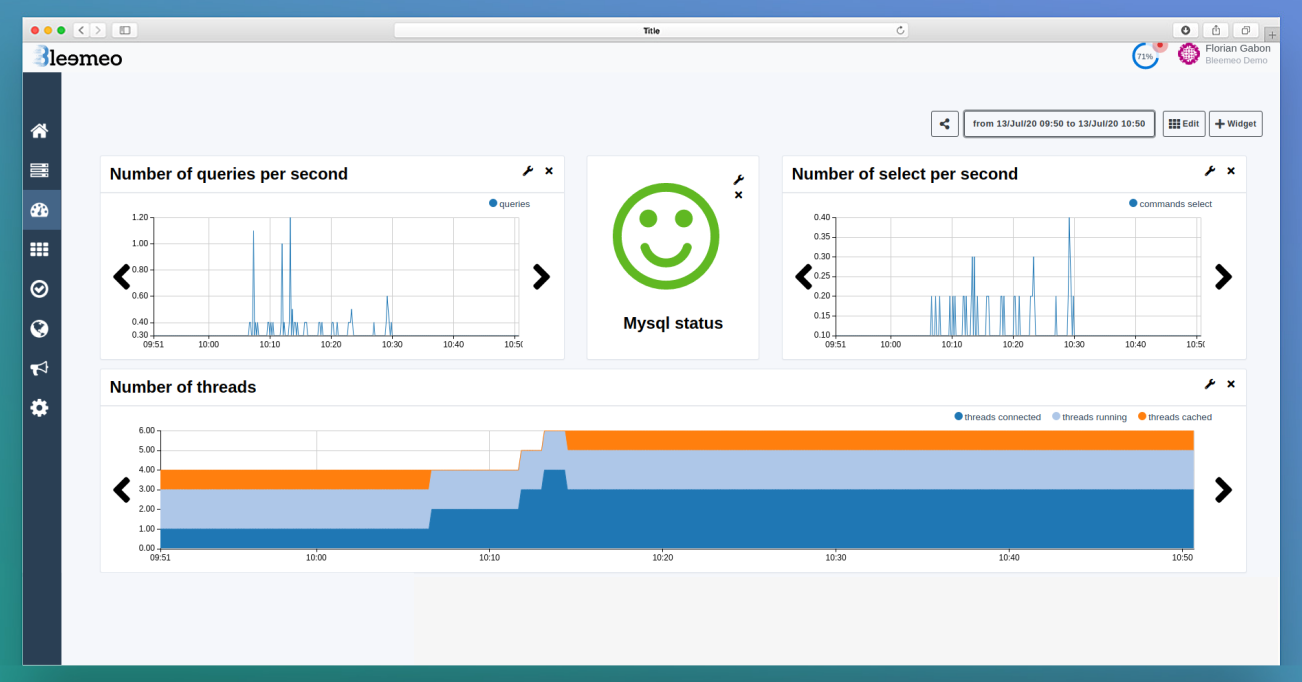
Threads connected against threads running is a more useful pair than either alone: connected tells you how many clients are attached, running tells you how many are actually doing work. A wide and widening gap means clients are queuing.
You can mix in anything else Bleemeo collects. For a containerised database:
- Status of the MySQL container
- Memory used by applications in percent
- CPU used in percent
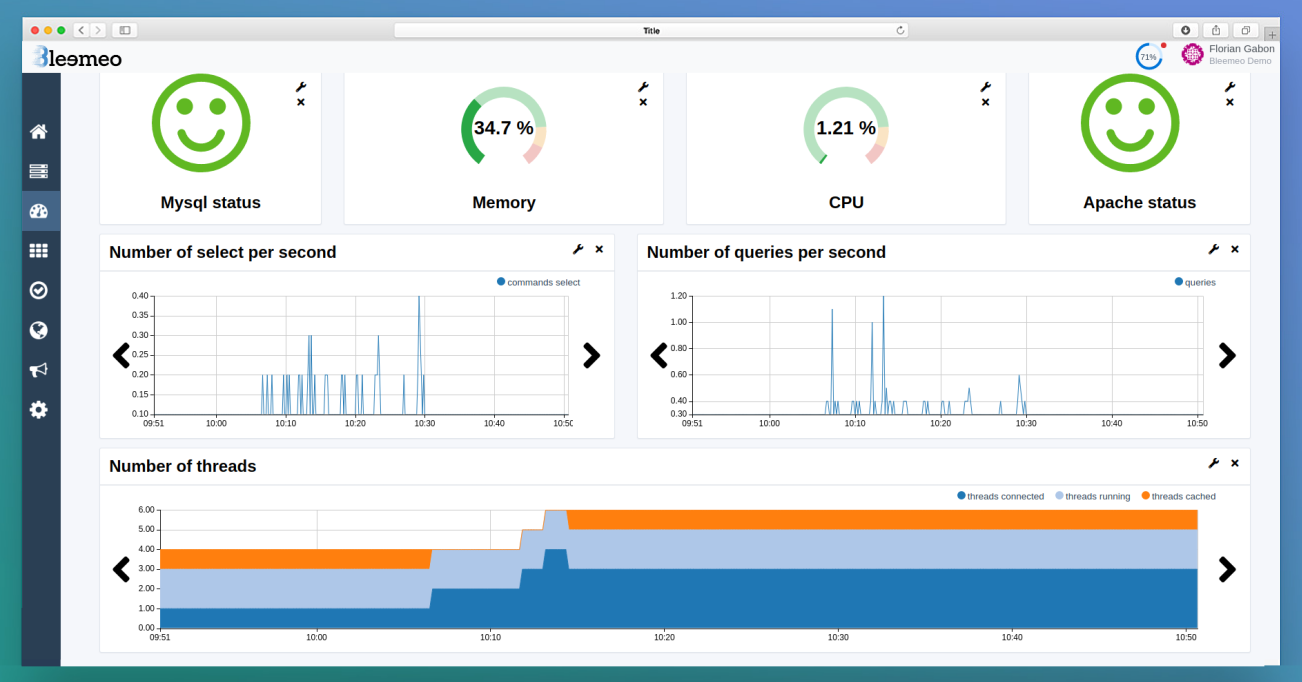
Which is where a single screen starts earning its keep: buffer pool hit ratio next to host memory explains a slowdown that neither number explains alone.
Which of these deserve an alert
| Alert on | Why |
|---|---|
Threads_connected above 80% of max_connections |
At the ceiling you cannot connect to diagnose |
Connection_errors_max_connections above zero |
Clients were refused; it already happened |
Slave_IO_Running or Slave_SQL_Running not Yes |
Lag reads healthy while replication is dead |
| Replication lag above your staleness budget | Only meaningful alongside the two threads |
Created_tmp_disk_tables ratio climbing |
Queries are spilling sorts to disk |
Innodb_row_lock_time_avg rising |
Transactions queuing on each other |
Queries per second is a dashboard line. It describes your traffic, not your database, and an idle application and a broken one draw the same graph.
MySQL monitoring FAQ
Why does my replica report zero seconds behind when replication is broken?
Because Seconds_Behind_Source measures how far behind the replica is in applying its relay log. If the I/O thread dies, no new events arrive, the SQL thread finishes what it already had, and the replica correctly reports that it has caught up — with a source it stopped listening to. Always check Replica_IO_Running and Replica_SQL_Running as well; note also that the lag value is NULL when replication is stopped, which a "greater than 30" threshold silently passes.
What is a good InnoDB buffer pool hit ratio?
Above 99% on an OLTP workload, computed as 1 - (Innodb_buffer_pool_reads / Innodb_buffer_pool_read_requests). Read it together with free pages: a pool at zero free pages is normal, but a pool at zero free pages and a falling hit ratio means the working set has outgrown it.
Should I still monitor the MySQL query cache?
No. It was deprecated in 5.7 and removed entirely in 8.0. Dashboards still graphing Qcache_hits are charting a feature that no longer exists — the buffer pool is where MySQL's caching story is now.
Does any of this differ for MariaDB?
The concepts are identical and most counter names are too. MariaDB kept the Slave_* spelling where MySQL 8.0 moved to Replica_*, and the two have diverged on some InnoDB internals — but connections, buffer pool, temp tables, locks and the three-part replication check all read the same way.