Monitor Your E-Commerce Platform in 10 Minutes
Every minute of downtime costs you sales. Get full visibility into your servers, databases, and checkout flow — before your customers notice a problem.
15-day free trial · No credit card required · Production-ready in minutes
When Your Store Goes Down, Revenue Stops
Downtime is expensive
For an online store doing €10,000/day in revenue, one hour of downtime costs over €400 — and that's before you count the customers who won't come back. Slow page loads are just as costly: studies show that every additional second of load time reduces conversions by up to 7%.
No time to build a monitoring stack
Yet most e-commerce teams don't have dedicated DevOps. The CTO or lead developer manages infrastructure alongside feature development. Setting up Prometheus, Grafana, and alerting is a project they'll never find time for.
Bleemeo: monitoring without the project
Bleemeo gives you complete infrastructure monitoring — servers, databases, web servers, caches, and uptime — in 10 minutes, with zero configuration. Know about problems before your customers complain.
Adapts to your architecture
Whether you're running a Magento store on a single server or a headless commerce platform across a dozen microservices, Bleemeo adapts to your stack automatically. You get server metrics, database query performance, cache hit rates, and external uptime monitoring — all from one agent and one dashboard, with alerts that work out of the box.
3 Steps to Complete E-Commerce Monitoring
Your CTO can set this up during a coffee break.
Install the Agent on Your Servers
One command per server. Bleemeo's Glouton agent auto-discovers your entire e-commerce stack: web server, application server, database, cache, search engine, and message queue.
wget -qO- 'https://get.bleemeo.com?accountId=...' Run this on each server in your stack. The agent detects everything running on the machine — no configuration file to write.
Auto-detected e-commerce stacks
Why auto-discovery matters for e-commerce
E-commerce stacks are complex — web servers, application runtimes, databases, caches, and search engines all working together. Manually configuring monitoring for each component means hours of YAML and the risk of missing a critical service. Bleemeo detects every service on your machine in seconds, so nothing falls through the cracks.
Add Uptime Monitors for Your Critical URLs
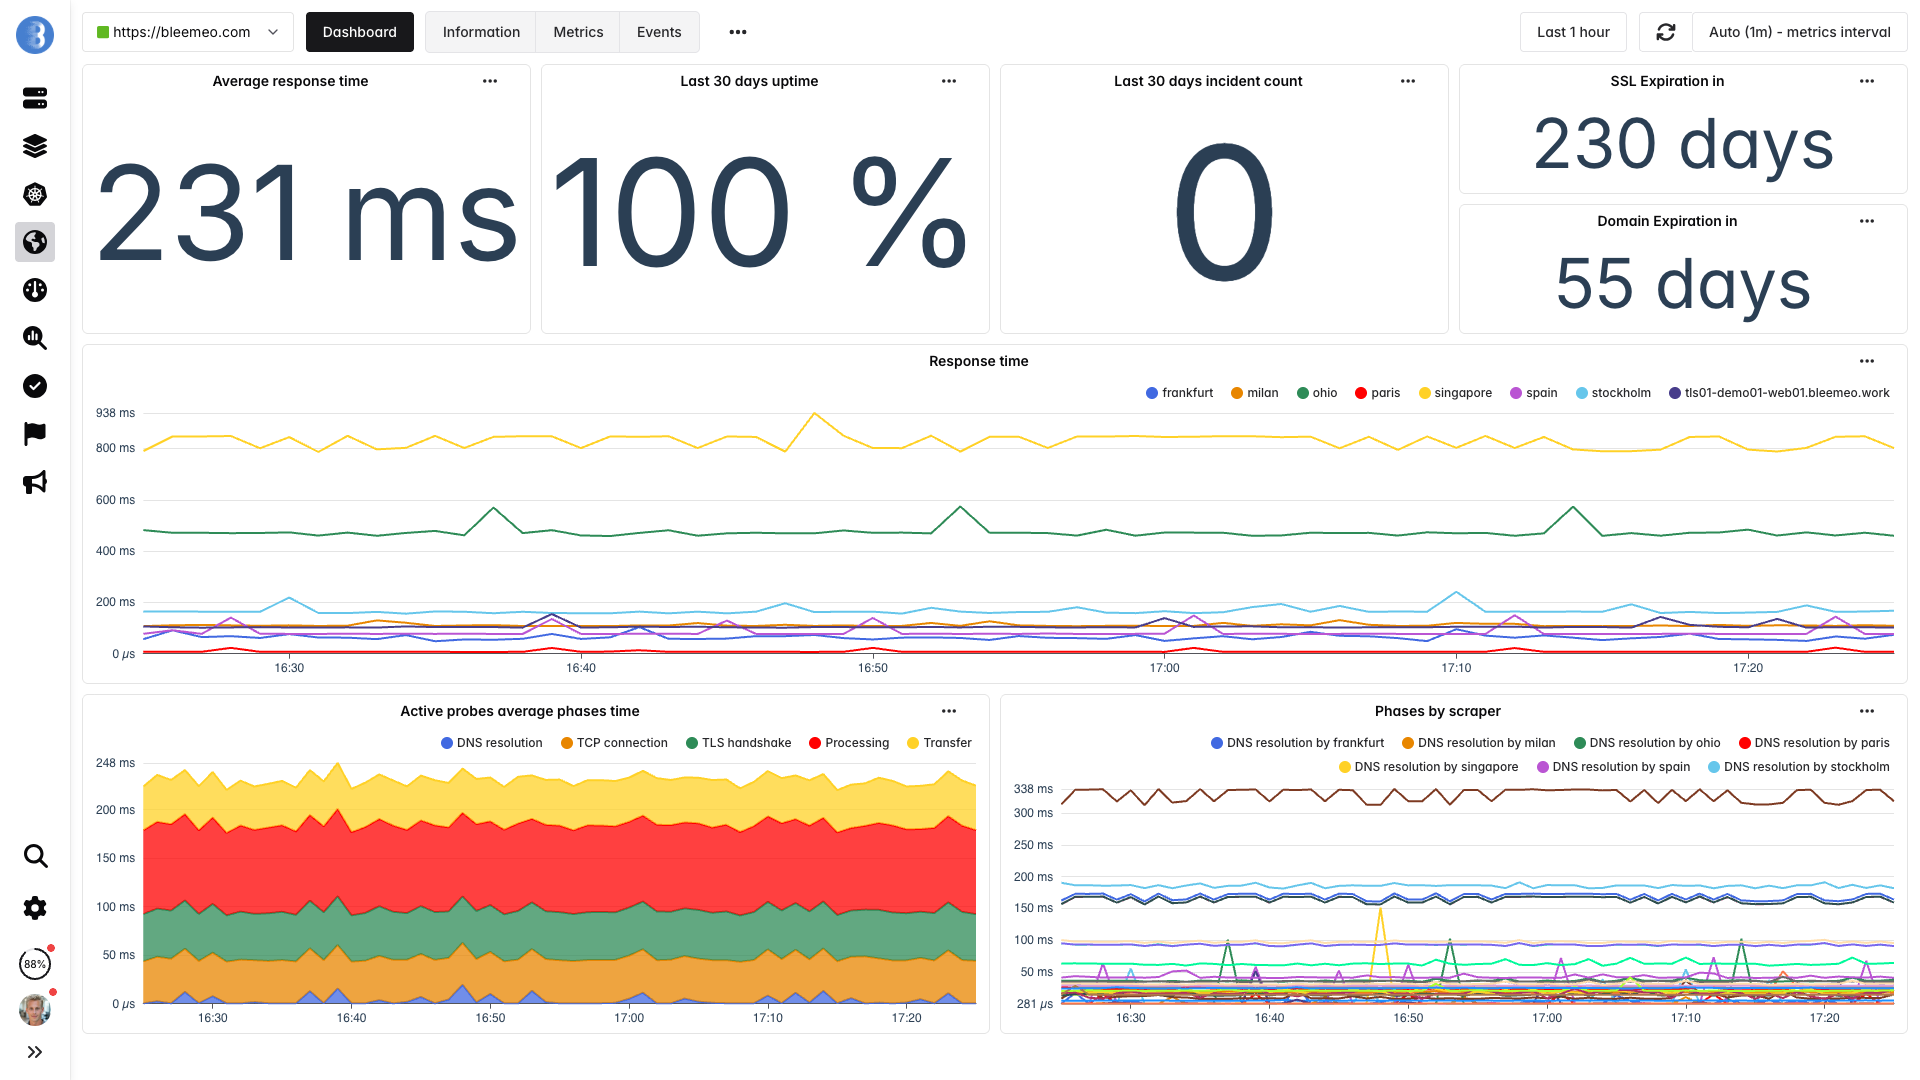
Monitor your most important pages from 7 global locations. Bleemeo checks availability, response time, SSL certificate expiration, and content validation every 60 seconds.
- Homepage — first impression, SEO impact
- Product pages — your revenue drivers
- Cart and checkout — where conversions happen
- API endpoints — mobile app, integrations
- Admin panel — your operational backbone
Learn more: Uptime Monitoring Features
Why external monitoring is critical for e-commerce
Your servers might show green across the board, but a DNS issue, CDN misconfiguration, or payment gateway timeout can still block customers from completing purchases. Monitoring from 7 global locations sees what your customers see — and catches problems that internal checks miss.
Get Alerted Before Your Customers Notice
Default alert rules are active immediately. Route notifications to where your team works — whether it's 2 PM or 2 AM.
Server issues
- High CPU usage
- Memory pressure
- Disk full
Database problems
- Slow queries
- Connection pool exhaustion
- Replication lag
Web server errors
- 5xx error spike
- High response time
- SSL expiration
Cache & uptime
- Redis/Memcached memory pressure
- Downtime from any location
- Cache evictions
- Slack and Microsoft Teams
- Email (enabled by default)
- PagerDuty, OpsGenie, VictorOps
- SMS via Twilio or MessageBird
- Webhooks for custom integrations
Why smart defaults beat manual configuration
Writing effective alert rules requires deep knowledge of each service's failure modes. Bleemeo ships with battle-tested thresholds for every auto-detected service — so you're protected from minute one, without spending hours tuning alert conditions that might still miss the problem that actually matters.
What You Monitor Across Your E-Commerce Stack
Every layer of your infrastructure, covered automatically.
An e-commerce platform is a chain — and it's only as strong as its weakest link. A slow database query makes your product pages crawl. A full disk crashes your web server. A cache eviction spike hammers your database during a flash sale. Bleemeo monitors every layer so you can see where problems start, not just where they surface.
Customer-facing layer
This is what your customers experience. If your homepage is slow or your checkout is down, you need to know immediately — not from a support ticket an hour later.
- Uptime from 7 global locations
- Response time tracking
- SSL certificate monitoring
Web / Application layer
Your web server and application runtime handle every request. A misconfigured worker pool or a memory leak here affects every visitor to your store.
Data layer
- MySQL / PostgreSQL query performance
- Redis / Memcached hit rate & memory
- Elasticsearch cluster health
Infrastructure layer
- CPU, memory, disk, network per server
- Docker container metrics (if applicable)
- Log collection and search
The Cost of Not Monitoring
Downtime = Lost Revenue
An online store doing €10K/day loses €416/hour of downtime. Bleemeo detects outages in under 60 seconds from 7 global locations — so you can start fixing the problem in minutes, not hours. For peak shopping events like Black Friday, even a few minutes of downtime can cost thousands.
Slow Pages = Lost Conversions
A 1-second delay in page load reduces conversions by up to 7%. Track response times across your homepage, product pages, and checkout flow — and get alerted before performance degrades to the point where shoppers abandon their carts.
Monitoring Costs < Downtime Costs
Monitoring 5 servers with Bleemeo costs €54.95/month. That's less than 8 minutes of downtime for a €10K/day store. Try the cost calculator.
You Don't Need a DevOps Team
Bleemeo is built for teams that can't afford to spend days setting up monitoring. There's no Prometheus to configure, no Grafana dashboards to build, no alerting rules to write. Your CTO or lead developer can set it up during a coffee break and get back to building features that grow your business.
Most e-commerce companies run lean engineering teams. The same people who build product features also manage infrastructure, handle deployments, and respond to incidents. Bleemeo takes monitoring off that plate entirely — you get production-grade observability without hiring a dedicated SRE or spending weeks on tooling that isn't your core business.
See How It WorksTrusted by teams who can't afford downtime
Engineers and CTOs trust Bleemeo to monitor their infrastructure
During a short lunch break we installed Bleemeo, created a custom metric, tested alerts, and were ready for production. The speed of deployment is remarkable.

Bleemeo support is simply legendary — fast, knowledgeable, and always there when we need it.
Bleemeo was incredibly fast to deploy. In about an hour we rolled it out across more than 100 servers and immediately gained full visibility into our infrastructure.

We set up monitoring for all our servers in just a few hours. The dashboard is clear, powerful, and genuinely enjoyable to use.

We deployed Bleemeo across our server infrastructure in only a few hours. Uptime monitoring now alerts us instantly whenever a service encounters an issue.

Our Prometheus + Grafana stack had become a maintenance project. With Bleemeo we deployed the agent in minutes and finally focused on using monitoring instead of maintaining it.
After installing the agent, Bleemeo automatically discovered our databases, containers, and services. Within an hour we had full infrastructure visibility — no dashboards or exporters to build.
Bleemeo replaced several monitoring tools with a single platform. Metrics, alerts, and logs are now in one place, saving our team significant time.
Bleemeo gave us immediate insight into our infrastructure without the usual complexity. Within a couple of hours we had metrics, alerts, and dashboards running smoothly.
Setting up Bleemeo was refreshingly simple. The agent deployment took minutes and the automatic discovery saved us days of configuration.
Thanks to Bleemeo, our team now detects issues before our users notice them. The alerting is reliable and the interface makes troubleshooting much faster.
Moving to Bleemeo simplified our monitoring stack dramatically. Instead of managing multiple tools, everything we need is available in a single platform.
Centralizing our logs in Bleemeo drastically simplified troubleshooting. Instead of jumping between tools, we can now correlate metrics and logs instantly to understand what's happening.
Bleemeo made Kubernetes monitoring surprisingly easy. Within minutes we had visibility into our clusters, pods, and workloads without having to build complex dashboards ourselves.
Your Store Deserves Better Than Crossing Your Fingers
Get complete e-commerce monitoring in 10 minutes. Know about problems before your customers do.
15-day free trial · No credit card required · Cancel anytime
Frequently Asked Questions
What e-commerce platforms do you support?
Bleemeo monitors infrastructure, not specific CMS features. Whether you run Shopify on custom servers, WooCommerce, Magento, PrestaShop, or a custom-built platform, we monitor the servers, databases, caches, and web servers that power it. If it runs on a server, we monitor it.
Can I monitor my checkout and payment flow?
Yes. Set up HTTP monitors for your cart, checkout, and payment confirmation URLs. Bleemeo checks availability and response time from 7 global locations every 60 seconds and alerts you instantly if something breaks.
Do I need to install anything on every server?
Yes, one agent per server — it's a single command that takes under a minute. The agent is lightweight (less than 1% CPU, under 100 MB RAM) and auto-discovers all services on the machine. For Docker-based setups, one agent per host monitors all containers automatically.
How quickly will I be alerted if my site goes down?
Uptime checks run every 60 seconds from multiple global locations. If your site is unreachable from any location, you're notified within 1–2 minutes via your preferred channel (email, Slack, SMS, PagerDuty).
How much does it cost for a typical e-commerce setup?
A typical 3–5 server stack (web, database, cache) costs between €32.97 and €54.95/month on the Professional plan. That's less than 10 minutes of downtime for most online stores. See full pricing details.
Can I also monitor my staging environment?
Yes. Install the agent on your staging servers just like production. Bleemeo keeps environments separate in the dashboard, so you can spot issues before they reach your live store. The free tier covers up to 3 servers, which is often enough for a staging environment.
Does Bleemeo support CDN and third-party service monitoring?
Bleemeo's uptime monitoring can check any public URL, including your CDN endpoints, payment gateways, and third-party APIs. You'll be alerted if response times degrade or endpoints become unreachable, helping you distinguish between issues on your infrastructure and problems with external services.
Can I set up alerts for slow page load times?
Yes. Configure HTTP monitors with response time thresholds for your key pages — homepage, product pages, checkout. If response time exceeds your threshold, Bleemeo alerts you via Slack, email, or any configured channel before your customers notice.
How does Bleemeo handle traffic spikes like Black Friday?
Bleemeo scales with your infrastructure. As you add servers to handle traffic spikes, simply install the agent on each new instance — it takes one command. Monitoring starts automatically, and you can track how your entire fleet performs under peak load in real time.
Is there an API to integrate monitoring into my deployment pipeline?
Yes. Bleemeo provides a full REST API that lets you automate agent registration, manage monitors, query metrics, and configure alerts. Many teams integrate Bleemeo into their CI/CD pipelines to automatically set up monitoring as part of their deployment process.