
Monitoring a single server should not require running four daemons. Yet the default open-source recipe for “I just want to watch this one box” still looks like this: install node_exporter, stand up a Prometheus server to scrape it, add Grafana to draw the graphs, and bolt on Alertmanager so you actually hear about a full disk. That is a lot of moving parts — and a lot of YAML — for one machine.
This post shows a lighter path. Lightweight server monitoring that fits a single VPS, a home server, or a small fleet: one binary, a standard Prometheus /metrics endpoint, automatic service discovery, and a dashboard built in. No stack to assemble.
The usual Prometheus stack is overkill for one server
The Prometheus ecosystem is excellent — at scale. But for a single server, the standard assembly has real costs:
- Several processes to install, configure and keep updated: node_exporter, Prometheus, Grafana, Alertmanager. Each has its own config file, its own port, its own upgrade cadence.
- An exporter per thing you want to see: PostgreSQL? Add postgres_exporter. nginx? Another exporter. Redis, RabbitMQ, the host’s SMART data… every source is one more sidecar to deploy and wire into the scrape config.
- Memory and CPU you’d rather give to your app: a Prometheus server plus Grafana on a small box is not free.
For large, dynamic infrastructure that overhead pays for itself. For one server, it is friction that stops a lot of people from setting up server monitoring at all.
A lighter approach: one binary
Glouton is an open-source monitoring agent (Apache 2.0) written in Go. It ships as a single binary that collects metrics, runs availability checks, ingests host and container facts, and serves both a Prometheus endpoint and a local dashboard — all from one process.
Footprint: about 100 MB of RAM and 3–5% of a single core on a typical host (~700 active metric series, polled every 10 seconds).
You can have it running on a server in one command, with no account and no signup:
docker run -d --name=glouton \
  -v /var/lib/glouton:/var/lib/glouton \
  -v /var/run/docker.sock:/var/run/docker.sock \
  -v /:/hostroot:ro \
  -e GLOUTON_BLEEMEO_ENABLE=false \
  --pid=host --net=host \
  --cap-add SYS_PTRACE --cap-add SYS_ADMIN \
  bleemeo/bleemeo-agent
GLOUTON_BLEEMEO_ENABLE=false keeps everything local — nothing is sent anywhere. Native packages for Debian/Ubuntu, RHEL/CentOS and Windows are available too; see the installation documentation.
Standard Prometheus metrics, no lock-in
Going lightweight does not mean leaving the Prometheus ecosystem behind. Glouton exposes a standard /metrics endpoint on port 8015, in the exact format any Prometheus server expects:
curl http://localhost:8015/metricsThat single property is what makes the approach safe to adopt. The same data is reachable three ways:
- Scrape it from an existing Prometheus, Grafana Agent, or any OpenMetrics-compatible collector — Glouton is just another target.
- Query it through a Prometheus-compatible HTTP API at
/api/v1/queryand/api/v1/query_range, so Grafana connects with no glue. - Read it directly in the built-in panel (more on that below).
Nothing is proprietary on the metrics path. If you outgrow the single-binary setup, your dashboards and PromQL queries keep working.
Auto-discovery instead of an exporter zoo
The biggest day-to-day win is that you do not deploy an exporter per service. Glouton discovers the services running on the host — by inspecting processes, listening ports and container labels — and attaches the right metric set and availability check automatically.
Out of the box it covers databases and brokers (PostgreSQL, MySQL, Redis, RabbitMQ, MongoDB…), web servers (nginx, Apache), and many more, plus:
- Host metrics equivalent to node_exporter — CPU, memory, disks, filesystems, network — with no separate exporter.
- Container metrics for Docker, containerd and Kubernetes.
- Probes and checks: HTTP/HTTPS, TCP, and custom Nagios-style scripts or NRPE commands.
- Application metrics when you want them: scrape your own Prometheus endpoints, JMX for Java apps, or push custom counters over StatsD.
One agent, the whole picture — instead of a scrape config that grows every time you add a service.
A dashboard built in
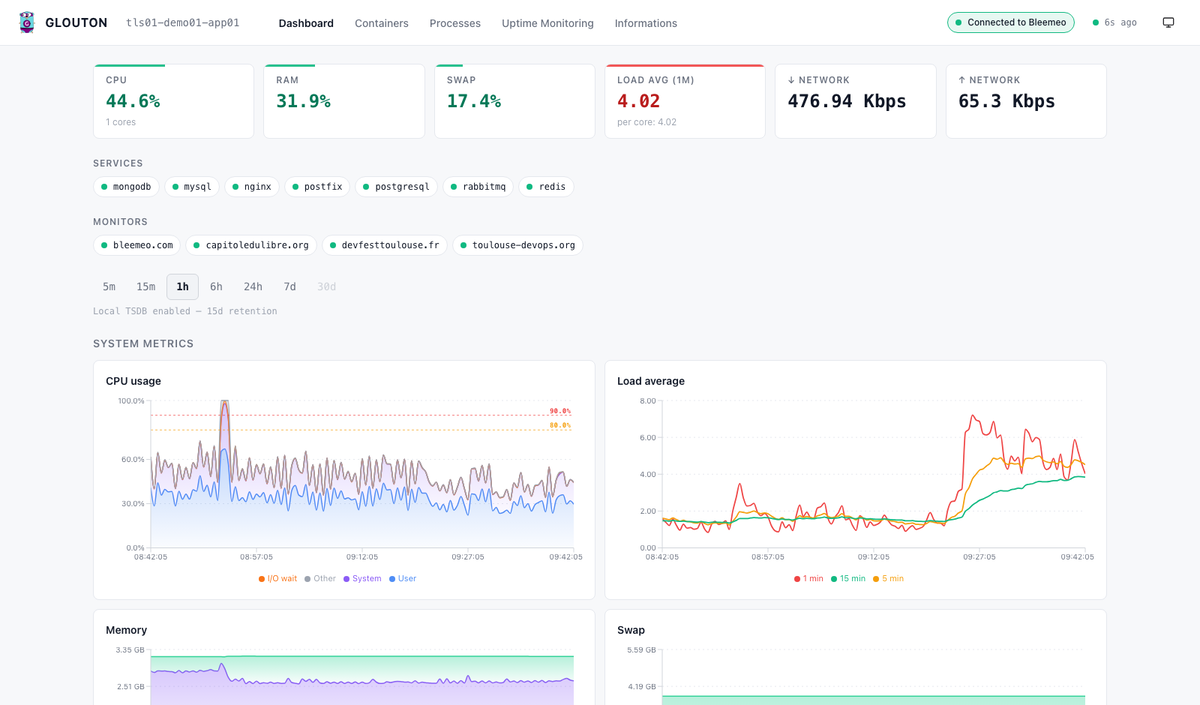
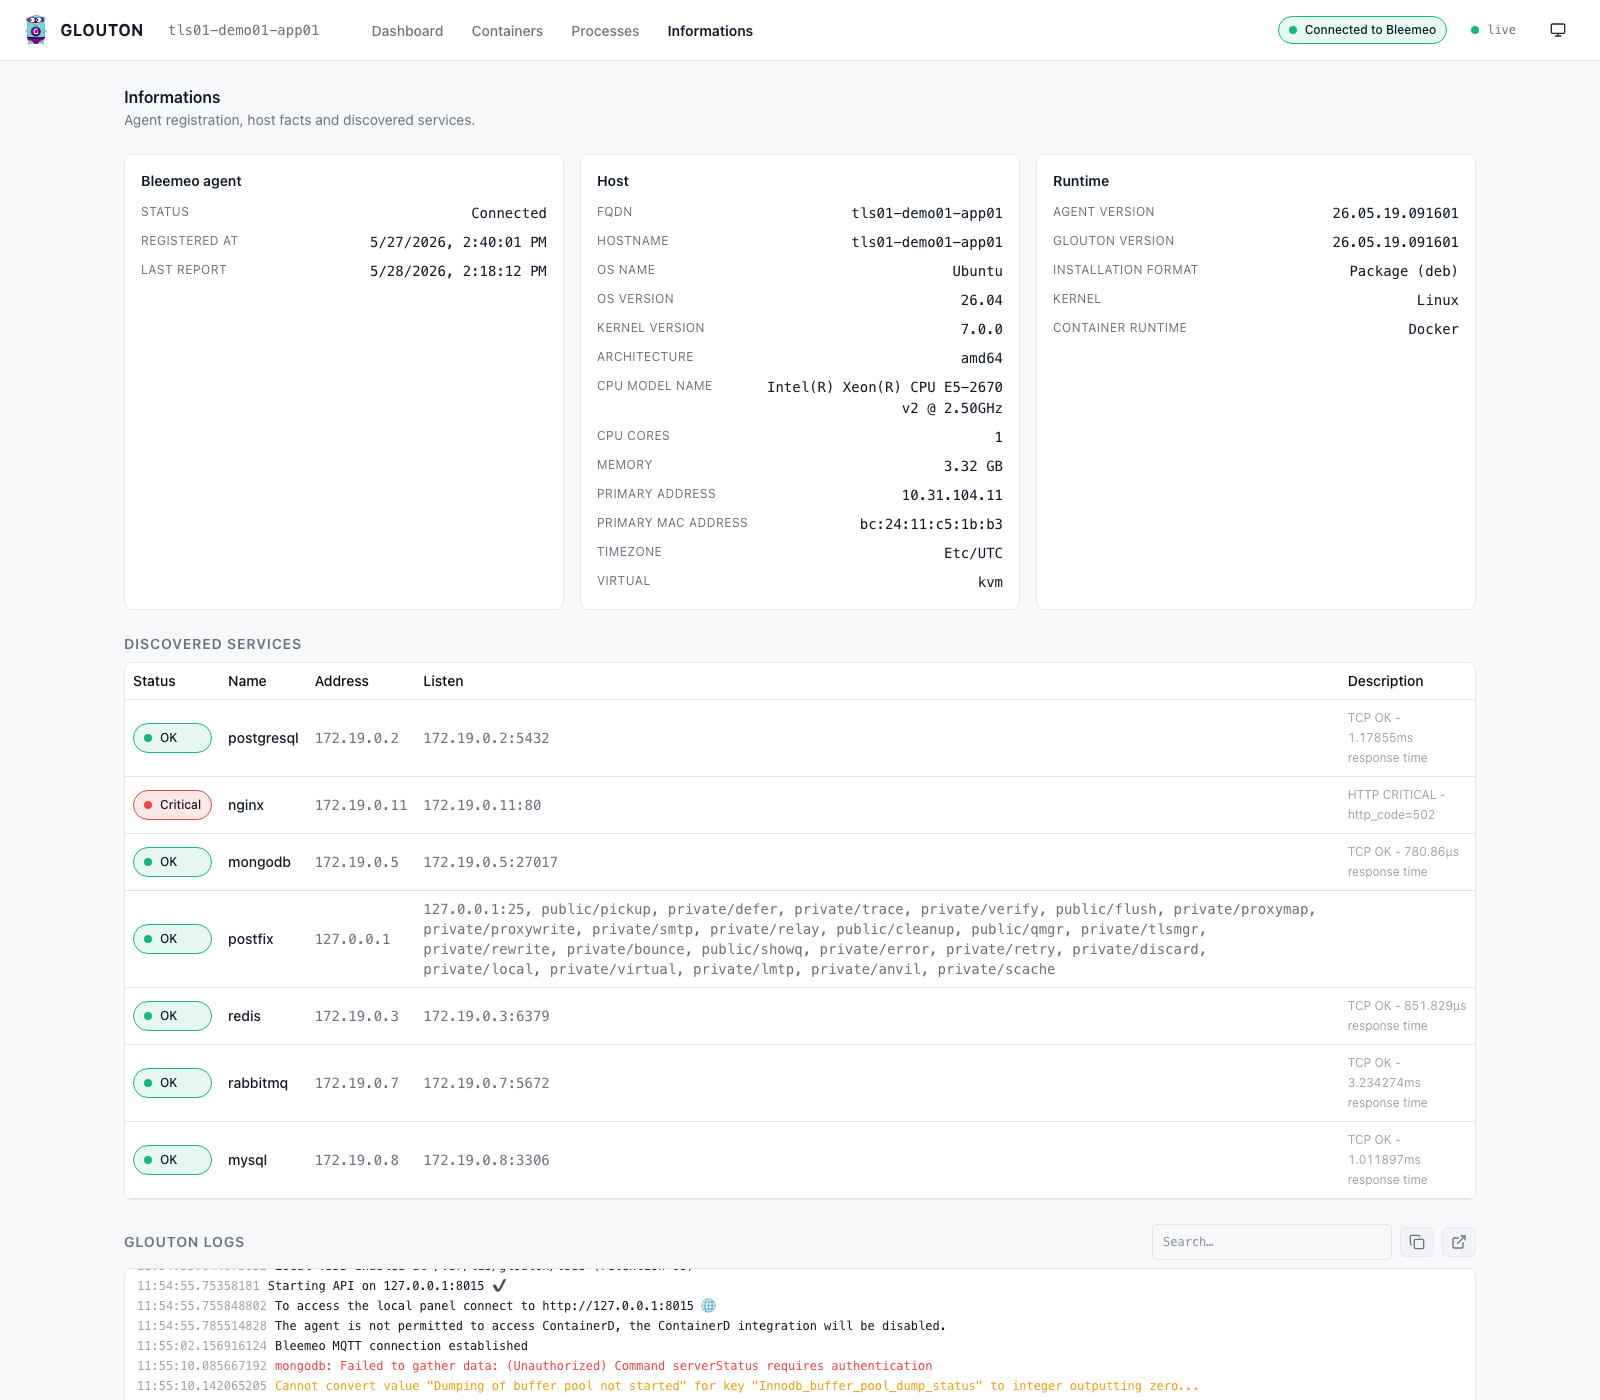
Recent Glouton releases ship a refreshed web panel at http://localhost:8015, so a fresh install is useful immediately — no Grafana required for the single-server case.
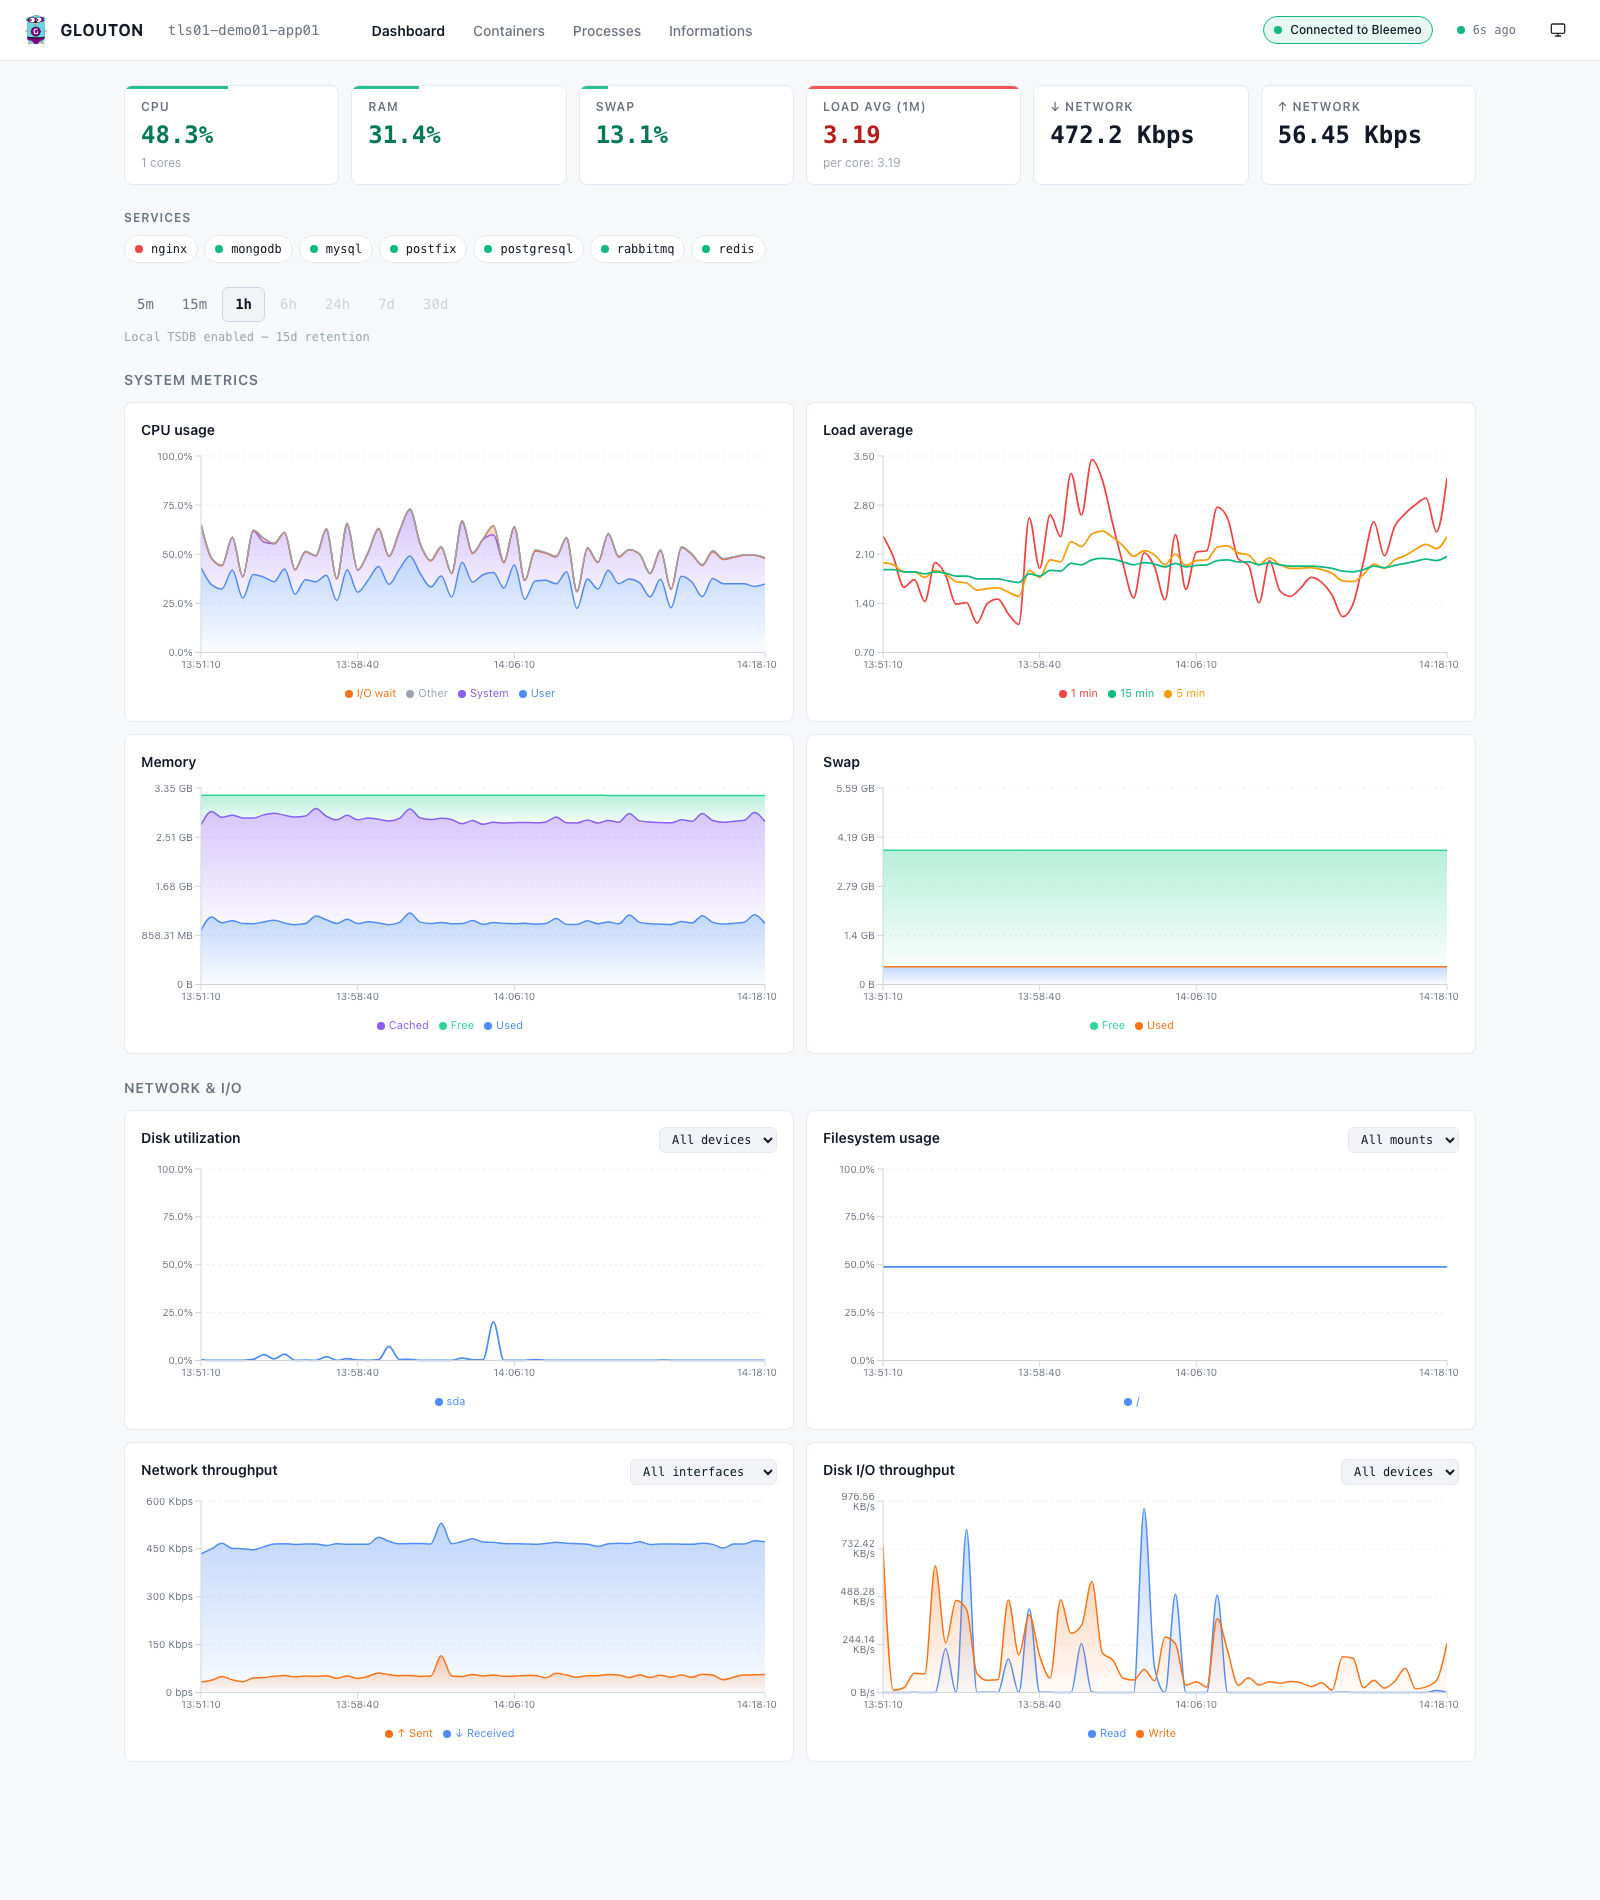
The dashboard gives you, with zero configuration:
- KPI cards and status-coded charts for system, network and I/O metrics, with drag-to-zoom and a light/dark theme.
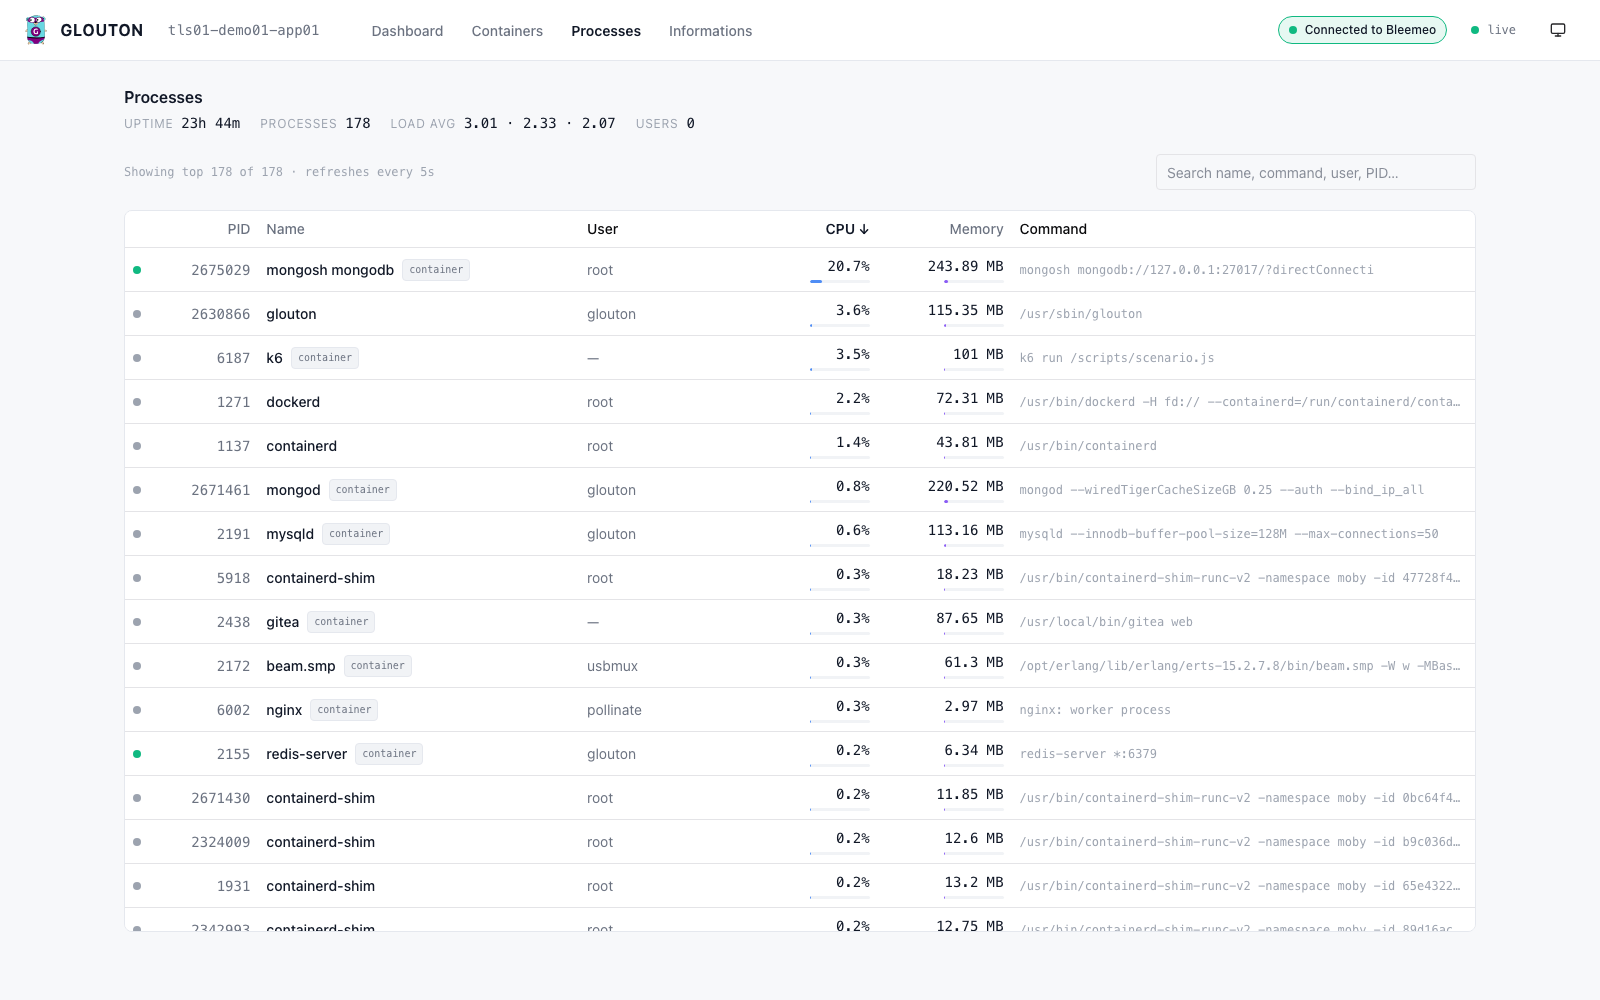
- A process explorer to see what is actually consuming CPU and memory right now.
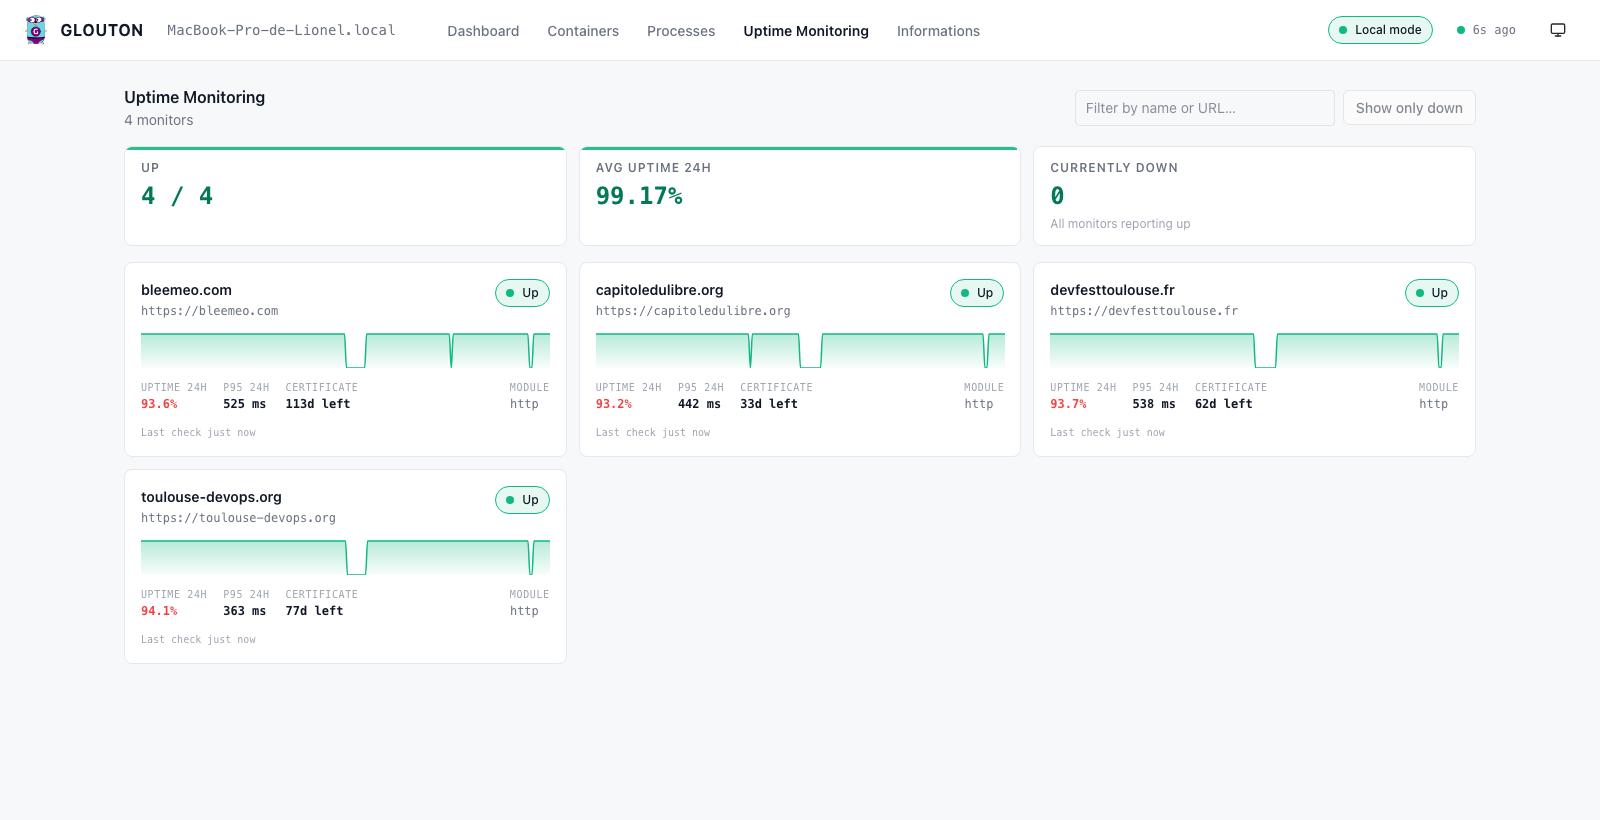
- An Uptime Monitoring tab that surfaces your HTTP/TCP probes — uptime, latency and TLS certificate expiry per target — and their recent failures, handy when the “single server” is also hosting a couple of public endpoints you want to keep an eye on.
- An Informations tab that shows host facts and the thresholds currently configured on each metric, so you can see at a glance which value will turn a chart from green to warning to critical.
Because an on-disk TSDB starts automatically when Bleemeo is disabled, the longer time ranges (24 h, 7 d, 30 d) work straight after docker run — local history, no external database.
Status and thresholds without Alertmanager
Remember Alertmanager from the opening list? On a single server you often don’t need it. Glouton applies thresholds to any metric and turns the raw value into a status — ok, warning or critical:
thresholds:
  cpu_used:
    high_warning: 80
    high_critical: 95
  disk_used_perc:
    high_warning: 80
    high_critical: 90
Those thresholds drive two things. In the panel, charts and KPI cards are color-coded, and the Informations tab lists every threshold currently in effect — so you can see at a glance which value flips a metric from green to red. On the metrics path, Glouton emits a companion <metric>_status series (0 = ok, 1 = warning, 2 = critical) right next to the raw metric on /metrics, so an existing Prometheus or any scraper can alert on a clean status signal instead of you re-deriving the same threshold logic in PromQL on every host.
What standalone Glouton does not do on its own — yet — is deliver the notification, the email, Slack message or on-call page. Native notifications straight from the agent are on the roadmap for a future release. In the meantime you either point your existing alerting at those _status metrics, or connect Bleemeo Cloud (next section) for managed notifications today.
When one server becomes many
The single-binary setup is complete on its own and stays 100% open source. But infrastructure has a habit of growing, and the thing that makes a lightweight agent pleasant on one box — auto-discovery, standard metrics, sane defaults — is exactly what you want across fifty.
That is the moment the same Glouton agent can forward to Bleemeo Cloud for long-term storage, alerting, notifications and a mobile app, without swapping out your agent or re-instrumenting anything. You flip GLOUTON_BLEEMEO_ENABLE and keep the rest. Until then, nothing leaves your server.
Try it
Lightweight server monitoring does not have to mean assembling a stack. One binary gives you Prometheus-standard metrics, automatic service discovery and a usable dashboard, on a ~100 MB footprint.
If you find it useful, a star on GitHub helps other people discover it too.
Related reading
- Server Monitoring 101 — the metrics that actually matter on a host.
- The benefits of Prometheus in the cloud — when a single endpoint is no longer enough.
- Glouton, our Go monitoring agent — the story behind the single binary.