A Modern Alternative to Nagios
Nagios pioneered monitoring in the 2000s, but its plugin-based architecture and manual
configuration files haven't kept pace with modern infrastructure. Bleemeo gives you automatic
discovery, built-in dashboards, and ML-powered alerting — no plugins, no NRPE, no objects.cfg.
15-day free trial • No credit card required • Migrate in minutes
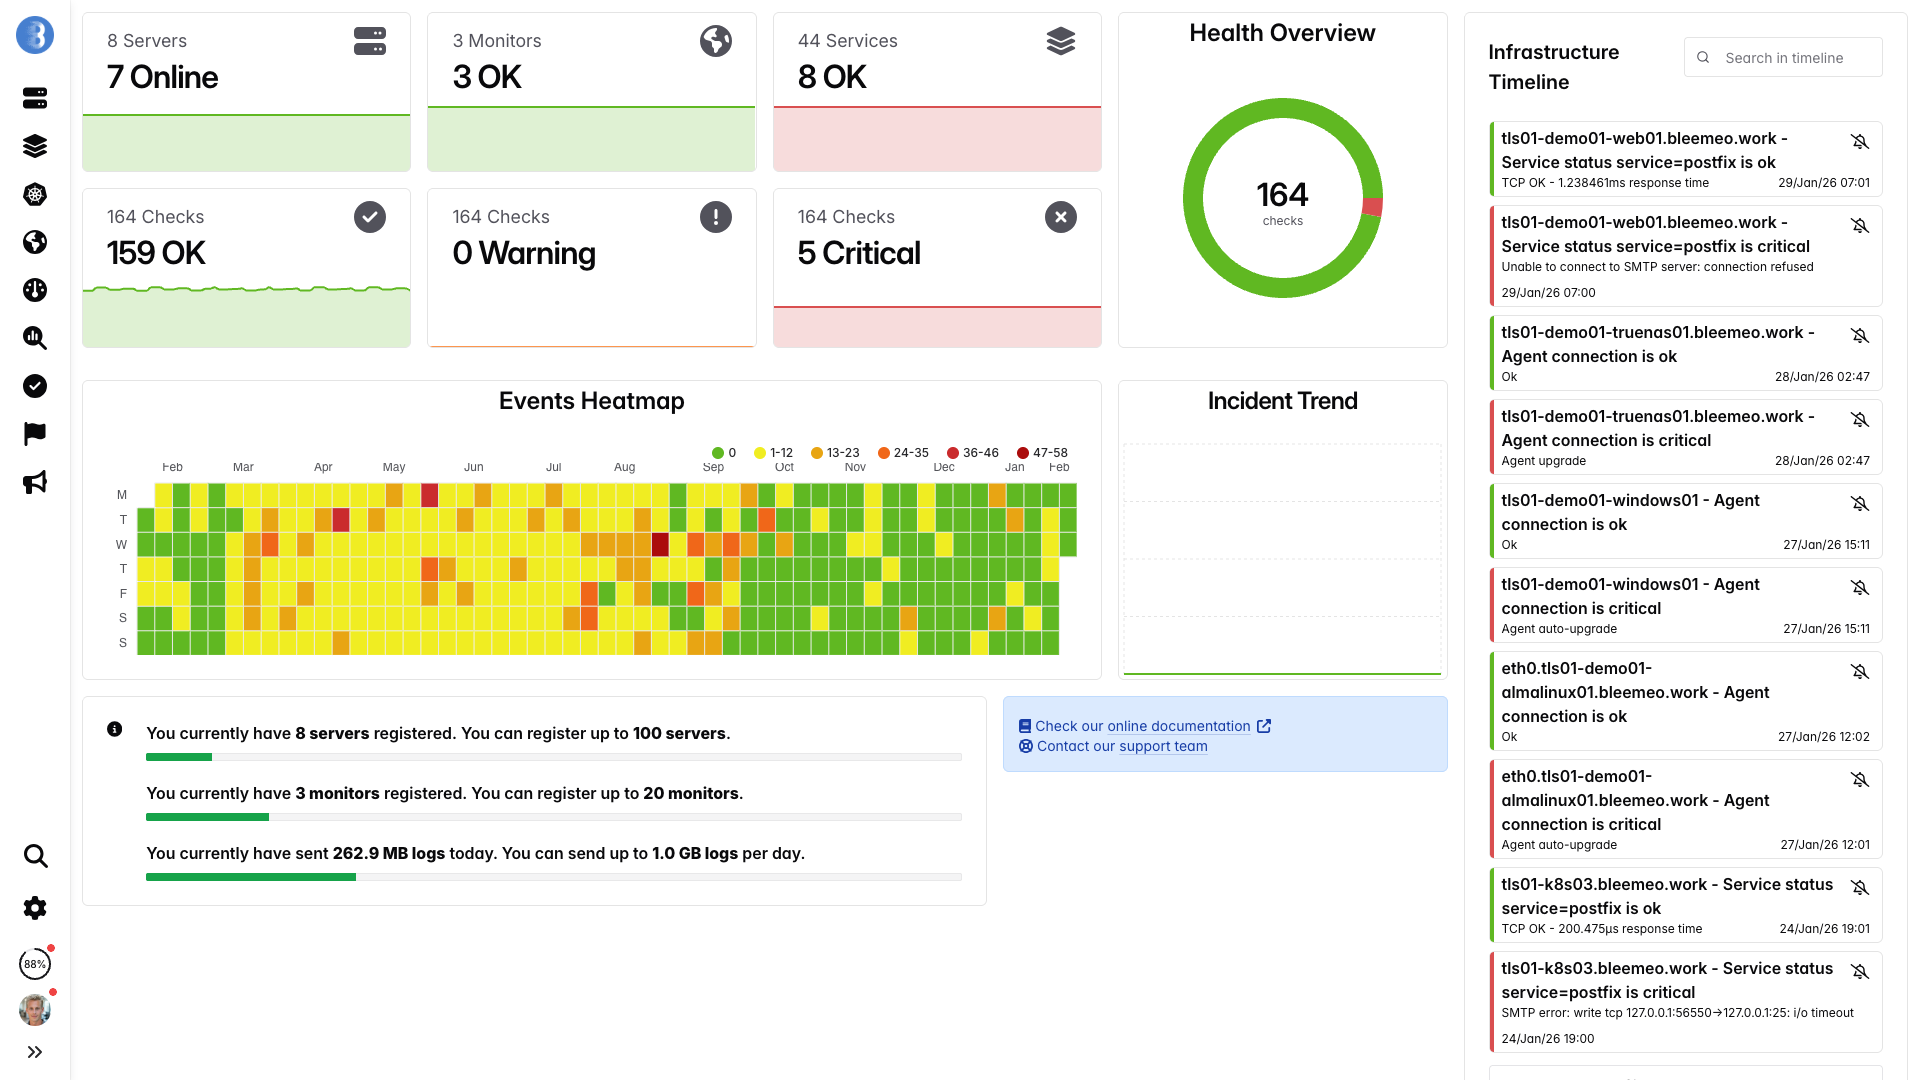
Real-time dashboards, ready in minutes — no configuration needed
Why Teams Are Moving Away from Nagios
Time-Consuming Setup
Configuring Nagios requires editing complex text files such as hosts.cfg, services.cfg, and commands.cfg, then reloading the daemon for every single change. Each new host or service must be manually defined with check commands, check intervals, notification periods, contact groups, and thresholds—often spanning dozens of lines per object. A single syntax error in these flat-file definitions can prevent the entire Nagios daemon from restarting, leaving your monitoring blind until the issue is found and corrected. What takes days or even weeks with Nagios takes just minutes with Bleemeo's automatic discovery, which detects services, containers, and infrastructure components the moment the agent is installed.
Maintenance Burden
Running Nagios means you are responsible for the monitoring server itself: OS patches, Apache or PHP upgrades, plugin compatibility, disk space for performance data retention, and NRPE agent updates across every server in your fleet. Each NRPE agent must be individually configured with allowed check commands and firewall rules, creating a sprawling maintenance surface that grows linearly with your infrastructure. The Nagios community has fragmented into competing forks like Icinga 2, Naemon, and Shinken, making it harder to find up-to-date plugins, compatible add-ons, and reliable documentation. Bleemeo is a fully managed SaaS platform—no servers to patch, no agents to manually configure, and no plugin repositories to audit—so your team can focus on resolving incidents instead of babysitting the monitoring stack.
Not Cloud-Native
Nagios was designed for static, on-premises data centers where hosts rarely change and IP addresses are fixed. It has no native support for containers, Kubernetes pods, auto-scaling groups, or serverless functions. Every time a cloud instance scales up or down, the corresponding host definition must be added or removed manually—or via fragile external scripts—leading to stale alerts, configuration drift, and phantom notifications for hosts that no longer exist. Bleemeo was built from day one for ephemeral, cloud-native environments where infrastructure is constantly changing.
Dated Interface
The default Nagios web UI—known as the CGI interface—has barely changed in over a decade. It offers only basic host and service status tables with no real-time dashboards, interactive time-series charts, or mobile responsiveness. Most teams end up installing third-party frontends like Thruk, Adagios, or bolting on Grafana with PNP4Nagios just to get usable visualizations, adding yet more components to maintain and secure. Bleemeo provides modern, customizable dashboards with real-time metric streaming and native iOS and Android apps out of the box, so you never need to cobble together multiple tools for basic visibility.
Nagios vs Bleemeo
| Feature | Nagios | Bleemeo |
|---|---|---|
| Setup Time | Days to weeks of manual host and service definitions | Minutes with a single agent install command |
| Configuration | Manual editing of objects.cfg, commands.cfg, and contacts.cfg | Automatic discovery of services, containers, and infrastructure |
| Cloud-Native | No container or Kubernetes support; static host model only | Native Kubernetes, Docker, and cloud provider integration |
| Mobile Apps | No official mobile application available | Native iOS and Android apps with push notifications |
| Alerting | Basic email and pager notifications via custom scripts | Smart routing with SMS, Slack, Teams, PagerDuty, and webhooks |
| Maintenance | Self-hosted server requiring OS patches, plugin updates, and NRPE management | Fully managed SaaS platform with zero server maintenance |
| Dashboards | Dated built-in UI; requires Thruk or Grafana for usable dashboards | Modern, customizable dashboards |
| Log Management | Not included; requires separate ELK stack or Graylog deployment | Integrated log collection, search, and analysis in the same platform |
| Anomaly Detection | Only static thresholds; no machine learning or trend analysis | ML-powered anomaly detection with automatic baseline learning |
| Prometheus & OpenTelemetry | No native support; incompatible check-based architecture | Native Prometheus exporter scraping and OpenTelemetry collector support |
| Scalability | Single-server architecture; distributed setups require complex Mod Gearman or DNX add-ons | Cloud-native SaaS that scales automatically from 10 to 10,000+ agents |
| API | Limited external command interface via command pipe; no REST API in Core | Full REST API for automation, integration, and custom workflows |
| Uptime Monitoring | Basic check_http plugin; no multi-location probing or SLA reporting | Global uptime checks from multiple locations with SLA dashboards |
| Pricing | Core is free but Nagios XI starts at $2,495; plus infrastructure, sysadmin time, and third-party tools | Simple per-agent pricing at 10.99 EUR/month, all features included, no hidden costs |
Total Cost of Ownership: Nagios vs Bleemeo
Nagios Core may be open source, but the real cost lies in the infrastructure, engineering time, and third-party tools required to run a production-grade monitoring stack. Here is a realistic comparison for a 100-server environment over one year.
Nagios Stack — Estimated Annual Cost
- Nagios XI Standard license (100 nodes): $4,495
- Dedicated monitoring server (hosting + maintenance): $3,600/year
- Sysadmin time for Nagios maintenance (~8 hrs/month): $9,600/year
- NRPE agent deployment and plugin maintenance: $2,400/year
- ELK stack or Graylog for log management: $6,000/year
- Grafana + PNP4Nagios for dashboards: $1,200/year
- Third-party uptime monitoring service: $1,800/year
Total: ~$29,095/year
Bleemeo — Annual Cost
- 100 agents at 10.99 EUR/month each: 13,188 EUR/year
- With annual reservation (10% discount): 11,869 EUR/year
- Metrics, logs, uptime, dashboards, mobile apps: included
- Automatic discovery and smart alerting: included
- Prometheus and OpenTelemetry support: included
- No server to maintain, no plugins to manage: $0
- Sysadmin time for monitoring maintenance: near zero
Total: ~11,869 EUR/year
What Makes Bleemeo Better
Automatic Discovery
Install our lightweight agent and it automatically discovers services like MySQL, PostgreSQL, Redis, Nginx, Apache, Docker containers, and Kubernetes pods. There are no configuration files to write, no check commands to define, and no daemon reloads to trigger. New services are detected and monitored within seconds of appearing on the host, eliminating the manual object definitions that consume so much time with Nagios.
Cloud-Native Architecture
Built from the ground up for modern, dynamic infrastructure. Bleemeo natively supports Kubernetes clusters, Docker and containerd runtimes, AWS, Azure, and GCP cloud instances. Ephemeral workloads that scale up and down are tracked automatically—no stale host definitions, no phantom alerts, and no manual cleanup scripts required.
Intelligent Alerting
Machine learning-powered anomaly detection automatically learns normal behavior baselines for every metric, so you get alerted on real issues rather than static threshold breaches. Smart alert grouping correlates related incidents to reduce noise, and flexible notification routing sends alerts to the right team via Slack, Microsoft Teams, PagerDuty, SMS, or webhooks—preventing the alert fatigue that plagues Nagios deployments.
Beautiful Dashboards
Modern, responsive dashboards with real-time metric streaming provide instant visibility into your entire infrastructure. Create custom views in minutes with drag-and-drop widgets, interactive time-series charts, and topology maps. Unlike Nagios, there is no need to install Thruk, Grafana, or PNP4Nagios to get usable visualizations.
Mobile First
Native iOS and Android applications let you monitor your entire infrastructure and respond to incidents from anywhere. Receive push notifications the moment an issue is detected, acknowledge alerts, view dashboards, and drill into metric details—all from your phone or tablet, with no VPN required to reach an on-premises Nagios server.
Unified Platform
Metrics, logs, uptime monitoring, and anomaly detection are unified in a single platform. With Nagios, teams typically bolt together separate tools for log management (ELK or Graylog), dashboards (Grafana), and uptime checks (external services), creating a fragmented stack that is expensive to run and difficult to correlate. Bleemeo brings everything together so you can go from alert to root cause in one interface.
Migrating from Nagios is Easy
Sign Up and Install the Agent
Create your free Bleemeo account and install the lightweight agent on each server with a single command. The agent supports Debian, Ubuntu, RHEL, CentOS, Alpine, and most major Linux distributions. Installation takes less than a minute per host:
wget -qO- 'https://get.bleemeo.com?accountId=...'Verify Automatic Discovery
Within seconds of installation, the agent automatically discovers running services such as MySQL, PostgreSQL, Redis, Nginx, Apache, Elasticsearch, Docker containers, and Kubernetes pods. Log into the Bleemeo dashboard to verify that all your critical services are detected and metrics are flowing. For any custom applications, you can add Prometheus-compatible endpoints or custom checks in minutes.
Configure Alerts and Notifications
Set up notification channels—Slack, Microsoft Teams, PagerDuty, SMS, email, or webhooks—through the intuitive web interface. Bleemeo comes with sensible default thresholds for all discovered services, so you get meaningful alerts out of the box. Customize thresholds and routing rules to match your team's on-call structure and escalation policies without editing a single configuration file.
Build Your Dashboards
Create custom dashboards to replicate and improve upon the views you had in Nagios, Thruk, or Grafana. Bleemeo's dashboard builder lets you drag and drop widgets for CPU, memory, disk, network, and application-specific metrics. Share dashboards with your team or display them on wall-mounted screens for real-time operational awareness.
Run in Parallel and Validate
Keep Nagios running alongside Bleemeo for one to two weeks to validate coverage, alert accuracy, and team workflows. Compare the alerts generated by both systems to build confidence that Bleemeo catches everything Nagios does—and more, thanks to anomaly detection and smarter alert grouping. This parallel period also gives your team time to get comfortable with the new interface and mobile apps.
Decommission Nagios
Once your team is confident in Bleemeo's coverage and alerting, make it your primary monitoring platform and decommission Nagios. Remove the Nagios server, uninstall NRPE agents from your hosts, and retire the associated infrastructure. You will immediately free up sysadmin time previously spent on plugin maintenance, configuration file management, and Nagios server upkeep.
What Our Customers Say
Engineers and CTOs trust Bleemeo to monitor their infrastructure
During a short lunch break we installed Bleemeo, created a custom metric, tested alerts, and were ready for production. The speed of deployment is remarkable.

Bleemeo support is simply legendary — fast, knowledgeable, and always there when we need it.
Bleemeo was incredibly fast to deploy. In about an hour we rolled it out across more than 100 servers and immediately gained full visibility into our infrastructure.

We set up monitoring for all our servers in just a few hours. The dashboard is clear, powerful, and genuinely enjoyable to use.

We deployed Bleemeo across our server infrastructure in only a few hours. Uptime monitoring now alerts us instantly whenever a service encounters an issue.

Our Prometheus + Grafana stack had become a maintenance project. With Bleemeo we deployed the agent in minutes and finally focused on using monitoring instead of maintaining it.
After installing the agent, Bleemeo automatically discovered our databases, containers, and services. Within an hour we had full infrastructure visibility — no dashboards or exporters to build.
Bleemeo replaced several monitoring tools with a single platform. Metrics, alerts, and logs are now in one place, saving our team significant time.
Bleemeo gave us immediate insight into our infrastructure without the usual complexity. Within a couple of hours we had metrics, alerts, and dashboards running smoothly.
Setting up Bleemeo was refreshingly simple. The agent deployment took minutes and the automatic discovery saved us days of configuration.
Thanks to Bleemeo, our team now detects issues before our users notice them. The alerting is reliable and the interface makes troubleshooting much faster.
Moving to Bleemeo simplified our monitoring stack dramatically. Instead of managing multiple tools, everything we need is available in a single platform.
Centralizing our logs in Bleemeo drastically simplified troubleshooting. Instead of jumping between tools, we can now correlate metrics and logs instantly to understand what's happening.
Bleemeo made Kubernetes monitoring surprisingly easy. Within minutes we had visibility into our clusters, pods, and workloads without having to build complex dashboards ourselves.
See Bleemeo in action
Watch how teams go from install to full monitoring in under 5 minutes
Frequently asked questions
Can Bleemeo replace Nagios for server monitoring?
Yes. Bleemeo monitors everything Nagios can — servers, services, network — plus containers and Kubernetes. With automatic discovery, you don't need to write check plugins or host definitions.
Do I need to install plugins with Bleemeo?
No. Bleemeo's agent (Glouton) detects and monitors 100+ services automatically. No NRPE, no plugin scripts, no objects.cfg.
How does alerting work compared to Nagios?
Bleemeo includes pre-configured alert thresholds for every discovered service, plus ML-based anomaly detection. Notifications via email, Slack, PagerDuty, or webhooks — no manual rule writing.
Is there a migration path from Nagios?
Yes. Install the Bleemeo agent alongside Nagios, verify coverage, then decommission Nagios once you're confident. Most teams migrate in under a week.
Does Bleemeo support containers and Kubernetes?
Yes. Unlike Nagios which has no native container support, Bleemeo monitors Docker and Kubernetes out of the box with automatic pod and service discovery.
Does Bleemeo include log management?
Yes. Centralized log collection and search included at 0.50€/GiB. No need for a separate ELK stack alongside your monitoring.
Is there a free tier?
Yes. Monitor up to 3 servers for free, forever. All features included — no community vs. enterprise split like Nagios Core vs. Nagios XI.
Does Bleemeo support SNMP and network monitoring?
Yes. Bleemeo monitors network devices and supports SNMP alongside server and application monitoring — all in one platform.
Ready to Leave Nagios Behind?
Join hundreds of engineering teams who have replaced their aging Nagios infrastructure with Bleemeo's modern, cloud-native monitoring platform. Stop spending hours on configuration files, plugin maintenance, and NRPE agent management. Start your free 15-day trial today and experience the difference that automatic discovery, intelligent alerting, and a unified metrics-logs-uptime platform can make for your operations.
No credit card required • Full feature access • Migration support available