A Complete Alternative to Grafana
Grafana is great for visualization, but it's not a complete monitoring solution. You still need Prometheus, Loki, Alertmanager, and Mimir — each with its own operational burden. Bleemeo replaces the entire LGTM stack with a single managed platform.
15-day free trial • No credit card required • No infrastructure to manage
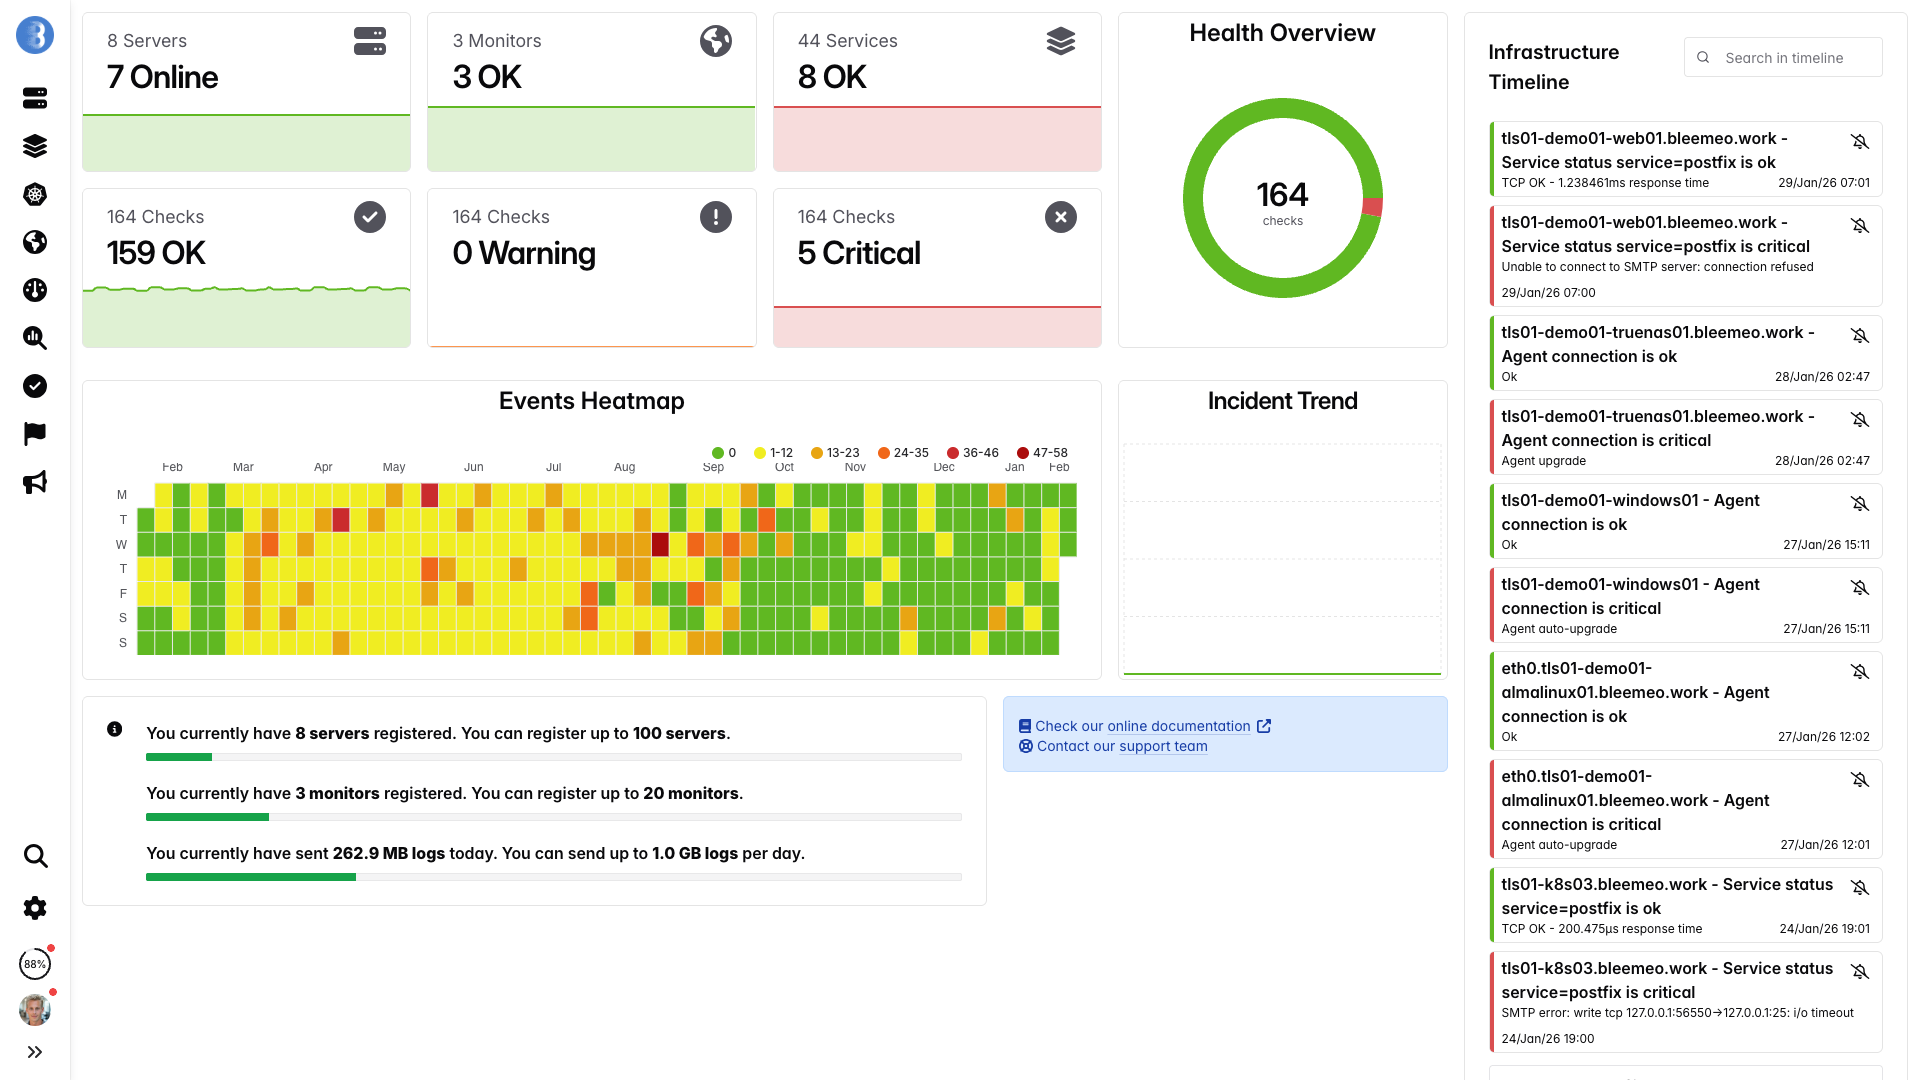
Real-time dashboards, ready in minutes — no configuration needed
The Challenge with Grafana Stack
Multiple Tools to Manage
Grafana is purely a visualization layer and cannot collect a single metric on its own. To build a working monitoring stack, you need to deploy Prometheus for metrics scraping, Loki and Promtail for log ingestion, Alertmanager for notification routing, and potentially Mimir or Thanos for long-term storage. Each of these components has its own configuration syntax, upgrade cycle, and failure modes, meaning your team spends more time maintaining the monitoring platform than actually using it to improve reliability.
Infrastructure Overhead
Running the LGTM stack at scale is a full-time job. Prometheus servers require careful capacity planning for memory and disk, and high-cardinality metrics can cause out-of-memory crashes that take down your entire monitoring system at the worst possible moment. Adding long-term storage with Thanos or Cortex introduces compaction jobs, object storage management, and query federation complexity that grows with every new cluster you onboard.
Complex Setup
Configuring Prometheus service discovery, scrape intervals, relabeling rules, recording rules, and alerting rules requires deep expertise in PromQL and YAML configuration. Alert management is split between Prometheus alerting rules and Alertmanager routing trees, making it difficult to understand who gets notified, when, and why. A single misconfigured relabel rule or silence can cause critical alerts to be silently dropped, leaving your team blind during an incident.
No Built-in Agent
Grafana relies entirely on third-party collectors for data ingestion. You must deploy node_exporter on every Linux server, windows_exporter on Windows machines, blackbox_exporter for endpoint checks, and dozens of application-specific exporters for databases, message queues, and web servers. Each exporter must be installed, configured with the correct flags, registered as a systemd service, and added to Prometheus scrape targets. Managing this fleet of exporters across hundreds of servers becomes a significant operational burden that scales poorly.
Grafana Stack vs Bleemeo
| Feature | Grafana Stack | Bleemeo |
|---|---|---|
| Metrics Collection | Requires deploying Prometheus server plus node_exporter on every host | Built-in lightweight agent with automatic service discovery and zero configuration |
| Log Management | Requires deploying Loki for storage plus Promtail agents on every server for log shipping | Integrated log aggregation and search, collected by the same agent that gathers metrics |
| Alerting | Requires separate Alertmanager with complex routing trees and inhibition rules | Built-in alerting with smart routing, anomaly detection, and escalation policies |
| Infrastructure | Self-hosted components requiring dedicated servers, storage, and ongoing maintenance | Fully managed SaaS platform with no servers to provision or maintain |
| Service Discovery | Manual YAML-based service discovery configuration for each target type | Automatic detection of running services, containers, and processes without configuration |
| Mobile Apps | Web-only interface, no native mobile experience for on-the-go monitoring | Native iOS and Android apps with push notifications for real-time alerting on mobile |
| Uptime Monitoring | Requires deploying and configuring blackbox_exporter with probe modules | Built-in HTTP, TCP, and ICMP monitoring from 7 global locations with latency tracking |
| Scaling | Complex federation or Thanos/Cortex deployment required for multi-cluster scaling | Automatic horizontal scaling, just add agents and the platform handles the rest |
| Maintenance | Manual updates, backup strategies, retention policies, and security patches for every component | Zero maintenance required, automatic updates and managed backups with guaranteed uptime |
| Dashboard Creation | Manual PromQL queries, hours of panel configuration and variable setup per dashboard | Pre-built dashboards for all detected services, ready in seconds with no query writing |
| Prometheus Compatibility | Native Prometheus, but requires full self-managed Prometheus deployment | Scrapes Prometheus exporters natively, no separate Prometheus server needed |
| Data Retention | Default 15 days, long-term requires Thanos or Mimir with object storage | One year retention included, no additional infrastructure or storage configuration |
| Learning Curve | Steep: PromQL, LogQL, Alertmanager routing, relabeling rules, and YAML configuration | Intuitive web interface, productive in hours with no query language required |
Total Cost of Ownership
Grafana Stack
Bleemeo
*With 1-year reservation. Logs billed separately at 0.50€/GiB.
Why Choose Bleemeo
All-in-One Platform
Stop juggling Prometheus, Loki, Alertmanager, Thanos, and Grafana as separate components. Bleemeo delivers metrics collection, log aggregation, uptime monitoring, intelligent alerting, and real-time dashboards in a single integrated platform. Everything works together out of the box, eliminating configuration drift and version incompatibilities between components.
Smart Agent
The Bleemeo agent automatically discovers running services, containers, databases, and web servers on each host. It collects system metrics, application-specific metrics, and logs without requiring you to install or configure separate exporters. One agent replaces node_exporter, process-exporter, and dozens of application-specific exporters, dramatically reducing your deployment surface.
Zero Infrastructure
No Prometheus servers to scale, no Loki clusters to manage, no Thanos compactors to tune, and no components to patch or upgrade. Bleemeo handles all backend infrastructure, including high-availability, data replication, and long-term storage. Your team reclaims the engineering hours previously spent keeping the monitoring stack itself running.
Prometheus Compatible
Already invested in Prometheus exporters and custom metrics? Glouton, the Bleemeo agent, natively supports Prometheus exposition format and can scrape your existing exporter endpoints directly. No separate Prometheus server is needed, making migration gradual and risk-free. Your existing PromQL knowledge and custom metrics are fully preserved.
Intelligent Alerts
Bleemeo includes built-in anomaly detection that learns normal behavior patterns for your infrastructure and alerts you when something deviates. Smart alert routing delivers notifications through email, Slack, PagerDuty, or mobile push notifications without requiring complex Alertmanager routing trees. Threshold-based alerts come pre-configured for common services, so you get meaningful alerts from day one.
Beautiful Dashboards
Bleemeo provides modern, responsive dashboards that are automatically generated for every discovered service. Unlike Grafana where you spend hours crafting PromQL queries and configuring panels, Bleemeo dashboards are ready immediately with sensible defaults. You can still create custom views and drill down into specific metrics, but the out-of-the-box experience covers most monitoring needs without any manual setup.
Easy Transition from Grafana Stack
Migrating from the Grafana stack does not have to be a big-bang cutover. You can run Bleemeo alongside your existing Prometheus and Grafana setup, validate coverage, and gradually decommission components you no longer need. The entire process typically takes less than a week for most teams.
Deploy Bleemeo Agents
Install the Bleemeo agent on each server with a single command. The agent runs alongside your existing Prometheus exporters without conflict and immediately begins collecting system metrics, discovering services, and shipping data to the Bleemeo platform:
wget -qO- 'https://get.bleemeo.com?accountId=...' | sudo bashVerify Coverage
Log into the Bleemeo console and verify that all your servers, containers, and services appear automatically. The agent detects databases like MySQL and PostgreSQL, web servers like Nginx and Apache, message queues like RabbitMQ and Kafka, and many more services without any manual configuration. Compare the discovered services against your existing Prometheus scrape targets to ensure full coverage.
Connect Existing Exporters
If you have custom Prometheus exporters or application-instrumented metrics, configure Glouton to scrape their endpoints directly. Glouton supports standard Prometheus exposition format natively, so your existing custom metrics are preserved without modification.
Set Up Alerts
Configure your notification channels such as email, Slack, PagerDuty, or webhook integrations. Bleemeo comes with sensible default alert thresholds for CPU, memory, disk, and service availability. Review these defaults, adjust thresholds to match your SLOs, and add custom alert rules for application-specific metrics. Many teams find that Bleemeo's built-in anomaly detection catches issues their hand-crafted Alertmanager rules missed.
Validate in Parallel
Run Bleemeo alongside your existing Grafana stack for a validation period. Compare alerts, dashboards, and metric coverage between both systems. This parallel operation ensures you have full confidence in Bleemeo before making any changes to your existing setup. Most teams run both systems for one to two weeks.
Decommission and Simplify
Once validated, gradually decommission the Grafana stack components you no longer need. Remove Prometheus servers, Loki clusters, Alertmanager instances, and the fleet of exporters from your infrastructure. This frees up compute resources, reduces your attack surface, and eliminates the on-call burden of maintaining the monitoring platform itself. Your team can now focus entirely on building and operating your actual product.
What Our Customers Say
Engineers and CTOs trust Bleemeo to monitor their infrastructure
During a short lunch break we installed Bleemeo, created a custom metric, tested alerts, and were ready for production. The speed of deployment is remarkable.

Bleemeo support is simply legendary — fast, knowledgeable, and always there when we need it.
Bleemeo was incredibly fast to deploy. In about an hour we rolled it out across more than 100 servers and immediately gained full visibility into our infrastructure.

We set up monitoring for all our servers in just a few hours. The dashboard is clear, powerful, and genuinely enjoyable to use.

We deployed Bleemeo across our server infrastructure in only a few hours. Uptime monitoring now alerts us instantly whenever a service encounters an issue.

Our Prometheus + Grafana stack had become a maintenance project. With Bleemeo we deployed the agent in minutes and finally focused on using monitoring instead of maintaining it.
After installing the agent, Bleemeo automatically discovered our databases, containers, and services. Within an hour we had full infrastructure visibility — no dashboards or exporters to build.
Bleemeo replaced several monitoring tools with a single platform. Metrics, alerts, and logs are now in one place, saving our team significant time.
Bleemeo gave us immediate insight into our infrastructure without the usual complexity. Within a couple of hours we had metrics, alerts, and dashboards running smoothly.
Setting up Bleemeo was refreshingly simple. The agent deployment took minutes and the automatic discovery saved us days of configuration.
Thanks to Bleemeo, our team now detects issues before our users notice them. The alerting is reliable and the interface makes troubleshooting much faster.
Moving to Bleemeo simplified our monitoring stack dramatically. Instead of managing multiple tools, everything we need is available in a single platform.
Centralizing our logs in Bleemeo drastically simplified troubleshooting. Instead of jumping between tools, we can now correlate metrics and logs instantly to understand what's happening.
Bleemeo made Kubernetes monitoring surprisingly easy. Within minutes we had visibility into our clusters, pods, and workloads without having to build complex dashboards ourselves.
See Bleemeo in action
Watch how teams go from install to full monitoring in under 5 minutes
Frequently asked questions
Can Bleemeo replace the full Grafana stack?
Yes. Bleemeo replaces Grafana, Prometheus, Loki, Alertmanager, and Mimir with a single managed platform. Metrics, logs, dashboards, and alerting are all included.
Do I need to build dashboards from scratch?
No. Bleemeo pre-builds dashboards for every auto-discovered service. Custom dashboards are also available if you need specific views.
Does Bleemeo support Prometheus metrics?
Yes. Glouton, the Bleemeo agent, scrapes Prometheus exporters natively, so existing exporters and custom instrumentation work out of the box.
What about Grafana Cloud?
Grafana Cloud pricing scales with usage (metrics, logs, traces). Bleemeo's per-agent pricing is predictable regardless of data volume — no per-series or per-GB charges.
Can I use Bleemeo alongside my existing Grafana setup?
Yes. You can run Bleemeo agents alongside your current Grafana stack during migration. Glouton operates independently and won't interfere with Prometheus or other collectors.
Does Bleemeo support custom dashboards?
Yes. While Bleemeo pre-builds dashboards for every discovered service, you can also create custom dashboards with drag-and-drop widgets for specific views your team needs.
Is there a free tier?
Yes. Monitor up to 3 servers for free with no time limit. All features included — dashboards, alerts, logs, service discovery.
How does log management compare to Loki?
Bleemeo includes centralized log collection and search at 0.50€/GiB ingested. No separate Loki deployment, no Promtail agents, no storage backend to manage.
Ready to Leave the LGTM Stack Complexity Behind?
Join hundreds of engineering teams who switched from managing Prometheus, Loki, Alertmanager, and Grafana separately to a single platform that just works. Start your free trial today and experience complete infrastructure monitoring without the operational overhead. Deploy your first agent in under five minutes and see metrics flowing immediately.
No credit card required • 15-day free trial • Works alongside your existing Grafana stack • Full feature access