A Simpler Alternative to Centreon
Centreon carries Nagios-era complexity — intricate host templates, a steep-learning-curve web UI, and expensive add-on modules for reporting and topology. Bleemeo replaces all of it with automatic discovery, instant dashboards, and zero infrastructure to maintain.
15-day free trial • No credit card required • Simple per-agent pricing
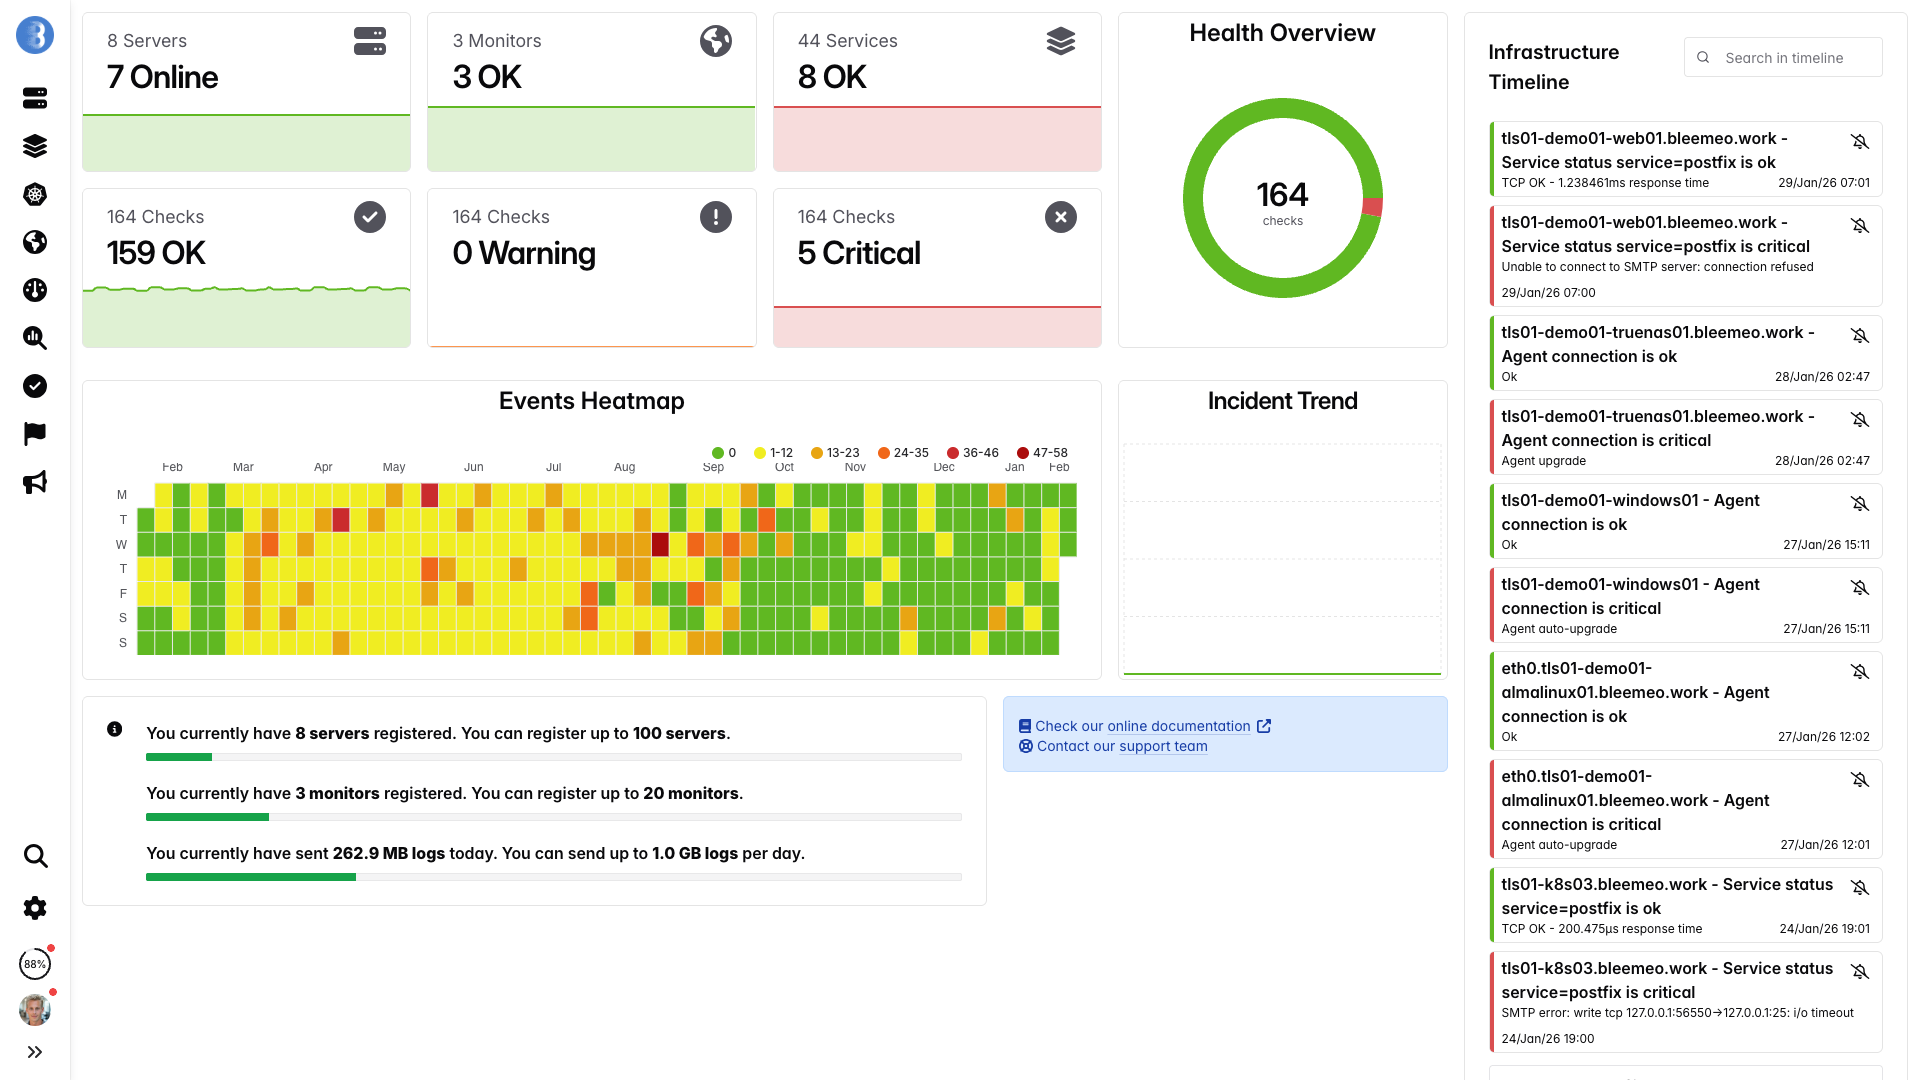
Real-time dashboards, ready in minutes — no configuration needed
Why Teams Choose Bleemeo Over Centreon
Complex Configuration
Centreon requires extensive setup with hosts, services, templates, and deeply nested inheritance hierarchies that quickly become difficult to manage and audit. The plugin ecosystem, inherited from Nagios, relies on community-maintained check scripts that vary widely in quality, documentation, and reliability, often breaking after system upgrades or distribution changes. Teams frequently spend more time debugging monitoring configuration than actually responding to the incidents those monitors are supposed to detect.
High Licensing Costs
Centreon's enterprise features require expensive per-host licenses, and essential add-on modules like MBI for business intelligence reporting and MAP for real-time topology visualization each carry their own significant price tags. The costs scale unpredictably as your infrastructure grows, because each new host, poller, and broker instance adds to the licensing bill. Many organizations discover that the true cost of Centreon is two to three times the initial license quote once they factor in required add-ons, professional services for deployment, and annual maintenance renewals.
Self-Hosted Burden
Managing a Centreon deployment means provisioning and maintaining dedicated servers for the central platform, remote pollers for distributed monitoring, and broker instances for data routing between components. The underlying MariaDB database requires ongoing administration including performance tuning, index optimization, partition management, and regular backup procedures to prevent data loss. When your monitoring scales beyond a single poller, you must architect and maintain a distributed setup with multiple pollers and brokers, adding layers of complexity that demand specialized database and systems administration expertise.
Steep Learning Curve
Training new team members on Centreon typically takes two to three weeks of dedicated effort before they become proficient with the platform's configuration paradigms, template inheritance model, and reporting workflows. The complex multi-step workflows for common tasks such as adding a new host, configuring service checks, and deploying configuration changes to remote pollers significantly slow down day-to-day troubleshooting. Many teams report that onboarding a new engineer onto their Centreon setup requires shadowing an experienced administrator, because the platform's documentation alone is insufficient to navigate the many configuration pitfalls and undocumented behaviors.
Centreon vs Bleemeo
| Feature | Centreon | Bleemeo |
|---|---|---|
| Setup Complexity | Complex host/service templates with deep inheritance hierarchies | One-line agent install with automatic service discovery |
| Pricing Model | Complex per-host licensing with costly MBI and MAP add-ons | Transparent per-agent pricing, all features included |
| Deployment | Self-hosted only, requires dedicated server infrastructure | Fully managed SaaS, no infrastructure to maintain |
| Cloud-Native | Limited Kubernetes support, no native container visibility | Native Kubernetes and Docker container monitoring built-in |
| Mobile Apps | Basic mobile web interface, no dedicated mobile apps | Full-featured native iOS and Android applications |
| User Interface | Dated interface with complex multi-level navigation menus | Modern, intuitive dashboard with clean visual design |
| Log Management | Requires separate ELS product or third-party integration | Built-in log aggregation and full-text search |
| Alerting | Complex escalation policies requiring manual threshold tuning | ML-powered anomaly detection with smart alert grouping |
| Maintenance | Ongoing MariaDB tuning, OS updates, backup procedures | Zero maintenance, fully managed platform and updates |
| Training Time | Two to three weeks of training for basic proficiency | One to two days to become fully productive |
| Prometheus Compatibility | No native Prometheus support, requires external adapters | Native Prometheus exporter scraping and PromQL queries |
| OpenTelemetry Support | No OpenTelemetry integration available | Full OpenTelemetry collector and SDK support |
| Automatic Updates | Manual upgrade process with migration scripts and downtime | Automatic platform updates with zero downtime |
Total Cost of Ownership
Centreon
Bleemeo
*With 1-year reservation. Logs billed separately at 0.50€/GiB.
Bleemeo Advantages
5-Minute Setup
Install our lightweight agent with a single command and start monitoring your infrastructure immediately. Unlike Centreon's multi-step process of defining hosts, assigning templates, configuring services, and deploying configuration to pollers, Bleemeo automatically discovers running services and begins collecting metrics right away. There is no template management, no inheritance hierarchy to design, and no configuration deployment step to worry about.
Transparent Pricing
Bleemeo offers simple per-agent pricing at 10.99 euros per month with every feature included in the base price. Unlike Centreon, there are no separate license tiers, no costly MBI or MAP add-on modules to purchase, and no surprise bills when your infrastructure scales up. You always know exactly what your monitoring will cost, making budget planning straightforward and predictable.
Zero Maintenance
Bleemeo is a fully managed SaaS platform, which means we handle all updates, scaling, backups, and underlying infrastructure for you. Your team no longer needs to dedicate engineering hours to MariaDB performance tuning, partition management, or Centreon version upgrades that can break plugin compatibility. Instead, your operations staff can focus entirely on your applications and business-critical services.
Modern Architecture
Bleemeo was built from the ground up for cloud-native infrastructure, with native support for Docker containers, Kubernetes clusters, and modern cloud platforms like AWS, GCP, and Azure. While Centreon's architecture was designed for traditional on-premise data centers with static host inventories, Bleemeo automatically adapts to dynamic environments where containers and pods are constantly created and destroyed. Our agent natively understands orchestration platforms and provides deep visibility without manual configuration.
Intelligent Alerts
Bleemeo uses machine learning to automatically detect anomalies in your metrics, eliminating the need to manually set and maintain static thresholds for every service check like you would in Centreon. Smart alert grouping correlates related issues across your infrastructure, preventing the notification fatigue that teams commonly experience with Centreon's escalation-based alerting. You get fewer, more actionable alerts that help you resolve incidents faster.
Unified Platform
Bleemeo brings metrics, logs, and uptime monitoring together in a single unified platform, eliminating the need to purchase and integrate separate products for each capability. With Centreon, log management requires either the separate ELS product or a third-party solution like Elasticsearch, adding complexity and cost to your monitoring stack. Bleemeo provides built-in log aggregation, full-text search, and correlation with metrics, giving your team a complete observability solution from a single pane of glass.
Key Features That Replace Centreon
Automatic Service Discovery
The Bleemeo agent automatically detects and monitors over 100 common services including databases, web servers, message queues, and application runtimes. Unlike Centreon where you must manually define each service check and assign it to a host through template inheritance, Bleemeo starts collecting metrics for discovered services immediately with sensible default thresholds and dashboards ready to use.
Real-Time Dashboards
Bleemeo provides beautiful, pre-built dashboards that update in real time with sub-minute granularity. Centreon's legacy graphs and custom views require significant effort to configure and often display data with multi-minute delays due to the poller-broker-central data pipeline. With Bleemeo, you get instant visibility into your infrastructure health without spending hours building and maintaining dashboard configurations.
Prometheus and PromQL Support
Bleemeo's agent (Glouton) natively scrapes Prometheus exporters, allowing you to use your existing exporters and collect Prometheus-compatible metrics seamlessly. You can query all your data using PromQL, the industry-standard query language, and integrate with Grafana for custom visualization needs. Centreon has no native Prometheus compatibility, limiting your ability to adopt modern observability standards.
Uptime and HTTP Monitoring
Monitor your websites, APIs, and public endpoints from multiple global locations with Bleemeo's built-in uptime monitoring. Track response times, SSL certificate expiration, and HTTP status codes without configuring external probes or check commands. Centreon requires dedicated poller infrastructure at each monitoring location and manual configuration of HTTP check plugins for similar functionality.
Log Management and Analysis
Collect, search, and analyze logs from all your servers directly within the Bleemeo platform. Our integrated log management solution lets you correlate log events with metric anomalies, making root cause analysis significantly faster. With Centreon, log management is either unavailable or requires purchasing and deploying a completely separate product, fragmenting your observability data across multiple tools.
AI-Powered Insights
Bleemeo leverages artificial intelligence to detect trends, predict capacity issues, and identify anomalous behavior across your infrastructure before it causes incidents. Our MCP server integration enables teams to interact with monitoring data through natural language queries for faster incident investigation. Centreon relies entirely on static thresholds defined manually by administrators, offering no predictive or intelligent analysis capabilities.
Migrating from Centreon
Migrating from Centreon to Bleemeo is straightforward and low-risk. Most teams complete their full migration in under two weeks by running both systems in parallel during the transition period. Our support team provides dedicated migration assistance to help you map your existing Centreon checks to Bleemeo equivalents and ensure no monitoring gaps during the switchover.
Inventory Your Monitoring
Start by documenting everything you currently monitor in Centreon, including all hosts, services, custom check plugins, and any MBI reports or MAP views your team relies on. Export your host and service lists from Centreon's configuration menu and identify which checks are standard Nagios plugins versus custom scripts specific to your environment. This inventory will serve as your migration checklist and help you verify completeness once the transition is done.
Deploy Bleemeo Agents
Install the Bleemeo agent on each of your servers using our one-line installer. The agent automatically discovers running services like MySQL, PostgreSQL, Apache, Nginx, Redis, and many more without any manual configuration. Within minutes of installation, you will see metrics and health status appearing in your Bleemeo dashboard, covering CPU, memory, disk, network, and all discovered services.
wget -qO- 'https://get.bleemeo.com?accountId=...'Configure Custom Checks
For any specialized monitoring that goes beyond automatic discovery, Bleemeo supports custom Prometheus metrics endpoints, SNMP checks, and custom scripts through our flexible API. If you had custom Nagios plugins in Centreon, you can often replace them with standard Prometheus exporters that are better maintained and more widely supported by the community. Our documentation provides migration guides for the most common Centreon check plugins.
Set Up Alerts
Configure your notification channels including email, Slack, PagerDuty, and webhooks through our intuitive alerting interface. Bleemeo provides intelligent default thresholds for all standard metrics, so most of your alerts will work out of the box without manual tuning. For custom thresholds, our visual rule editor makes it straightforward to define conditions without needing to understand complex escalation chains or notification commands.
Run in Parallel
Operate both Centreon and Bleemeo side by side for one to two weeks to validate that all metrics, alerts, and dashboards are working as expected in Bleemeo. Compare alert outputs between the two systems and verify that Bleemeo catches everything Centreon was detecting. This parallel period gives your team confidence that no monitoring gaps exist before switching over.
Switch Over and Decommission
Once validation is complete, make Bleemeo your primary monitoring platform and begin decommissioning your Centreon infrastructure. Shut down the Centreon pollers, broker instances, and central server, and reclaim the hardware or cloud resources they were consuming. Most teams find that decommissioning Centreon frees up significant server capacity and reduces their monthly infrastructure costs immediately.
What Our Customers Say
Engineers and CTOs trust Bleemeo to monitor their infrastructure
During a short lunch break we installed Bleemeo, created a custom metric, tested alerts, and were ready for production. The speed of deployment is remarkable.

Bleemeo support is simply legendary — fast, knowledgeable, and always there when we need it.
Bleemeo was incredibly fast to deploy. In about an hour we rolled it out across more than 100 servers and immediately gained full visibility into our infrastructure.

We set up monitoring for all our servers in just a few hours. The dashboard is clear, powerful, and genuinely enjoyable to use.

We deployed Bleemeo across our server infrastructure in only a few hours. Uptime monitoring now alerts us instantly whenever a service encounters an issue.

Our Prometheus + Grafana stack had become a maintenance project. With Bleemeo we deployed the agent in minutes and finally focused on using monitoring instead of maintaining it.
After installing the agent, Bleemeo automatically discovered our databases, containers, and services. Within an hour we had full infrastructure visibility — no dashboards or exporters to build.
Bleemeo replaced several monitoring tools with a single platform. Metrics, alerts, and logs are now in one place, saving our team significant time.
Bleemeo gave us immediate insight into our infrastructure without the usual complexity. Within a couple of hours we had metrics, alerts, and dashboards running smoothly.
Setting up Bleemeo was refreshingly simple. The agent deployment took minutes and the automatic discovery saved us days of configuration.
Thanks to Bleemeo, our team now detects issues before our users notice them. The alerting is reliable and the interface makes troubleshooting much faster.
Moving to Bleemeo simplified our monitoring stack dramatically. Instead of managing multiple tools, everything we need is available in a single platform.
Centralizing our logs in Bleemeo drastically simplified troubleshooting. Instead of jumping between tools, we can now correlate metrics and logs instantly to understand what's happening.
Bleemeo made Kubernetes monitoring surprisingly easy. Within minutes we had visibility into our clusters, pods, and workloads without having to build complex dashboards ourselves.
See Bleemeo in action
Watch how teams go from install to full monitoring in under 5 minutes
Frequently asked questions
Can Bleemeo replace Centreon for infrastructure monitoring?
Yes. Bleemeo monitors servers, services, containers, and Kubernetes with automatic discovery. No host templates, service templates, or plugin packs to manage.
Do I need add-on modules like MBI or MAP?
No. Bleemeo includes dashboards, reporting, alerting, and topology views in every plan. No expensive add-on modules or separate licensing.
How does Bleemeo compare to Centreon's pollers?
Bleemeo's agent sends metrics directly to the cloud — no pollers, no broker, no central server. Scales automatically as you add servers.
Is there a migration path from Centreon?
Yes. Deploy Bleemeo agents alongside Centreon, verify automatic discovery covers your services, then decommission Centreon and reclaim the server resources.
Does Bleemeo support containers and Kubernetes?
Yes. Native Docker and Kubernetes monitoring with automatic discovery. No plugin packs or additional configuration required — unlike Centreon where container support is limited.
Does Bleemeo include reporting?
Yes. Dashboards and metrics are available in real-time with 13 months of full-resolution retention. No MBI module required — reporting is included in every plan.
Is there a free tier?
Yes. Bleemeo offers a free tier for up to 3 servers with basic dashboards, email alerts, and 30 days of data retention. For full features — including Slack/Teams notifications, log management, custom metrics, and 13 months retention — paid plans start at 10.99€/month per server.
Can Bleemeo monitor network equipment?
Yes. Bleemeo supports SNMP monitoring for network devices alongside servers, containers, and cloud infrastructure — all from one platform.
Ready for Simpler Monitoring?
Join the growing number of infrastructure teams who have switched from Centreon to Bleemeo and reclaimed hours of engineering time every week. Experience the difference that a modern, cloud-native monitoring platform makes when you no longer have to manage pollers, tune databases, or wrestle with complex template hierarchies. Start your free trial today and see your entire infrastructure monitored in minutes, not weeks.
No credit card required • Migration assistance available • Cancel anytime