Mobile Monitoring Apps
Stay connected to your infrastructure wherever you are. Purpose-built native mobile apps for iOS and Android deliver full monitoring capabilities in your pocket — real-time dashboards, instant push notifications, alert management, container monitoring, and infrastructure search, all optimized for touch interaction. Available free on the App Store and Google Play with every Bleemeo plan.
See It In Action
Real screenshots from the Bleemeo iOS app showing the home dashboard, server metrics, container monitoring, and uptime monitors
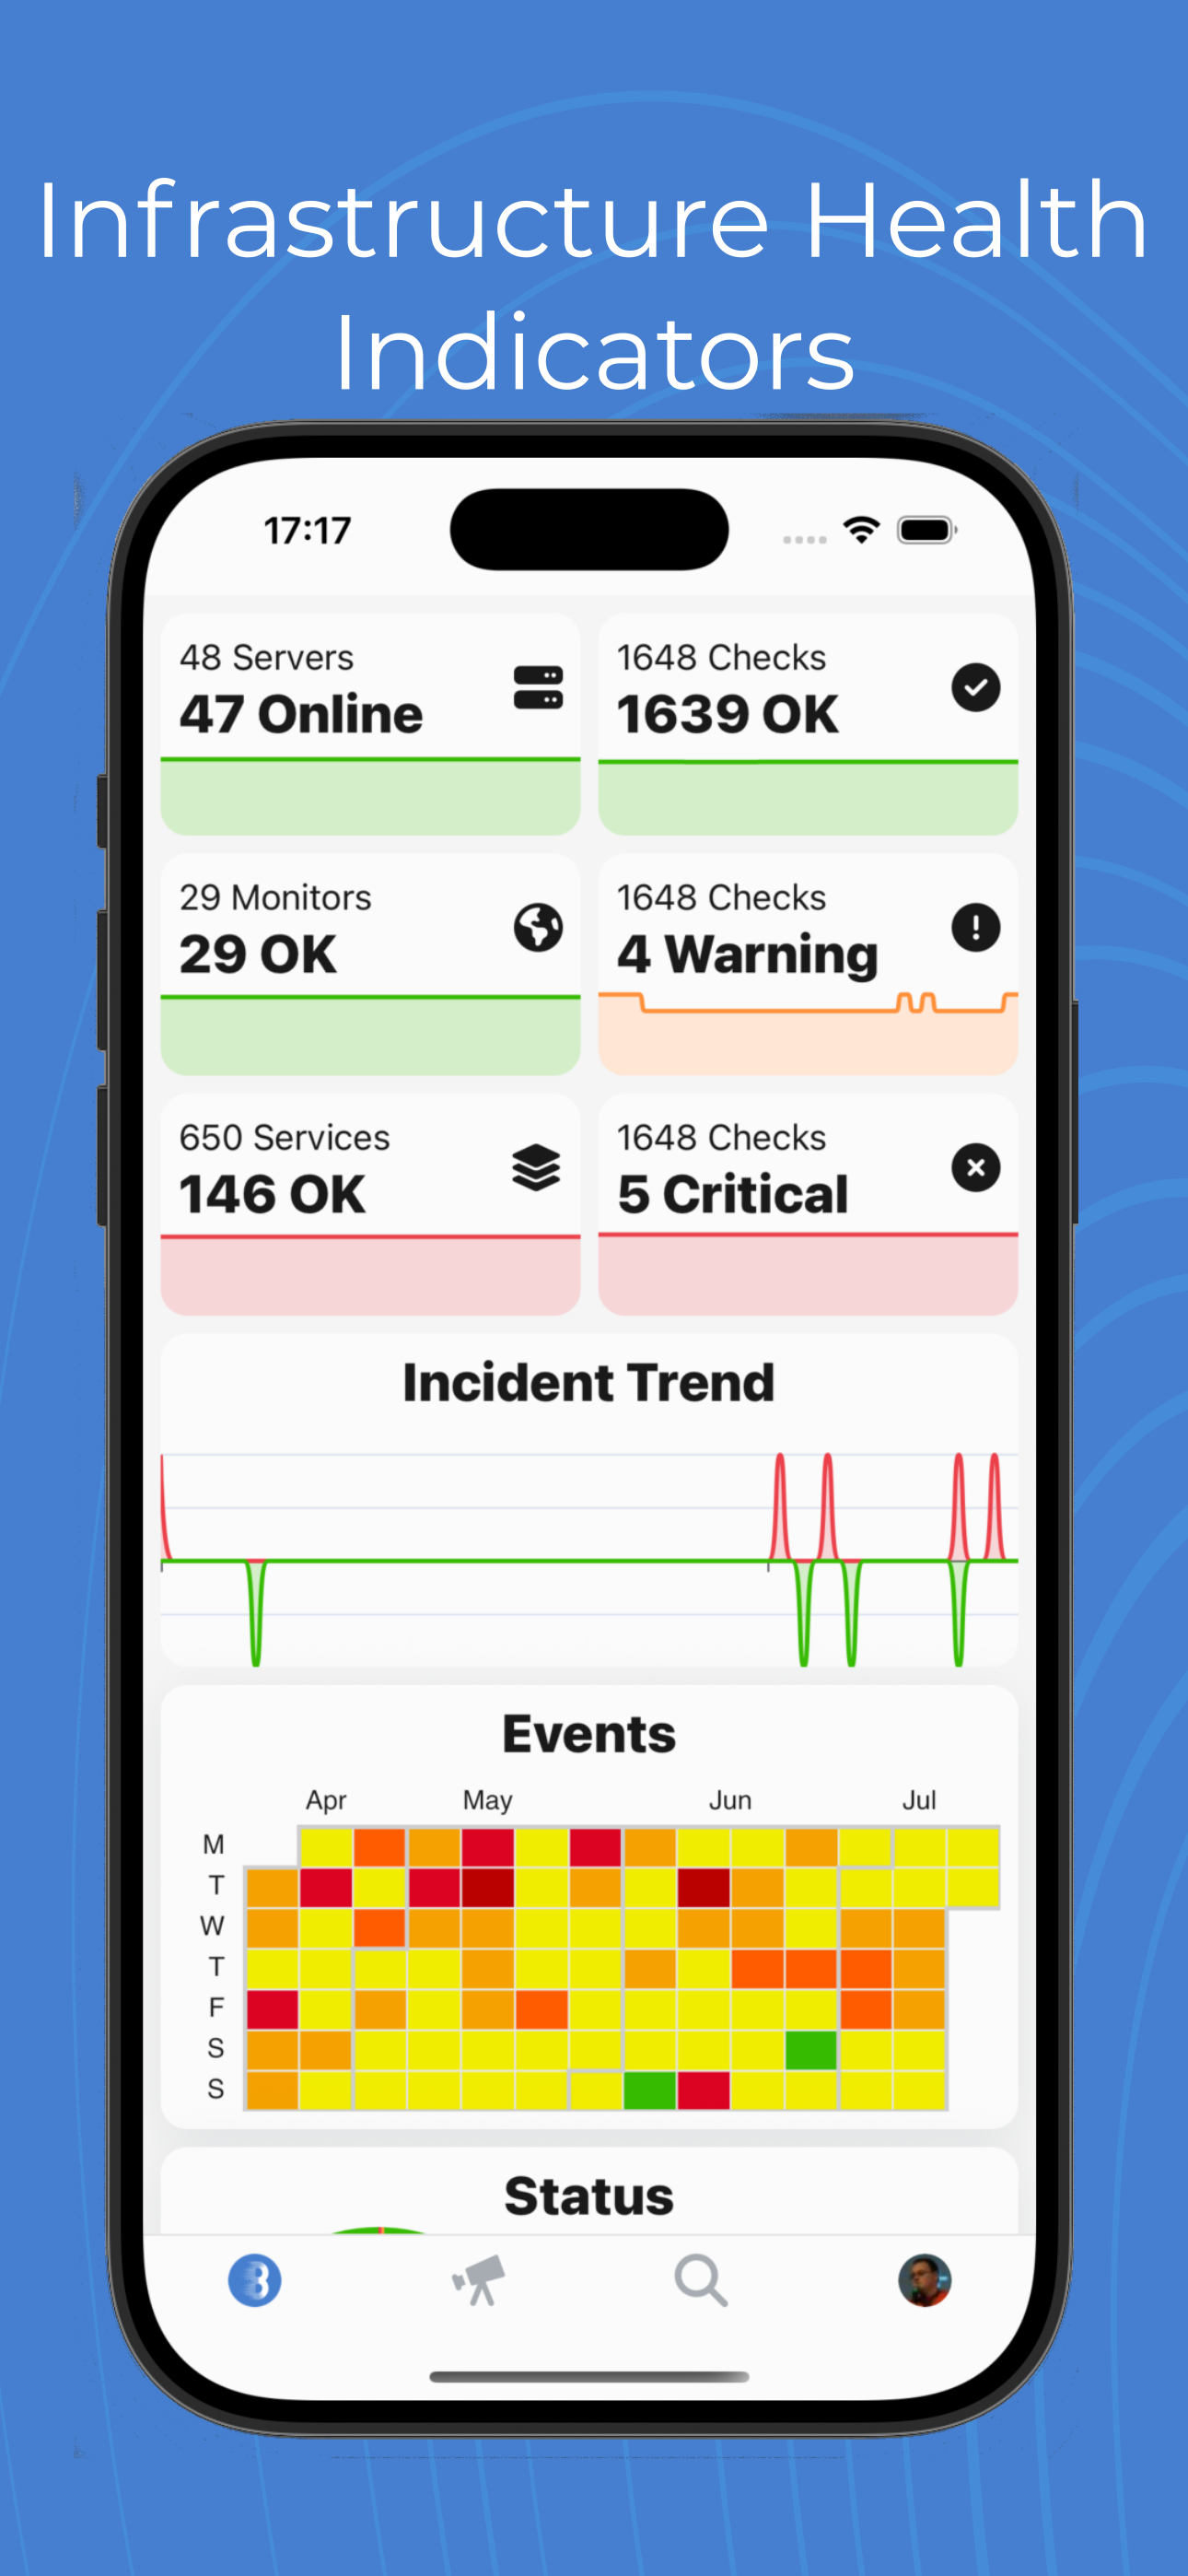
Home Dashboard
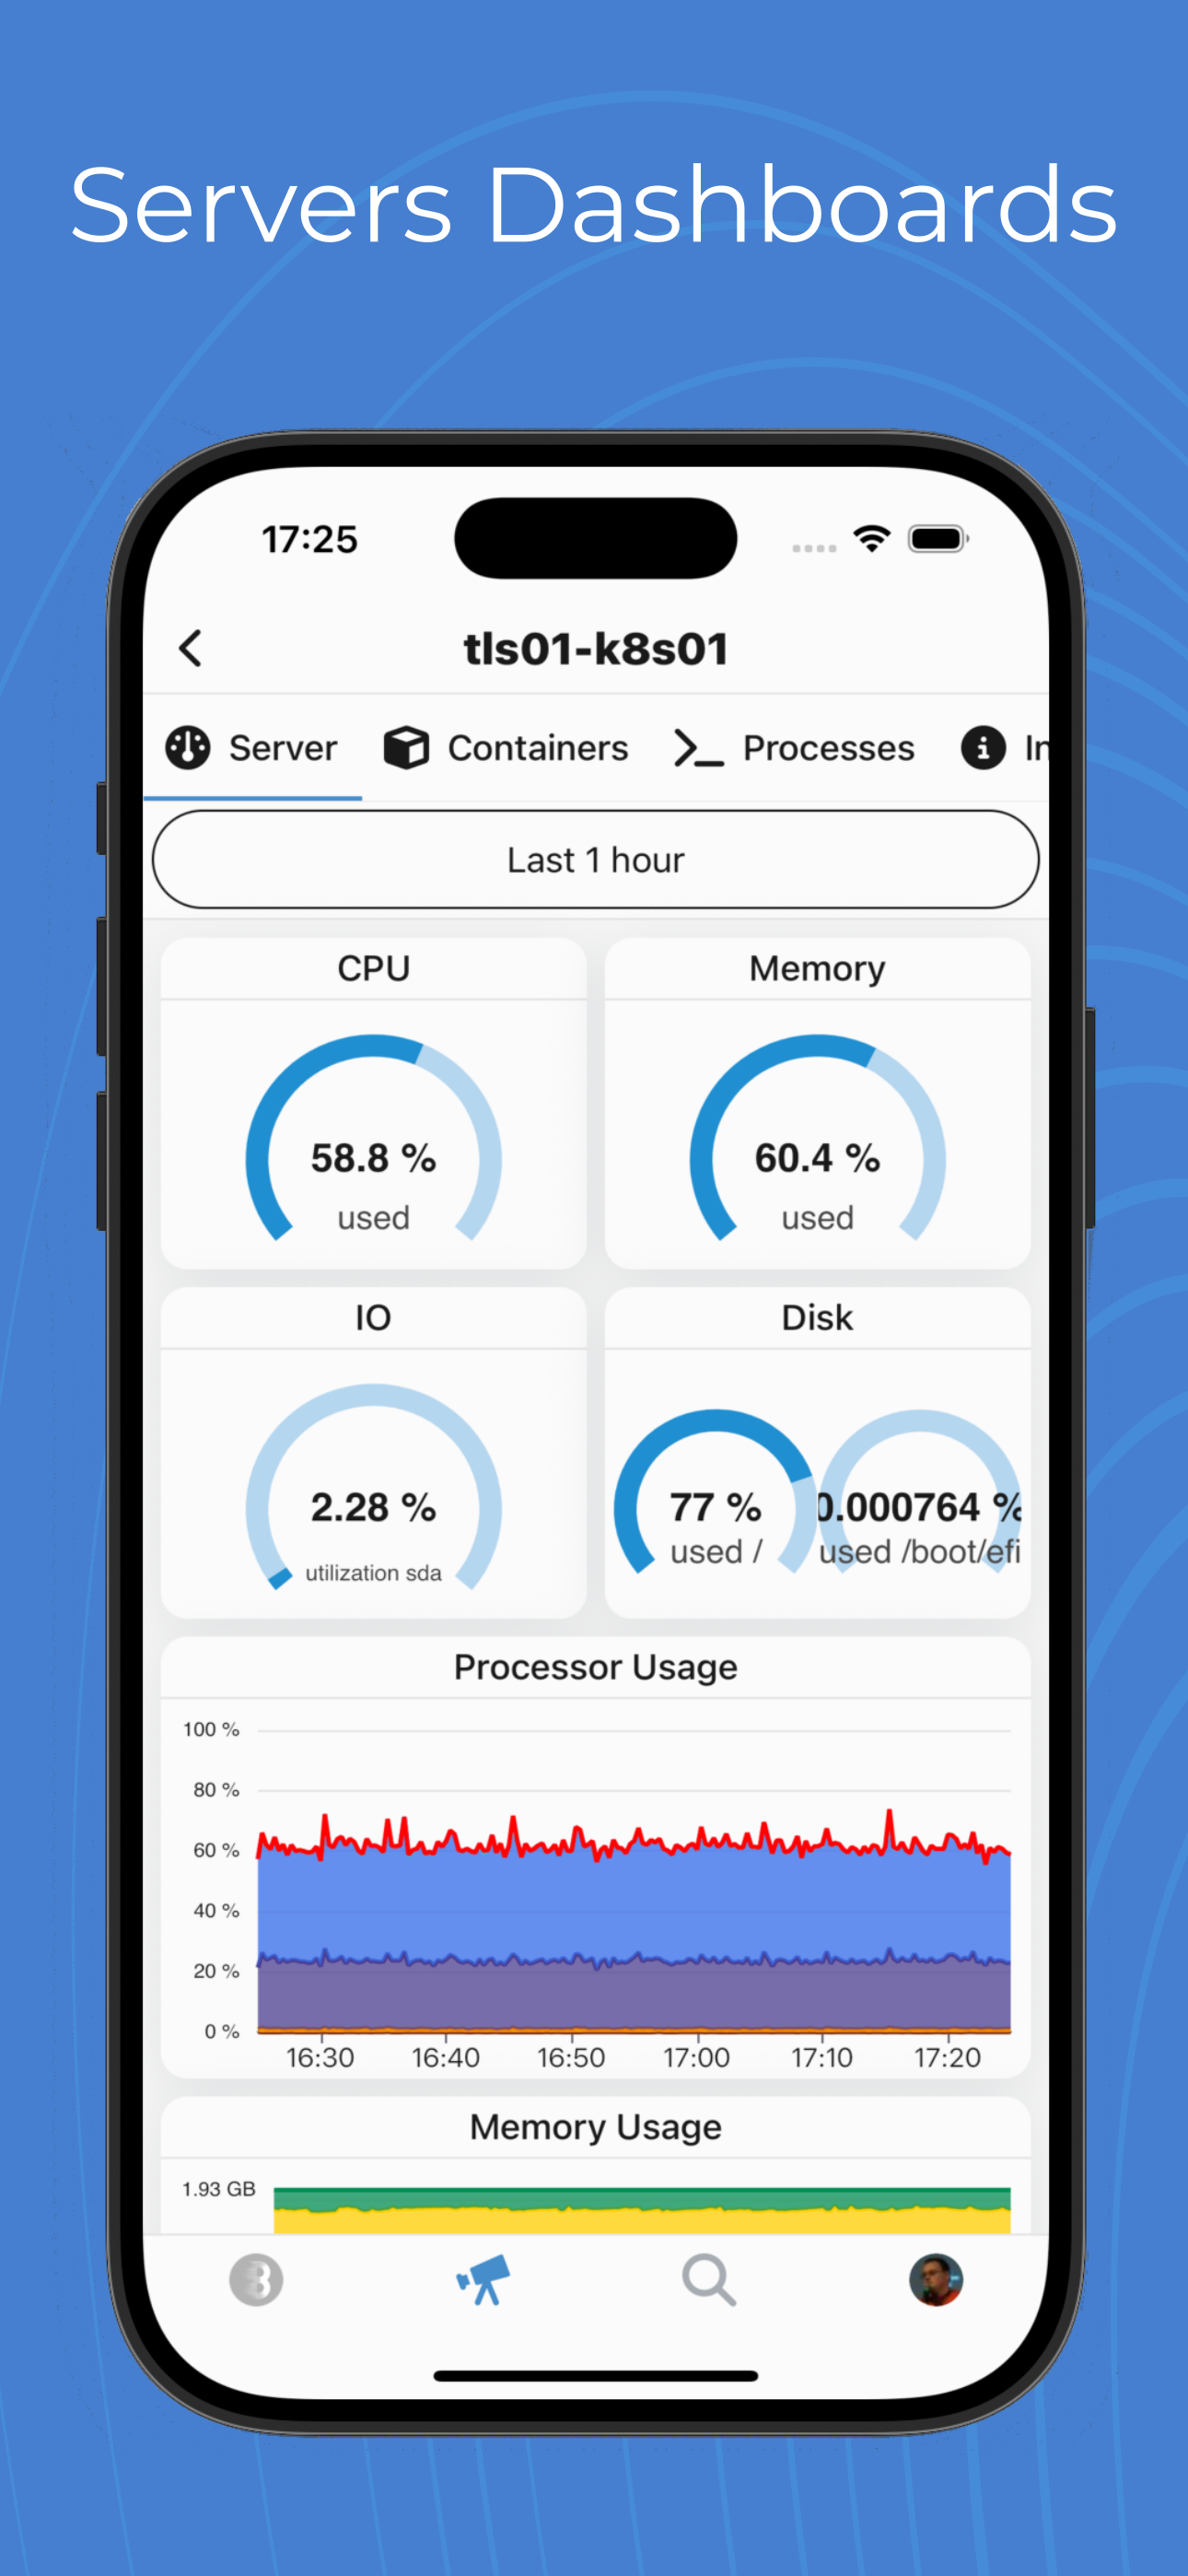
Server Dashboards
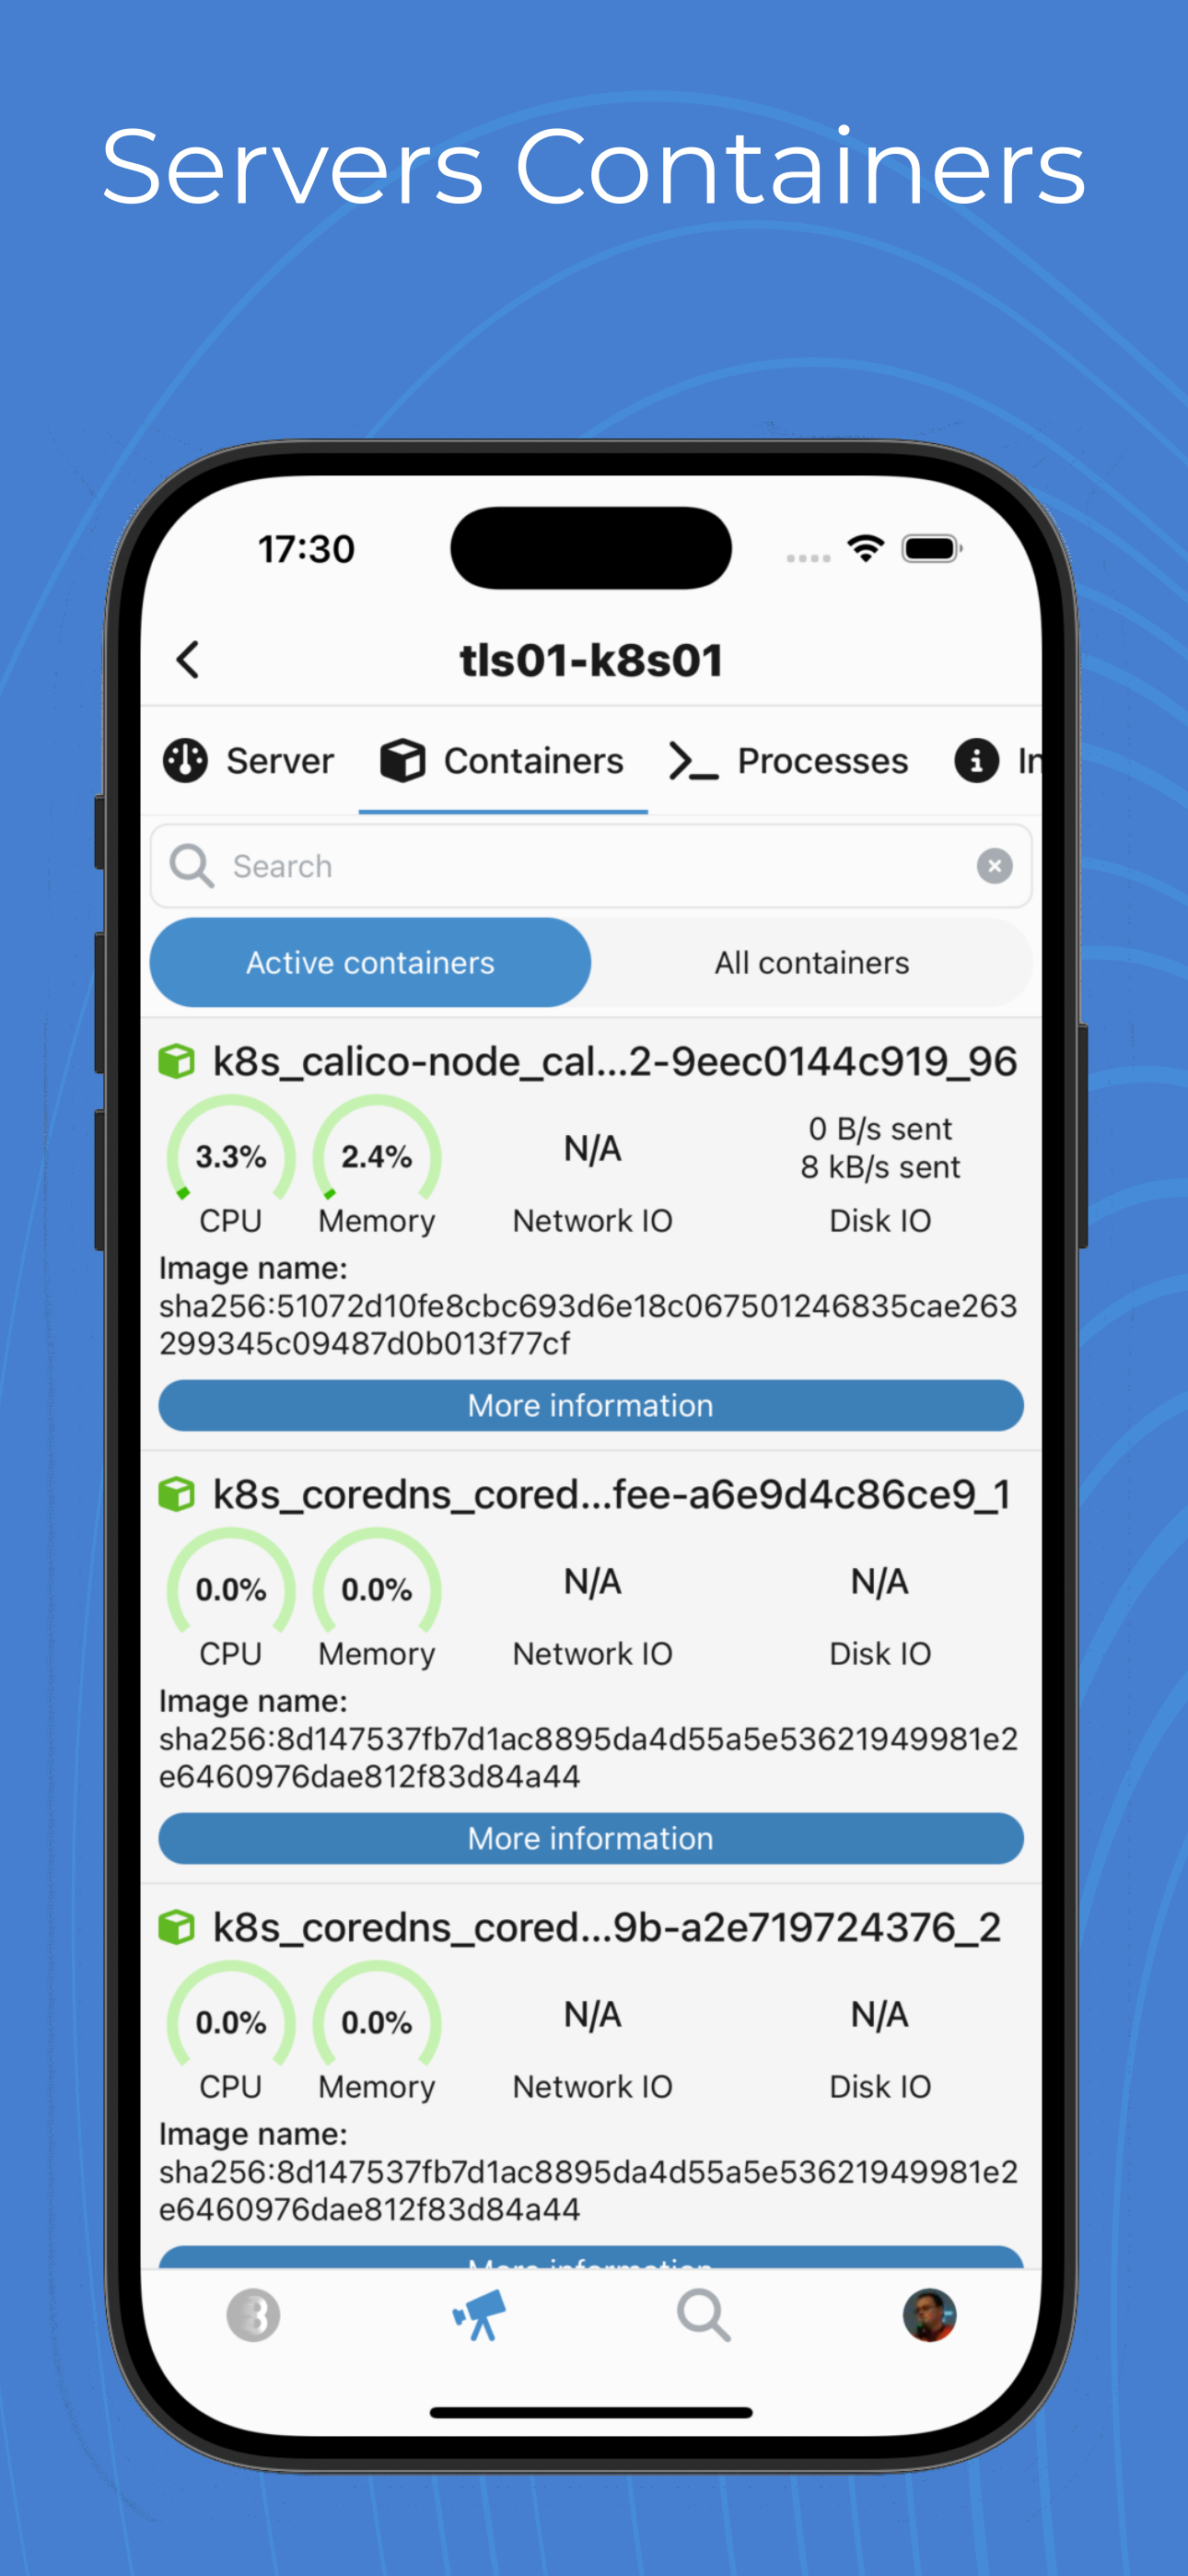
Container Monitoring
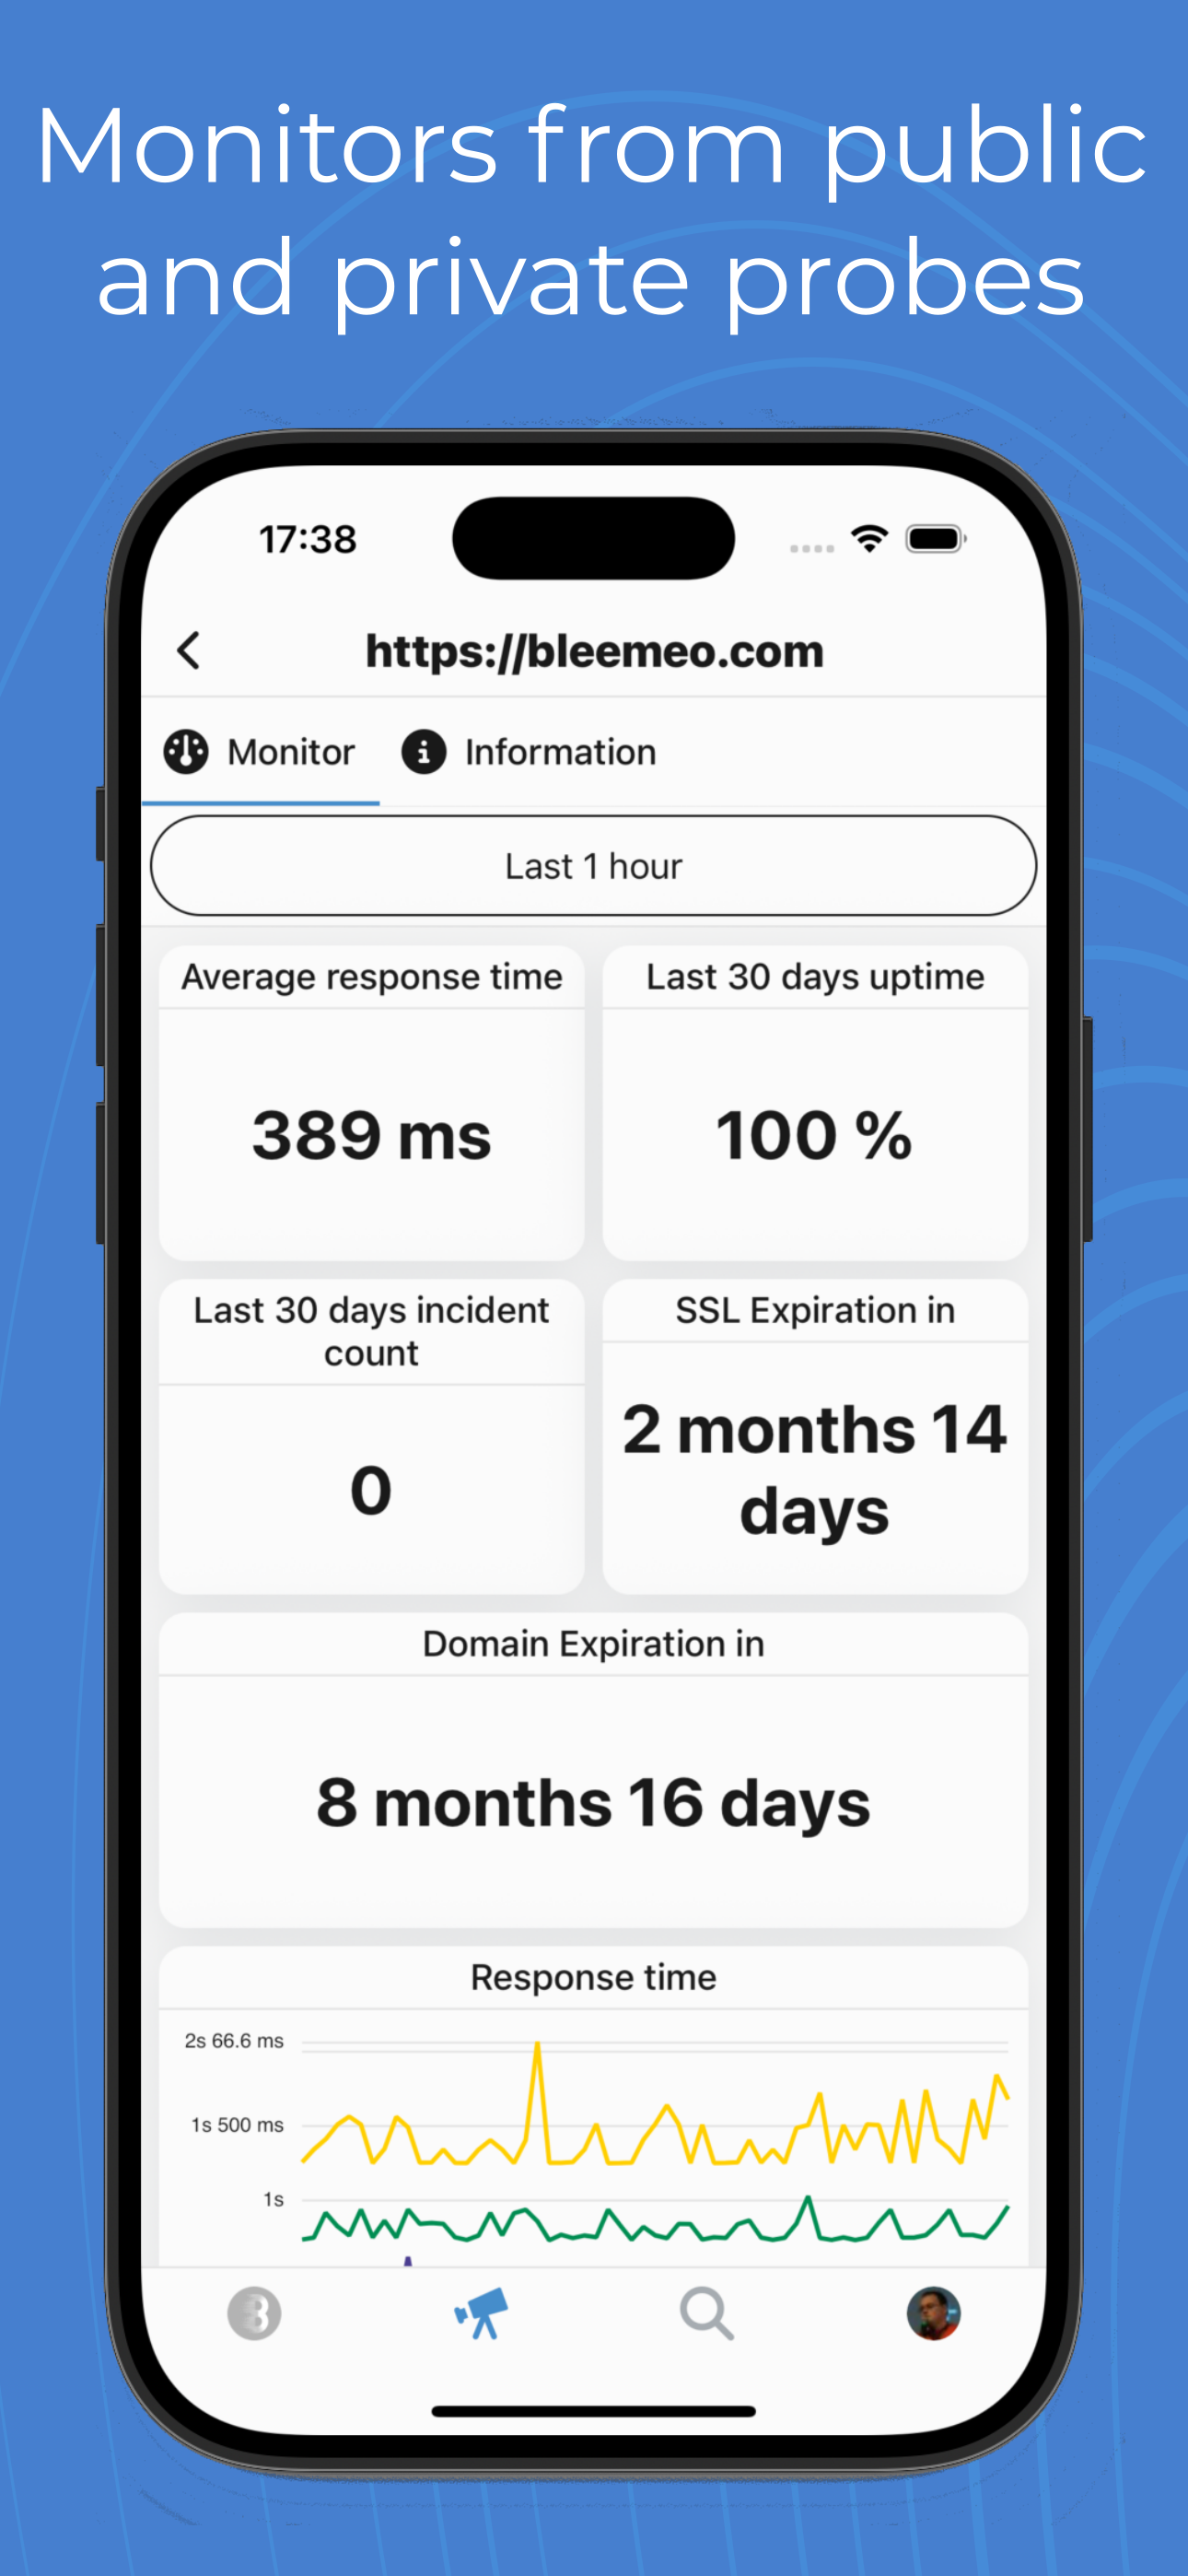
Uptime Monitors
Your Infrastructure in Your Pocket
The Bleemeo mobile app gives on-call engineers and ops teams full visibility into their infrastructure from anywhere. Whether you are commuting, traveling, or simply away from your desk, you can check the health of every server, container, and service in your environment with just a few taps. Real-time push notifications ensure you know about critical issues within seconds, so you never miss an alert that matters. The moment something goes wrong, your phone buzzes with the details you need to start investigating immediately.
The Home Dashboard shows an infrastructure health heatmap at a glance, with server and service status counts so you can immediately see if something is wrong. Color-coded indicators let you distinguish between healthy, warning, and critical states without reading a single number. All your custom dashboards are available on mobile too, automatically adapted for smaller screens with touch-friendly interactions: pinch to zoom on any chart, swipe left or right to navigate time ranges, and tap any data point to reveal the exact metric value at that moment.
The app is read-only by design for safety. Monitoring and investigation are fully supported, but configuration changes require the web panel. This deliberate choice prevents accidental modifications during stressful incidents, when a misplaced tap could silence a critical alert or change a threshold. You can browse servers, inspect metrics, view dashboards, and read event logs, but destructive or configuration actions are reserved for the full web interface where you have a larger screen and more precise input controls.
The Event Timeline provides a searchable, filterable history of every infrastructure event, which is invaluable during post-incident reviews. Filter by severity, time range, or affected resource to reconstruct exactly what happened and when. Combined with the ability to view historical metric data on any dashboard, the mobile app gives you the context you need to understand incidents thoroughly, even hours or days after they occurred.
How It Works
Mobile App Features
Push Notifications
Get instant alerts on your phone when critical issues arise. Tap to see details, metric values, and related charts directly from the notification. Configure severity-based notification sounds and Do Not Disturb override for critical alerts so you always know when something truly urgent demands your attention. Notifications are delivered through Apple Push Notification service and Firebase Cloud Messaging for reliable, battery-efficient delivery.
Real-Time Dashboards
View all your custom dashboards optimized for mobile screens. Pinch to zoom on charts, swipe to navigate between time ranges, and tap data points for detailed values. Dashboards refresh automatically with the latest metrics, giving you the same real-time visibility you get on desktop, wherever you are. Time range selection supports the same options as the web interface, from last 15 minutes to last 13 months.
Quick Search
Find any server, service, container, or metric instantly with type-ahead suggestions. Search by name, IP address, or tags to locate exactly what you need. Results appear as you type, making it easy to check on specific resources during incidents without scrolling through long lists.
Alert Management
View active alerts, acknowledge incidents, and add comments directly from your phone. See alert history, related events, and the full context of each issue without switching to a desktop. Coordinate your team's response on the go with shared comments and acknowledgment status visible to everyone.
Container Monitoring
Monitor Docker containers and Kubernetes pods from your mobile device. See container CPU, memory, and network usage with the same level of detail as the web interface. Quickly identify resource-hungry containers and track restart counts to spot stability issues before they escalate.
Uptime Monitors
Check the availability and response times of your uptime monitors from all probe locations worldwide. See status history and identify regional issues at a glance. Whether it is an HTTP endpoint, a TCP port, or an ICMP ping, you get full visibility into your service availability from your phone.
Full Monitoring On The Go
Monitor Infrastructure
- View all servers and services
- Check current status
- See resource utilization
- Track performance trends
- Browse Docker containers
- View process information
- Server hardware details
Manage Alerts
- View active alerts
- Acknowledge incidents
- Add comments
- View alert history
- Filter by severity
- View related metrics
Access Dashboards
- All your custom dashboards
- Real-time metric updates
- Interactive charts
- Time range selection
- Tag-based grouping
- Pinch-to-zoom charts
Team Collaboration
- Share dashboards
- Comment on alerts
- Coordinate responses
- Track team activity
- Role-based access
- Per-user notifications
A Full Monitoring Experience, Not a Simplified View
Unlike many monitoring tools that offer a stripped-down mobile experience, the Bleemeo app delivers the same depth of information as the web interface. When you open a server, you get swipeable views covering system metrics (CPU, memory, disk, network), Docker containers running on that host, live process information with resource usage, and detailed server hardware information. Every chart is interactive — tap a data point to see the exact value and timestamp.
Your custom dashboards appear on mobile automatically grouped by tags, so you can quickly find dashboards for specific environments (production, staging) or teams (platform, database). The same PromQL-powered widgets you built on the web render on mobile with touch-optimized interactions. Time range selection works with familiar gestures — swipe left to go back in time, pinch to zoom in on a specific period.
The Status Center consolidates all current issues into a single view: servers with problems, services that are down, containers that have restarted, and uptime monitors reporting failures. This is the view most on-call engineers check first when they receive an alert — it immediately shows the scope of the problem and whether multiple systems are affected.
Perfect for On-Call Engineers
🚨 Instant Alerts
Critical alerts can override Do Not Disturb with custom notification sounds and vibration patterns. Configure different sounds for warning vs critical severity so you know the urgency before you even look at your phone. This ensures that truly critical infrastructure issues always reach you, day or night, without relying on checking a dashboard.
📊 Quick Triage
View CPU, memory, disk, and network metrics immediately when tapping an alert. See related containers and services to quickly understand the blast radius of an issue. Within seconds of receiving a notification, you have the context to decide whether this requires immediate action or can wait until morning.
✅ Fast Response
One-tap acknowledgment tells your team you are handling the issue, preventing duplicate effort and reducing confusion. Add comments to share your initial findings and coordinate response without switching to a laptop. Your teammates see your acknowledgment and notes in real time, keeping everyone on the same page during critical incidents.
🔍 Deep Dive
Access the full event timeline, server dashboard, and service metrics for thorough investigation. View historical data to understand if this is a recurring pattern or a new issue. Cross-reference events across multiple servers and services to identify the root cause, all from your mobile device while you work toward resolution.
Available on All Platforms
Free to download with every Bleemeo plan, including the free trial. Sign in with your existing account and start monitoring immediately.
📱 iOS
iOS 14.0 or later
iPhone, iPad, iPod touch
Face ID / Touch ID, push notifications, offline support
Download on App Store →🤖 Android
Android 8.0 or later
All Android devices
Biometric auth, push notifications, data saver mode
Get it on Google Play →Want to go further?
Read the DocumentationFrequently Asked Questions
Everything you need to know about Bleemeo's mobile apps
What platforms are supported?
Bleemeo offers native apps for both iOS (iPhone, iPad, iPod touch running iOS 14.0 or later) and Android (devices running Android 8.0 or later). Both apps are free to download from the App Store and Google Play. The apps are optimized for each platform's design guidelines and take advantage of native features.
How do push notifications work?
When you enable push notifications, the app receives instant alerts when issues occur in your infrastructure. You can configure which alerts trigger push notifications, set different notification sounds for different severities, and use Do Not Disturb schedules. Critical alerts can override quiet hours if needed. Tapping a notification opens the relevant detail view.
Can I view all my dashboards on mobile?
Yes, all your custom dashboards are accessible on mobile. The app automatically adapts dashboard layouts for smaller screens. You can pinch to zoom on charts, swipe to navigate between time ranges, and interact with graphs to see detailed values. Real-time updates work the same as on desktop - dashboards refresh automatically with the latest metrics.
What can I do when I receive an alert?
When you receive an alert, you can: View details including the metric that triggered it and current values, see related metrics and charts for context, acknowledge the alert to inform your team you're handling it, add comments for collaboration, view alert history for the affected resource, and access the full server/service dashboard for deeper investigation.
Is the app included in all plans?
Yes, the mobile apps are included at no extra cost with all Bleemeo plans, including the free trial. You can download and use the apps immediately after creating your Bleemeo account. All features - dashboards, alerts, notifications, search - are available on every plan. There are no mobile-specific limitations or premium tiers.
How do I log in to the mobile app?
Download the app and sign in with your Bleemeo account credentials (email and password). If your organization uses SSO (Single Sign-On), that's also supported. The app securely stores your session, so you don't need to log in repeatedly. You can enable biometric authentication (Face ID, Touch ID, fingerprint) for quick access while maintaining security.
Can multiple team members use the app?
Yes, any team member with a Bleemeo account can install and use the mobile app. Each person logs in with their own credentials and sees resources according to their role-based permissions. Push notifications are personalized - each user only receives alerts based on their configured notification rules. This is perfect for distributed on-call teams.
Is the app optimized for on-call use?
Yes, the app is designed with on-call engineers in mind. Features include: High-priority notifications that can override Do Not Disturb, quick triage views showing essential metrics immediately, one-tap alert acknowledgment, ability to see related alerts and potential root causes, and offline support for viewing recently accessed data without network connectivity.
Does the app use a lot of data or battery?
The app is optimized for minimal battery and data usage. Push notifications use standard platform services (APNs/FCM) which are highly efficient. Data is only fetched when you open the app or a specific view. Charts and dashboards load incrementally. You can optionally enable data saver mode to reduce image quality and refresh rates when on cellular networks.
Can I search for specific servers or metrics?
Yes, the app includes powerful search. You can search for servers by name, IP, or tags; find specific services or containers; locate dashboards by name; and search for metrics. Results are instant with type-ahead suggestions. This makes it easy to quickly check on a specific resource when you're away from your desk or responding to an incident.
Monitor Anywhere, Anytime
Download the mobile app and stay connected to your infrastructure. Available at no extra cost with every Bleemeo plan, including the free trial. Full monitoring capabilities, real-time push notifications, and interactive dashboards — all in your pocket.