 Published on 30 April 2019 by Camille Eid-Centenero
In order to carry out a demonstration of our smart tool: the Bleemeo agent at the 8th Devoxx France conference planned for the 17th of April, the Bleemeo team decided to use the Kubernetes infrastructure and specially the lightweight version of Kubernetes: k3s. We chose to run k3s on a cluster of 3 Raspberry Pi nodes composed of 1 control plane node and 2 worker nodes. To show the use of our agent, we decided to run different apps: a load generator to observe the impact of charge on our cluster thanks to the Bleemeo agent and Quote a little app run on Nginx and PostgreSQL.
This first article is dedicated to assembling the Raspberry Pi cluster and deploying Kubernetes on it. A next article will describe how we setup Bleemeo agent to monitor the full stack (machines, Kubernetes and application running on it).
Here is the physical representation of the infrastructure:
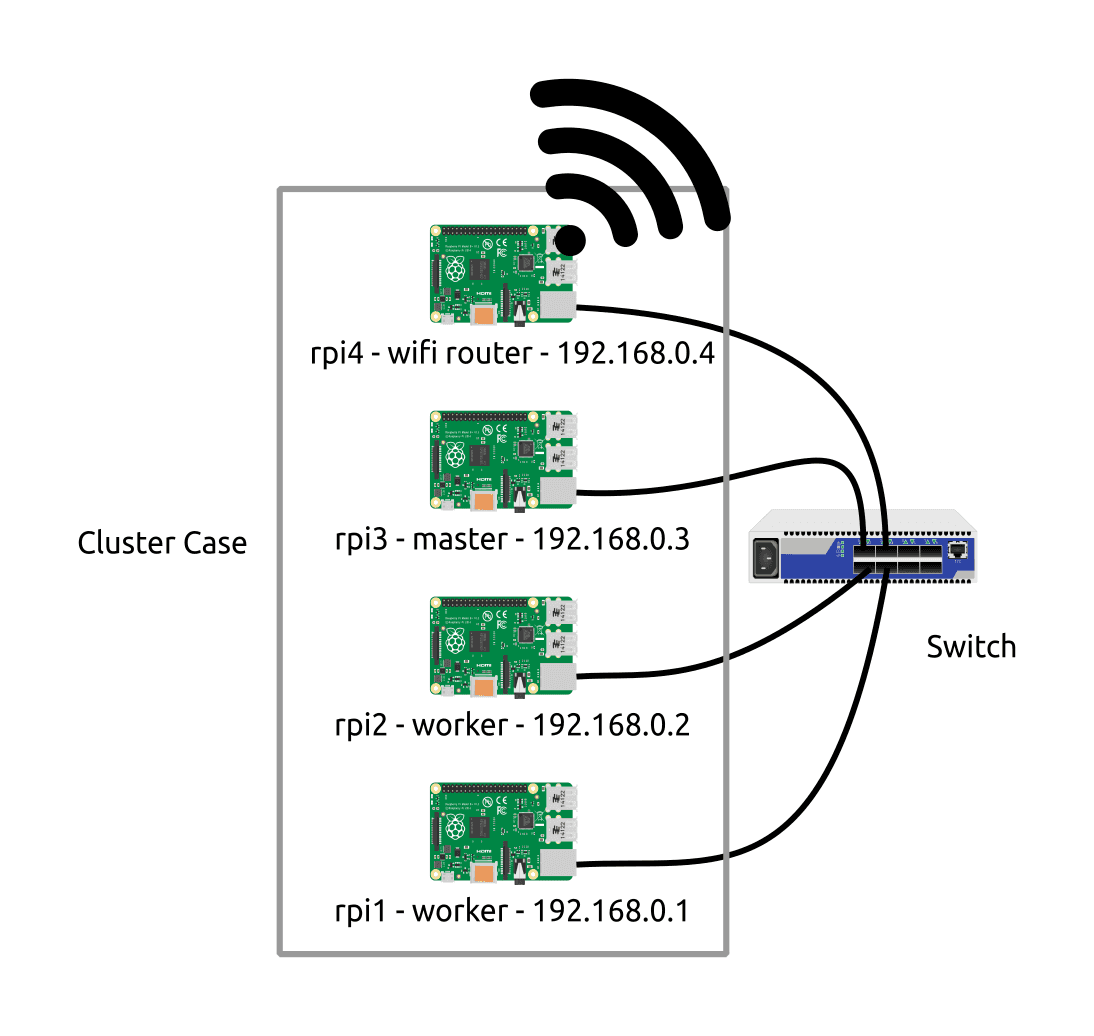
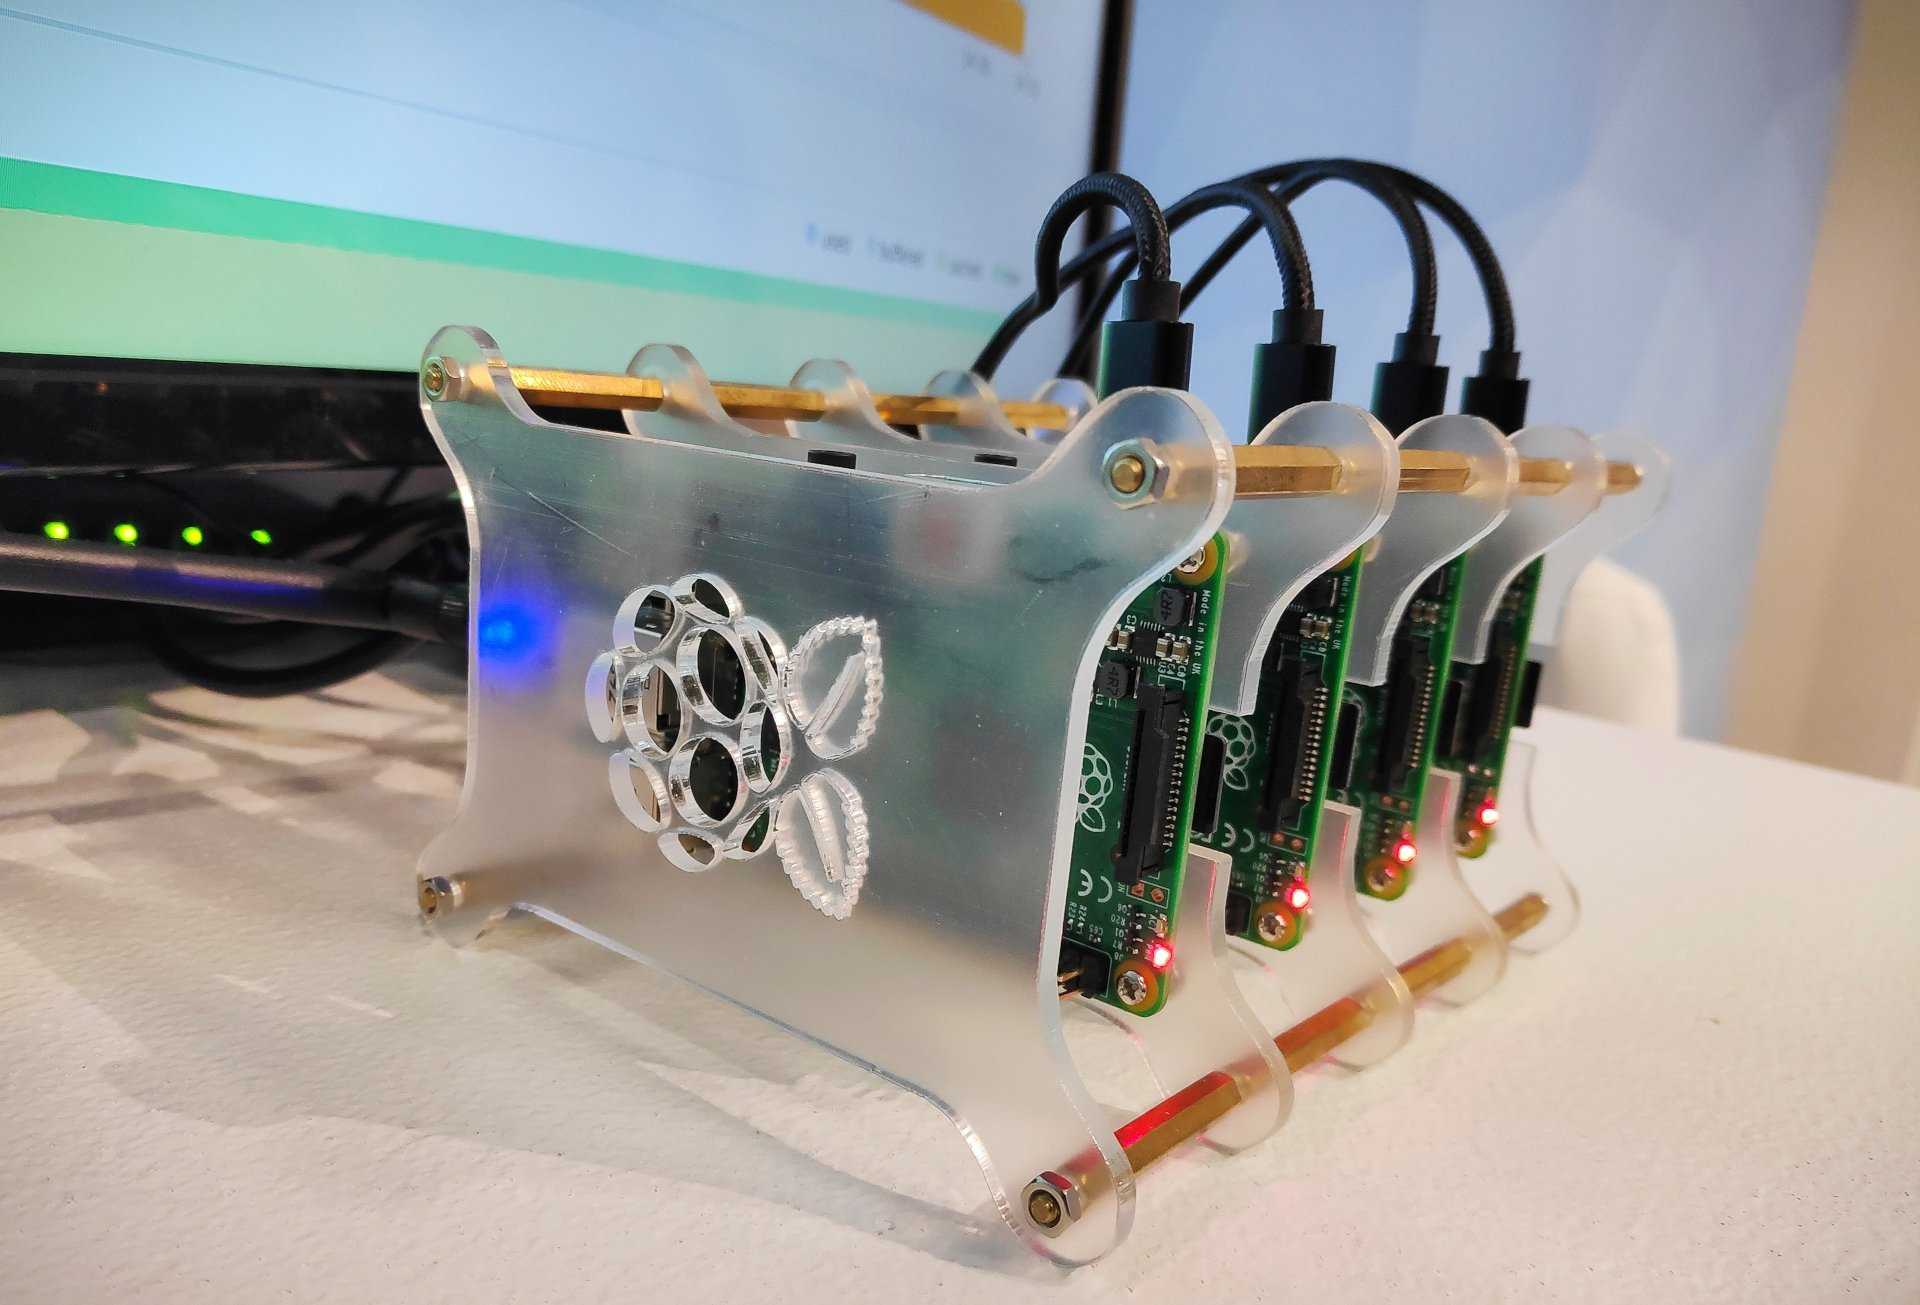
This cluster was physically done with a cluster case, a 5 ports switch, a power supply and another Raspberry Pi for the WiFi access so we'll put pictures and different links from the vendor below.
As you can see there are 4 Raspberry Pi in the cluster case. The latest micro-controller will grab the hotspot WIFI to spread it us at the conference with 2 small WIFI antenna.
This is just an example on how you can set up a Kubernetes cluster and how you can pull metrics from it.
Preparing and assembling the cluster
Here is the list of material we purchased to build our cluster:
- 4 × Raspberry Pi 3 model B
- 4 × SD CARD SanDisk
- 4 × Small USB (20cm)
- 5 × Small network cables (25cm)
- 1 × 5 ports switch
- 1 × Power 5 USB ports
- 2 × Wifi antena
- 1 × Cluster Case
For the operating system, we choose to put the long-term support of ubuntu server on the Raspberry Pi. Exactly the 18.04.2 with preinstalled server for ARMHF. You can have it here:
If you are on ARM64 for Raspberry Pi 3B/3B+, please download this image:
If you want to know your system architecture, please run:
$ dpkg --print-architecture
ARMHF (HardFloat) supports 32-bit devices using version 7 of the ARM architecture specification. ARM64 supports the latest 64-bit ARM-powered devices.
Once you have it, you can write this ubuntu image on all of the SD cards with this command:
$ xzcat ubuntu.img.xz | sudo dd bs=4M of=/dev/mmcblk0
At the first boot, the login username is "ubuntu" and the password is also "ubuntu". On the first login, you will be asked to change the password. The operating system is now ready, you should now go on your personal device/laptop to realize the ssh connection between your own system and the different Raspberry Pi. To do that please note the IPs addresses of them and do on your laptop:
$ ssh username@IP
And enter the password you just choose before. You can now manage the nodes remotely.
Naturally and to facilitate the process, the control plane and the worker nodes have to be in the same subnet.
As an example, we will use the following IPs:
- ControlPlane1: 192.168.0.1/24
- Worker1: 192.168.0.2/24
- Worker2: 192.168.0.3/24
You can use the IP delivered by your provider/router so the different IPs will be delivered automatically by the DHCP. Or you can fix the IPs to contact your nodes. To fix the IP address of a node please go on the network plan configuration present here: /etc/netplan/01-netcfg.yaml . And replace the addresses in parentheses. You can also set the value of DHCP to "no".
network:
  version: 2
  renderer: networkd
  ethernets:
    ens5:
      dhcp4: no
      addresses: [192.168.0.1/24]
      gateway4: 192.168.1.254
      nameservers:
        addresses: [8.8.4.4, 8.8.8.8]
You can try the configuration before apply it with:
$ sudo netplan try
If it succeeds, you will see "Configuration accepted" And then you can apply it:
$ sudo netplan apply
Warning, when you change the IP address of a node you will temporarily loose your ssh access until you reconnect it with the new IP.
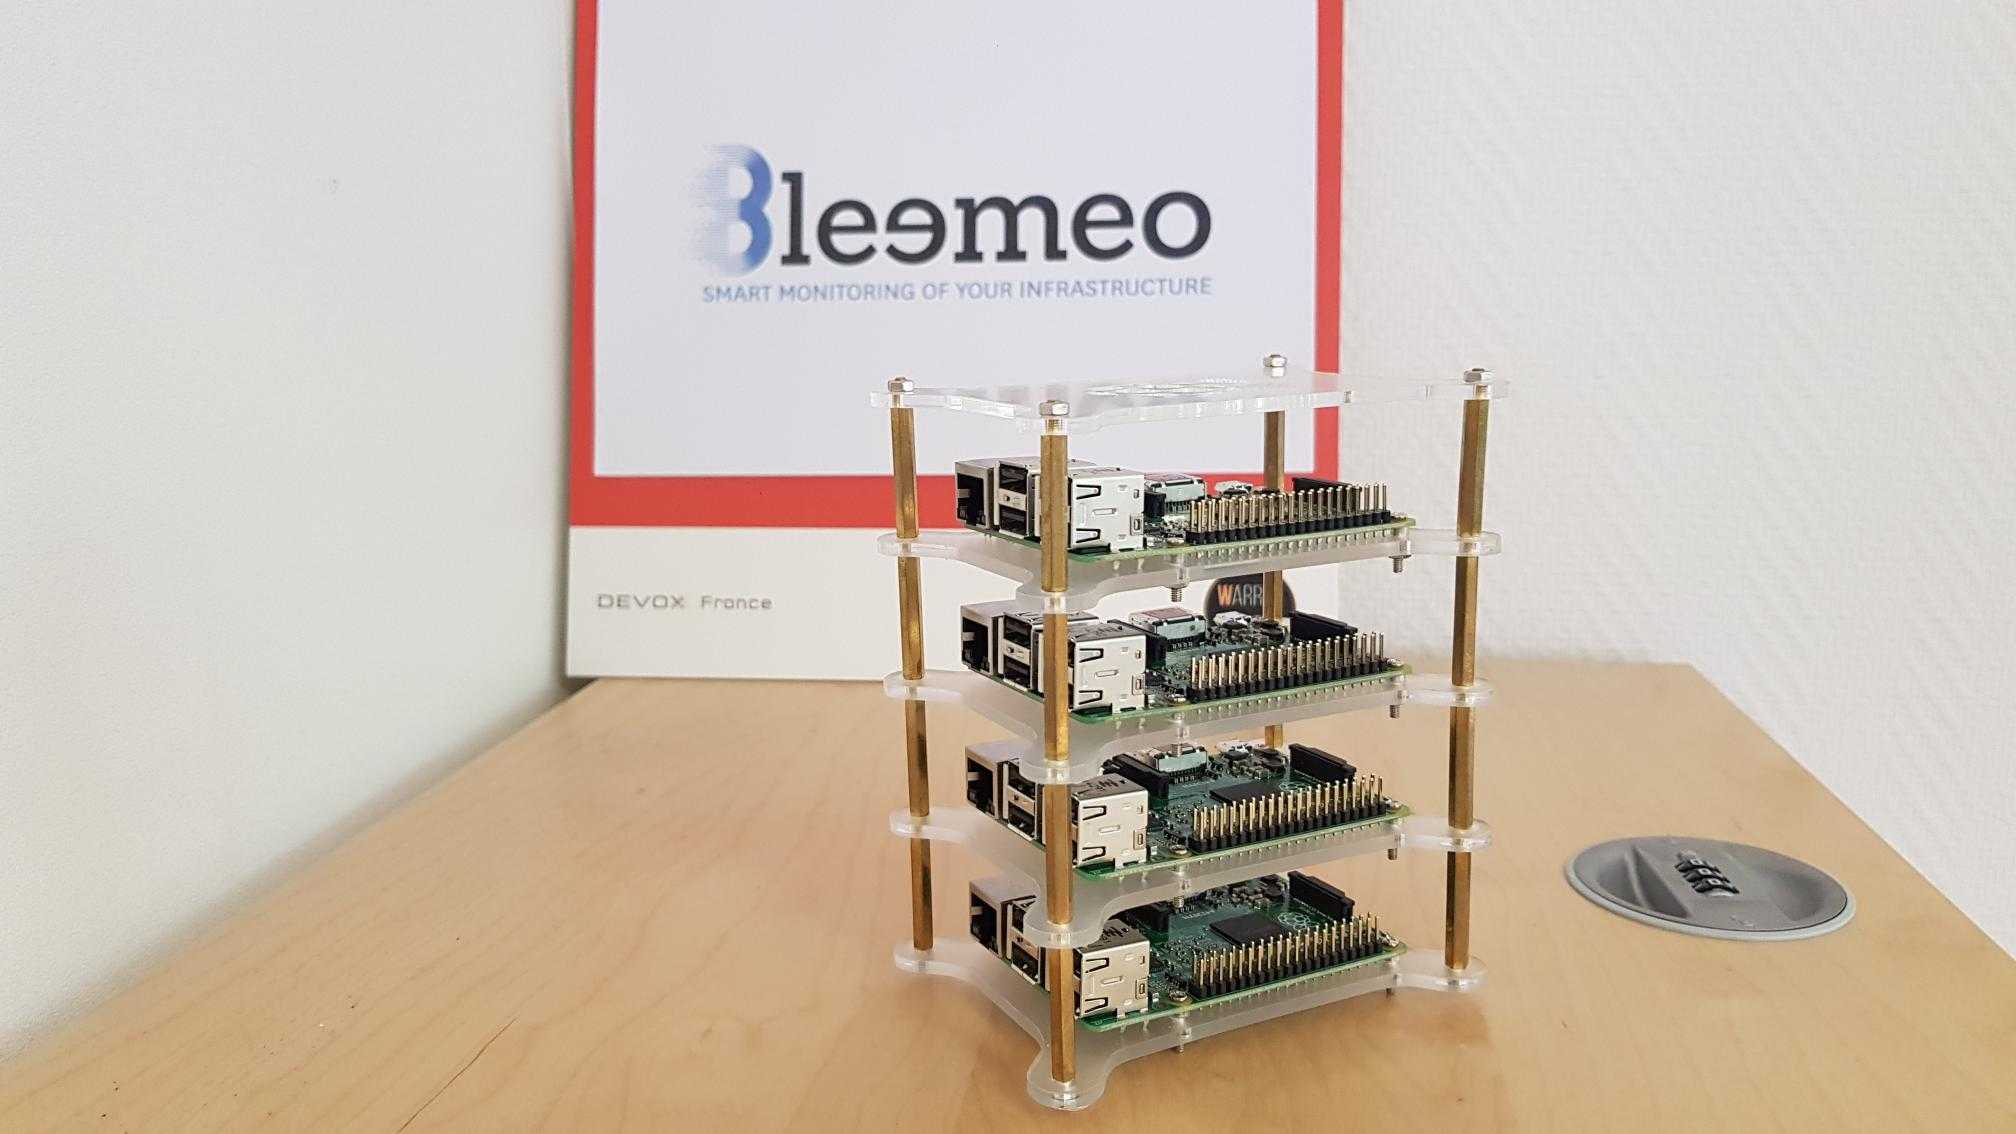
The nodes are ready we can now build the cluster case with a screwdriver, this build is simple to do. You can also connect the nodes to the switch and connect the switch to your access router. Please ensure you to have root access on all nodes.
k3s installation:
To do this infrastructure, we firstly need to download and install k3s server on the control plane node with the following command:
$ curl -sfL https://get.k3s.io | sh -s - --docker --no-flannel
Here we want force k3s to use docker instead of containerd (To not use docker just run the same command without "--docker" and "--no-flannel") because of our application deployment. (The "--no-flannel" option is set to not create a flannel interface and avoid network conflict between Docker bridge and flannel). Indeed the Bleemeo tool will grab metrics on the nodes and these statements needs docker to work and not containerd which is normally used by k3s by default.
If you use the "--docker" option, there are a few more steps needed to allow Docker container to communicate across nodes. In fact, we are going to add the different routes between the nodes to realize the communication between them. Please follow this step if you choose to use docker like us. This is a hack, but k3s come with flannel network overlay for containerd, and we have to do it manually when we use Docker.
On the master1 at /etc/docker/daemon.json add:
{ "bip": "10.42.1.1/24", "ip-masq": false }
In /etc/rc.local please add:
ip r a 10.42.2.0/24 via 192.168.0.2
ip r a 10.42.3.0/24 via 192.168.0.3
iptables  -t nat -I POSTROUTING -s 10.42.0.0/16 ! -d 10.42.0.0/16 ! -o docker0 -j MASQUERADE
iptables -A FORWARD -s 10.42.0.0/16 -o docker0 -j ACCEPT
After these steps the k3s server will be run by systemd so automatically while booting. Please check if the node is ready with the following command (it is probably takes 30 seconds to install):
$ kubectl get node
Now that the control plane is ready, let's talk about the workers. The following command executes the k3s worker node install. So you need to run it on all your workers to join the k3s server previously made.
$ curl -sfL [https://get.k3s.io](https://get.k3s.io/) | k3s_token =<TOKEN> k3s_url=(https://server-url:6443/) sh -s - --docker --no-flannel
To know the k3s token of your control plane node, go on the control plane and grab the token value at /var/lib/rancher/k3s/server/node-token.
To resolve the route problem we saw before, on the worker1 at /etc/docker/daemon.json please add:
{ "bip": "10.42.2.1/24", "ip-masq": false }
In /etc/rc.local please add:
ip r a 10.42.1.0/24 via 192.168.0.1
ip r a 10.42.3.0/24 via 192.168.0.3
iptables  -t nat -I POSTROUTING -s 10.42.0.0/16 ! -d 10.42.0.0/16 ! -o docker0 -j MASQUERADE
iptables -A FORWARD -s 10.42.0.0/16 -o docker0 -j ACCEPT
Anbd to finish, on the worker2 at /etc/docker/daemon.json please add:
{ "bip": "10.42.3.1/24", "ip-masq": false }
In /etc/rc.local please add:
ip r a 10.42.1.0/24 via 192.168.0.1
ip r a 10.42.2.0/24 via 192.168.0.2
iptables  -t nat -I POSTROUTING -s 10.42.0.0/16 ! -d 10.42.0.0/16 ! -o docker0 -j MASQUERADE
iptables -A FORWARD -s 10.42.0.0/16 -o docker0 -j ACCEPT
It is possible that you encounter a problem with the cgroup parameter you need to add in /boot/firmware/cmdline.txt the following line: cgroup_memory=1 cgroup_enable=memory
Remote connection to your cluster
After that please reboot your worker nodes. Once the reboot is finished, go back on your control plane and check if the new nodes are running with:
$ kubectl get node
You should now see all the nodes who joined the server (control plane node).
To facilitate the process and the management of nodes we want accessing cluster from the outside. So please copy /etc/rancher/k3s/k3s.yaml on your machine located outside the cluster as ~/.kube/config. You can use :
$ scp -p root@192.168.0.1:/etc/rancher/k3s/k3s.yaml ~/.kube/config
Then replace "localhost" with the IP or the domain name of your k3s server on your machine. The kubectl command can now manage your remote k3s cluster from your machine. Now all of your kubectl commands will be realized on the control plane node
Installing and accessing K8S dashboard:
To make this project a little more attractive, we decided to install and use the Kubernetes dashboard. As we are on arm architecture, we need to deploy the arm version of the dashboard with the followings commands:
To deploy the arm dashboard:
$ kubectl apply -f https://raw.githubusercontent.com/kubernetes/dashboard/master/aio/deploy/recommended/kubernetes-dashboard-arm-head.yaml
Congratulation you just made your first app deployment on a Kubernetes architecture.
Now we can access our dashboard after running the following command on your host:
$ kubectl proxy
(It makes a proxy between your host and the node where the dashboard is deployed, in order to access it.) And then you can now access your dashboard on the following link:
$ http://localhost:8001/api/v1/namespaces/kube-system/services/https:kubernetes-dashboard-head:/proxy/#/login
To authenticate you, you must run:
$ kubectl -n kube-system describe secret $(kubectl -n kube-system get secret | grep admin-user | awk '{print $1}')
And copy the Bearer token on the previous link. You have now access to your cluster dashboard and you can see the evolution and the react of your cluster in real-time.
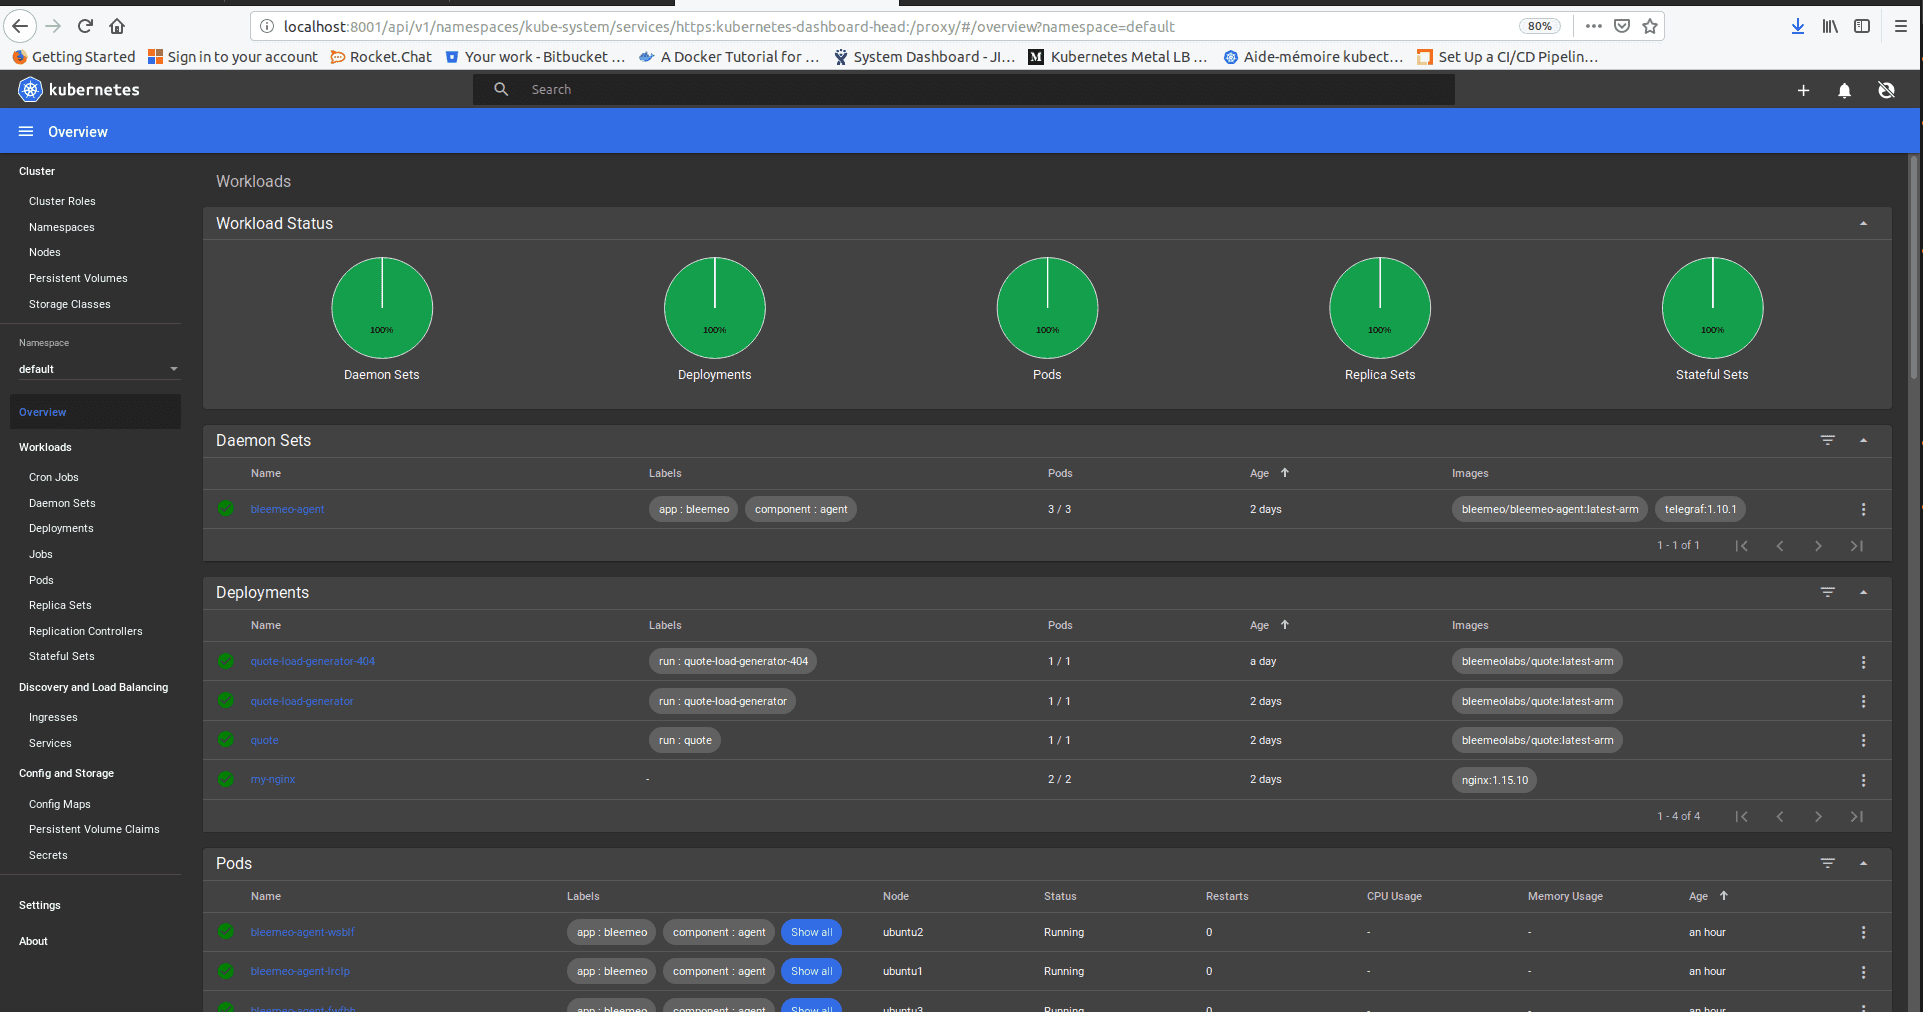
Your k3s kubernetes cluster is now set-up and ready to support other applications. You can also see and manage it with the dashboard. In order to prove that the cluster is running and operational, we will deploy a simple nginx pod. So please apply this yaml file like this:
$ kubectl apply -f https://k8s.io/examples/application/deployment.yaml
apiVersion: apps/v1 # for versions before 1.9.0 use apps/v1beta2
kind: Deployment
metadata:
  name: nginx-deployment
spec:
  selector:
    matchLabels:
      app: nginx
  replicas: 2 # tells deployment to run 2 pods matching the template
  template:
    metadata:
      labels:
        app: nginx
    spec:
      containers:
        - name: nginx
          image: nginx:1.7.9
          ports:
            - containerPort: 80
You can observe the pod by doing this:
$ kubectl get pods -l app=nginx
The output of this command should be similar to this:
NAME                                READY     STATUS    RESTARTS   AGE
nginx-deployment-1771418926-7o5ns   1/1       Running   0          16h
nginx-deployment-1771418926-r18az   1/1       Running   0          16h
And observe the description of the deployment like this:
$ kubectl describe deployment nginx-deployment
The output of this command should be similar to this:
        Name:     nginx-deployment
        Namespace:    default
        CreationTimestamp:  Tue, 10 Apr 2019 18:11:37 -0700
        Labels:     app=nginx
        Annotations:    deployment.kubernetes.io/revision=1
        Selector:   app=nginx
        Replicas:   2 desired | 2 updated | 2 total | 2 available | 0 unavailable
        StrategyType:   RollingUpdate
        MinReadySeconds:  0
        RollingUpdateStrategy:  1 max unavailable, 1 max surge
        Pod Template:
          Labels:       app=nginx
          Containers:
          nginx:
            Image:              nginx:1.7.9
            Port:               80/TCP
            Environment:        <none>
            Mounts:             <none>
          Volumes:              <none>
        Conditions:
          Type          Status  Reason
          ----          ------  ------
          Available     True    MinimumReplicasAvailable
          Progressing   True    NewReplicaSetAvailable
        OldReplicaSets:   <none>
        NewReplicaSet:    nginx-deployment-1771418926 (2/2 replicas created)
        No events.
We have now finished this part of the mock-up. We invite you to follow the second part of this post to add the different applications to our kubernetes architecture.
You can find here some links we used during our setup:
- https://kubecloud.io/how-to-build-a-raspberry-pi-cluster-8af5f2f199d
- https://blog.boogiesoftware.com/2019/03/building-light-weight-kubernetes.html
- https://medium.com/@mabrams_46032/kubernetes-on-raspberry-pi-c246c72f362f
In a second article, we will deploy and monitor with Bleemeo an application on this cluster