AWS Infrastructure Monitoring
Complete visibility into your AWS infrastructure. Monitor EC2 instances, RDS databases, Lambda functions, containers, and all AWS services from a single unified platform.
15-day free trial · No credit card required · Setup in 30 seconds
Coverage
Monitor All AWS Services
EC2 Instances
Monitor CPU, memory, disk, and network metrics. Auto-discover instances with tags.
- CPU and memory utilization
- Disk I/O and space
- Network traffic
- System and application logs
RDS Databases
Deep database monitoring for MySQL, PostgreSQL, Aurora, and more.
- Query performance
- Connection counts
- Replication lag
- Storage utilization
Lambda Functions
Track serverless function invocations, duration, and errors.
- Invocation counts
- Execution duration
- Error rates
- Cold start tracking
ECS & EKS
Container and Kubernetes monitoring with pod-level visibility.
- Container metrics
- Pod health status
- Service discovery
- Resource allocation
Load Balancers
Monitor ALB, NLB, and Classic load balancer performance.
- Request rates
- Response times
- Healthy target counts
- Error rates
CloudWatch Integration
Seamless integration with AWS CloudWatch metrics and logs.
- Native CloudWatch metrics
- Custom metrics
- Log aggregation
- Cost optimization insights
Capabilities
AWS Monitoring Features
Auto-Discovery
Automatically discover and monitor EC2 instances, RDS databases, and containers based on tags and filters. New resources appear in your dashboards within minutes of creation — no manual configuration needed for each new instance or database.
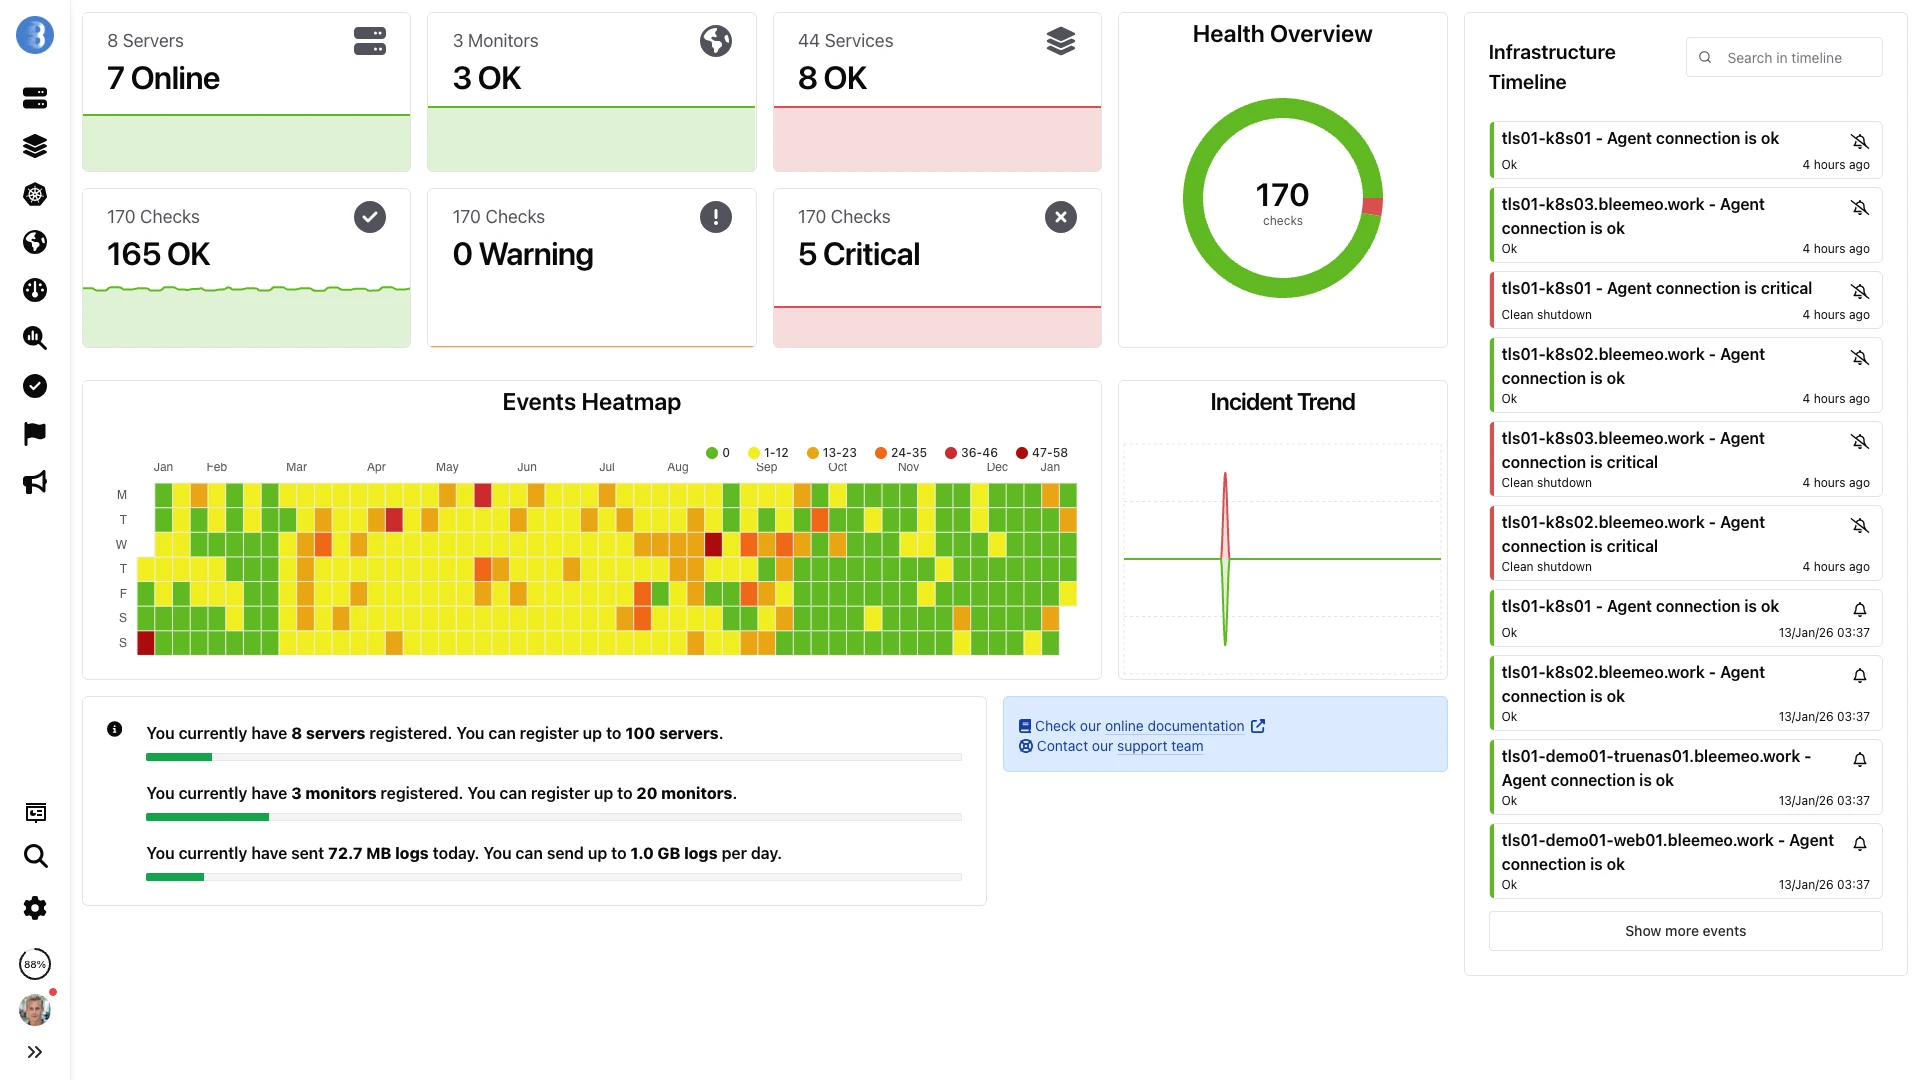
Unified Dashboards
View your entire AWS infrastructure on customizable dashboards with real-time updates. Combine CloudWatch API metrics with OS-level agent data on the same graphs, giving you both the cloud perspective and the system-level detail in one place.
Smart Alerts
Get intelligent alerts when AWS resources exceed thresholds or behave abnormally. Bleemeo ships with pre-configured alert rules for common AWS scenarios — high CPU, low disk space, unhealthy targets — so you are covered from day one without writing custom alarm rules.
Cost Tracking
Track AWS spending per account, per service, and per tag. Correlate cost spikes with resource utilization changes to quickly identify whether a bill increase comes from a scaling event, a misconfigured resource, or an unintended data transfer charge.
Multi-Account Support
Monitor multiple AWS accounts from a single pane of glass with role-based access.
Trend Analysis
Identify usage patterns and capacity planning opportunities with historical data.
CloudWatch Integration
Native integration with AWS CloudWatch for comprehensive metrics collection without additional configuration.
Container Monitoring
Monitor ECS and EKS containers alongside EC2 instances for complete visibility into your containerized workloads.
Setup
Easy Setup
Install Bleemeo Agent
Deploy our lightweight agent on EC2 instances via user data or configuration management tools.
wget -qO- 'https://get.bleemeo.com?accountId=<your_account_id>®istrationKey=<your_registration_key>' | shConfigure CloudWatch
Connect your AWS account for CloudWatch metrics integration. Create a read-only IAM user or role, paste the credentials into the Bleemeo administration panel, and select which services and regions to monitor. The entire setup takes less than five minutes.
Start Monitoring
Instances are auto-discovered and monitoring begins immediately. Pre-built dashboards give you an instant overview, and default alert rules notify you of common issues like high CPU, low memory, or unhealthy load balancer targets. Customize everything from the web panel as your needs evolve.
Benefits
Why Choose Bleemeo for AWS?
Better Than CloudWatch Alone
Combine CloudWatch metrics with agent-based monitoring for complete visibility into OS and application metrics.
Multi-Cloud Ready
Monitor AWS alongside Azure, GCP, and on-premise infrastructure in one platform.
No Vendor Lock-In
Own your monitoring data. Export metrics anytime. Switch providers without losing history.
Faster Troubleshooting
Correlate infrastructure metrics with application logs for rapid root cause analysis.
Definition
What Is AWS Monitoring?
AWS monitoring is the practice of tracking the health, performance, and cost of your Amazon Web Services infrastructure. While AWS provides CloudWatch as a built-in monitoring service, it was designed as a metrics API — not a comprehensive observability platform. CloudWatch alone lacks unified dashboards, long-term retention, and the ability to correlate cloud metrics with OS-level data or application logs.
A third-party monitoring solution like Bleemeo enhances AWS observability by combining CloudWatch metrics with agent-based monitoring for deeper visibility. CloudWatch tells you an EC2 instance's CPU percentage; the Glouton agent tells you which process is consuming it, how much memory it uses (a metric CloudWatch does not provide natively), and what error messages appeared in its logs at the same time.
For organizations running hybrid or multi-cloud infrastructure, AWS-native tools create silos. CloudWatch monitors only AWS resources. If you also have on-premise servers, GCP instances, or Kubernetes clusters, you need separate dashboards and alerting systems. Bleemeo unifies all of this — AWS, on-premise, and multi-cloud — into a single platform with consistent dashboards, alerting rules, and 13 months of metric retention.
How it works
Agent + CloudWatch Architecture
CloudWatch Integration
Bleemeo's CloudWatch integration pulls metrics directly from the AWS CloudWatch API using IAM credentials. This requires no agent installation and covers all AWS managed services.
- EC2 instance metrics (CPU, network, disk I/O)
- RDS database performance metrics
- ELB/ALB/NLB load balancer metrics
- DynamoDB read/write capacity
- S3 bucket size and object count
- Cost Explorer daily and forecasted costs
Glouton Agent on EC2
Installing the Glouton agent on EC2 instances provides OS-level and application-level metrics that CloudWatch cannot deliver.
- Memory usage (not in CloudWatch)
- Per-process CPU and memory
- Disk space per mount point
- Auto-discovered service metrics
- Container metrics (Docker, containerd)
- Application log collection
Both data sources merge into the same dashboards and alerting rules, giving you a complete picture of each AWS resource — from the CloudWatch API level down to the process and log level.
IAM Setup & Permissions
Bleemeo requires a dedicated IAM user or role with read-only permissions. Core policies include cloudwatch:GetMetricStatistics, cloudwatch:ListMetrics, and ec2:DescribeInstances. Each AWS service adds its own describe permissions — rds:DescribeDBInstances for RDS, elasticloadbalancing:DescribeLoadBalancers for ELB. We recommend creating separate IAM policies per service so you can enable or disable monitoring granularly. For organizations using AWS Organizations, a single cross-account IAM role simplifies multi-account access.
CloudWatch API Cost Control
AWS charges for CloudWatch API calls, but costs are predictable and manageable. A typical deployment of 20 EC2 instances, 5 RDS databases, and 3 load balancers costs approximately $27/month in CloudWatch API fees. You can selectively enable or disable monitoring per AWS service type directly from the Bleemeo administration panel — for example, monitoring only EC2 and RDS while skipping S3 bucket metrics to reduce costs.
Multi-Account Unified View
Configure separate IAM credentials for each AWS account — development, staging, and production — and all resources appear in a single Bleemeo dashboard. Use tag-based filtering to organize resources across accounts. Each account's cost data is tracked independently, enabling accurate per-environment cost attribution. This multi-account approach also supports managed service providers monitoring customer infrastructure from a central console.
Metrics
Detailed AWS Metrics
EC2 Instances
CloudWatch provides CPU utilization, network in/out, disk read/write ops, and status checks. With the Glouton agent installed on the instance, add memory utilization, swap usage, per-mount disk space, TCP connections, per-process CPU and memory, and application-specific metrics from 100+ auto-discovered services including Nginx, Apache, MySQL, PostgreSQL, Redis, and Elasticsearch. The agent also collects system logs and application logs, forwarding them to Bleemeo for centralized search and alerting.

RDS Databases
Monitor CPU utilization, database connections, read/write IOPS, free storage space, replication lag, network throughput, and free memory. For Aurora, get additional cluster-level metrics including reader/writer instance counts, failover events, and Aurora replica lag. Bleemeo pre-configures alerts for critical database events: storage space falling below 10%, connection count approaching the maximum, and replication lag exceeding acceptable thresholds for your read replicas.
Lambda Functions
Track invocation counts, execution duration (average, P95, and maximum), error rates, throttle counts, and concurrent executions. Monitor cold start frequency and duration to identify functions that would benefit from provisioned concurrency. Correlate Lambda errors with downstream service metrics to quickly identify whether failures originate from your code or from dependent services like DynamoDB or SQS.
DynamoDB Tables
Track consumed read/write capacity units, throttled requests, provisioned vs consumed capacity, item count, table size, and latency for GetItem, PutItem, Query, and Scan operations. Essential for right-sizing provisioned capacity or monitoring on-demand costs.
Load Balancers (ELB/ALB/NLB)
Monitor request count, active connection count, target response time, HTTP 4xx/5xx error rates, healthy/unhealthy host count, processed bytes, and new connection rates. Identify backend health issues and capacity bottlenecks before they affect users.
S3 Buckets
Monitor bucket size in bytes and total object count for each S3 bucket in your account. While S3 metrics are minimal compared to compute services, tracking storage growth over time helps you anticipate cost increases and identify buckets where lifecycle policies or Intelligent-Tiering could reduce expenses.
ECS & EKS Containers
Monitor ECS tasks and EKS pods running across your cluster. Track container CPU and memory utilization, task counts by status, service desired vs running count, and deployment rollout progress. With the Glouton agent on EC2-backed clusters, get per-container process metrics and application-level service discovery inside each task or pod.
Cost Explorer
Track daily costs, current month-to-date spending, end-of-month cost forecasts, and Savings Plans utilization and coverage. Correlate cost spikes with resource utilization changes to identify unexpected cost drivers and optimization opportunities.
Cost
AWS API Cost Transparency
CloudWatch API calls incur small costs on your AWS bill. Bleemeo is transparent about these costs so there are no surprises. The estimated costs per monitored resource depend on the number of metrics and the polling frequency:
| AWS Service | Estimated Monthly Cost | Notes |
|---|---|---|
| RDS Database | ~$2.64 | Per database, includes detailed metrics |
| DynamoDB Table | ~$1.76 | Per table, capacity and latency metrics |
| ELB/ALB/NLB | ~$1.76 | Per load balancer |
| S3 Bucket | <$0.01 | Per bucket, size and count only |
| Lambda | ~$0.80 | Per function, invocation and duration metrics |
| Cost Explorer | ~$1.24 | Per account, daily cost and forecast |
| EC2 Instance | ~$0.70 | Per instance, basic CloudWatch metrics |
AWS provides a CloudWatch free tier that covers many use cases. For most small to medium deployments, the additional AWS costs from Bleemeo monitoring are negligible compared to the infrastructure costs themselves. You can selectively enable or disable monitoring for specific services to control costs.
For EC2 instances, CloudWatch provides basic metrics like CPU utilization, network traffic, and disk I/O. For deeper visibility — including memory usage, per-process metrics, service discovery, and application-level monitoring — we recommend deploying the Bleemeo monitoring agent directly on the instance.
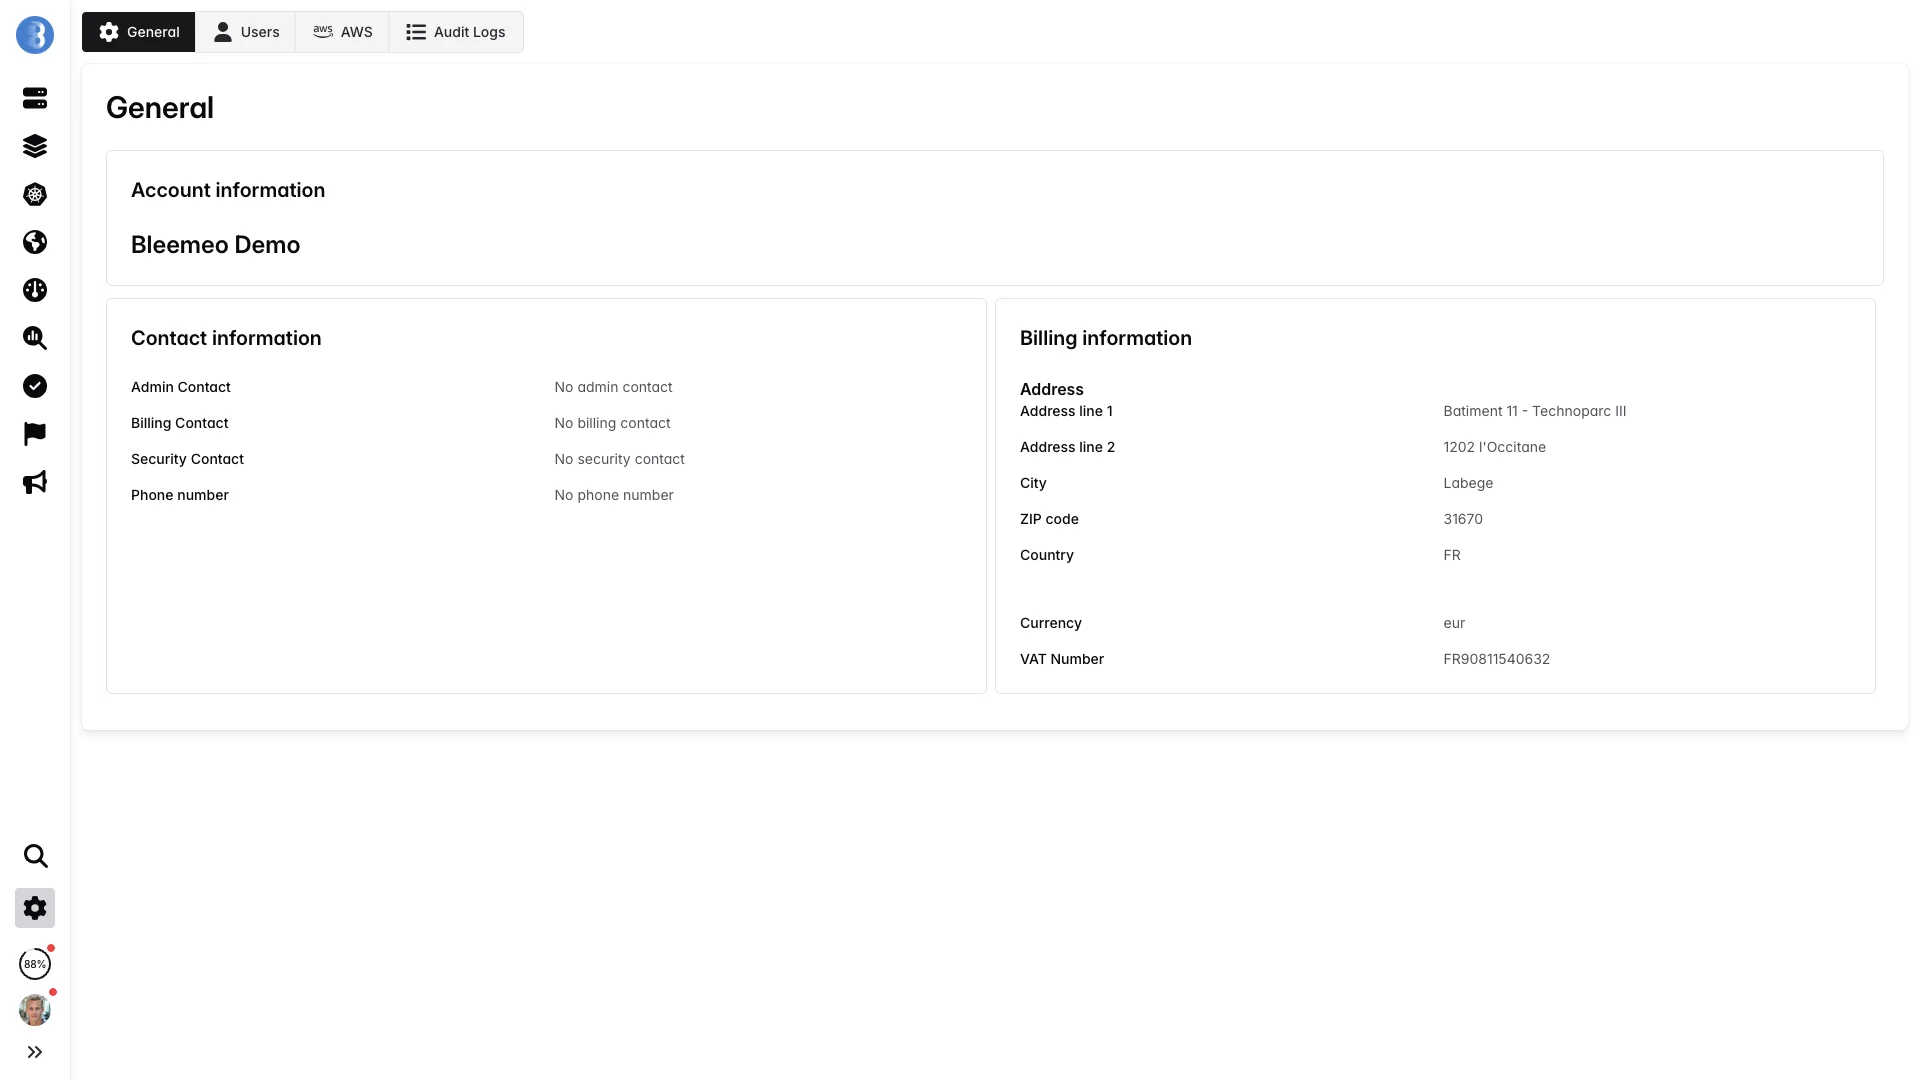
Configuration
Easy AWS Configuration
Configure your AWS integration in the Bleemeo administration panel. Add IAM credentials, select regions, and start monitoring — all from a simple web interface. No YAML files to edit, no infrastructure to deploy. Bleemeo connects directly to your AWS account using read-only API credentials and starts collecting metrics within minutes. You can add multiple AWS accounts and switch monitoring on or off for each service type independently.
- Role-based IAM access
- Multi-region support
- Per-service toggle
- Cost tracking opt-in
Use cases
Use Cases
Hybrid Cloud Monitoring
Monitor AWS resources alongside on-premise servers and other cloud providers in a single dashboard. Correlate metrics across environments during migration projects or for workloads that span cloud and on-premise infrastructure. Unified alerting eliminates the need for separate monitoring tools per environment.
AWS Cost Optimization
Combine Cost Explorer metrics with EC2 and RDS utilization data to identify over-provisioned instances. Find EC2 instances running at 5% CPU that could be downsized, RDS databases with unused IOPS capacity, and DynamoDB tables with over-provisioned read/write units. Track the cost impact of optimization changes over time.
Multi-Account Governance
Monitor all AWS accounts in your organization from a single Bleemeo dashboard. Compare resource utilization and costs across development, staging, and production accounts. Detect rogue resources in sandbox accounts that drive unexpected costs. Apply consistent alerting policies across the entire AWS organization.
Auto-Scaling Validation
Verify that EC2 Auto Scaling groups respond correctly to load changes. Monitor the lag between a traffic spike and the scaling event. Track target group health during scale-out and scale-in events. Ensure that new instances register with load balancers promptly and that scaling policies are correctly calibrated.
Want to go further?
Read the DocumentationFrequently Asked Questions
Everything you need to know about Bleemeo's AWS monitoring
What AWS services can Bleemeo monitor?
Bleemeo can monitor a wide range of AWS services through CloudWatch integration. This includes: EC2 instances (CPU, memory, disk I/O, network), RDS databases (MySQL, PostgreSQL, Aurora), DynamoDB tables, S3 buckets (object count, storage size), ELB/ALB/NLB load balancers, ECS and EKS containers. You also get cost metrics from AWS Cost Explorer.
How does Bleemeo integrate with AWS?
Bleemeo integrates with AWS in two complementary ways: CloudWatch integration pulls metrics directly from AWS APIs using IAM credentials you provide, and the Glouton agent can be installed on EC2 instances for deeper OS and application-level metrics. The CloudWatch integration requires read-only IAM permissions (like cloudwatch:GetMetricStatistics, ec2:DescribeInstances). We recommend using both for complete visibility.
Do I need to install an agent on EC2 instances?
It depends on your needs. CloudWatch integration alone provides basic metrics (CPU, network, disk I/O) without installing anything. However, installing the Glouton agent on EC2 instances gives you more detailed metrics including memory usage (not available in CloudWatch), per-process metrics, application-specific metrics, and log collection. The agent deployment can be automated via user data scripts.
Does Bleemeo AWS monitoring add to my AWS costs?
Yes, there are minimal AWS API costs for CloudWatch metric retrieval. Estimated costs: EC2 ~$0.70/month per instance, RDS ~$2.64/month per database, DynamoDB ~$1.76/month per table, ELB ~$1.76/month per load balancer, S3 less than $0.01/month per bucket. AWS provides a $10/month CloudWatch free tier that covers many use cases. Cost Explorer metrics add ~$1.24/month per account.
What IAM permissions does Bleemeo need?
Bleemeo requires read-only permissions to access AWS resources and metrics. The core permissions include cloudwatch:GetMetricStatistics for metrics and ec2:DescribeRegions for region discovery. Each service adds specific describe permissions (e.g., ec2:DescribeInstances, rds:DescribeDBInstances). For cost metrics, you need Cost Explorer permissions. We provide detailed IAM policies in our documentation for each service.
Can I monitor multiple AWS accounts?
Yes, Bleemeo supports multi-account monitoring. You can configure multiple AWS integrations with different IAM credentials, one for each AWS account. All resources from all accounts appear in your Bleemeo dashboard, allowing you to monitor your entire AWS organization from a single pane of glass. You can also use role-based access control in Bleemeo to manage who sees which accounts.
How does Bleemeo compare to CloudWatch alone?
Bleemeo enhances CloudWatch in several ways: Longer retention (13 months vs CloudWatch's standard 15 days for detailed metrics), unified dashboards combining AWS metrics with on-premise resources, deeper OS metrics (memory, processes) via the agent, simpler alerting without complex CloudWatch alarm configuration, and the ability to correlate metrics with logs in one platform.
Can I monitor ECS and EKS containers?
Yes, Bleemeo provides container-level monitoring for both ECS and EKS. For ECS, you can monitor task and container metrics through CloudWatch integration. For EKS, deploying Glouton via Helm provides comprehensive Kubernetes monitoring including pod, container, and cluster-level metrics. You get automatic service discovery, pod health tracking, and resource allocation visibility.
Does Bleemeo track AWS costs?
Yes, through the AWS Cost Explorer integration, Bleemeo can track: daily costs, current monthly costs, cost forecasts for end of month, and Savings Plans utilization and coverage. These metrics appear in your dashboards alongside resource metrics, helping you correlate spending with utilization and identify optimization opportunities.
Can I monitor hybrid AWS and on-premise infrastructure?
Yes, this is one of Bleemeo's key strengths. You can monitor AWS resources via CloudWatch, EC2 instances with Glouton agent, and on-premise servers all in the same platform. Dashboards can combine metrics from all sources, allowing you to see your entire infrastructure - cloud and on-premise - in unified views. This is ideal for hybrid deployments and migration projects.