Nagios alternative for infrastructure monitoring
Bleemeo is a modern Cloud based infrastructure monitoring solution that can replace your Nagios setup offering more features and flexibility.
Metrics, Health Checks and Real Time Dashboards for:
Servers
- Linux and Windows hosts with agent
- Cloud, bare-metal & VPS servers
- Health checks and metrics for system and services
- Dashboards with CPU, RAM, Disk, network and services metrics
- Use thresholds and Query Language to define alarms and receive notifications


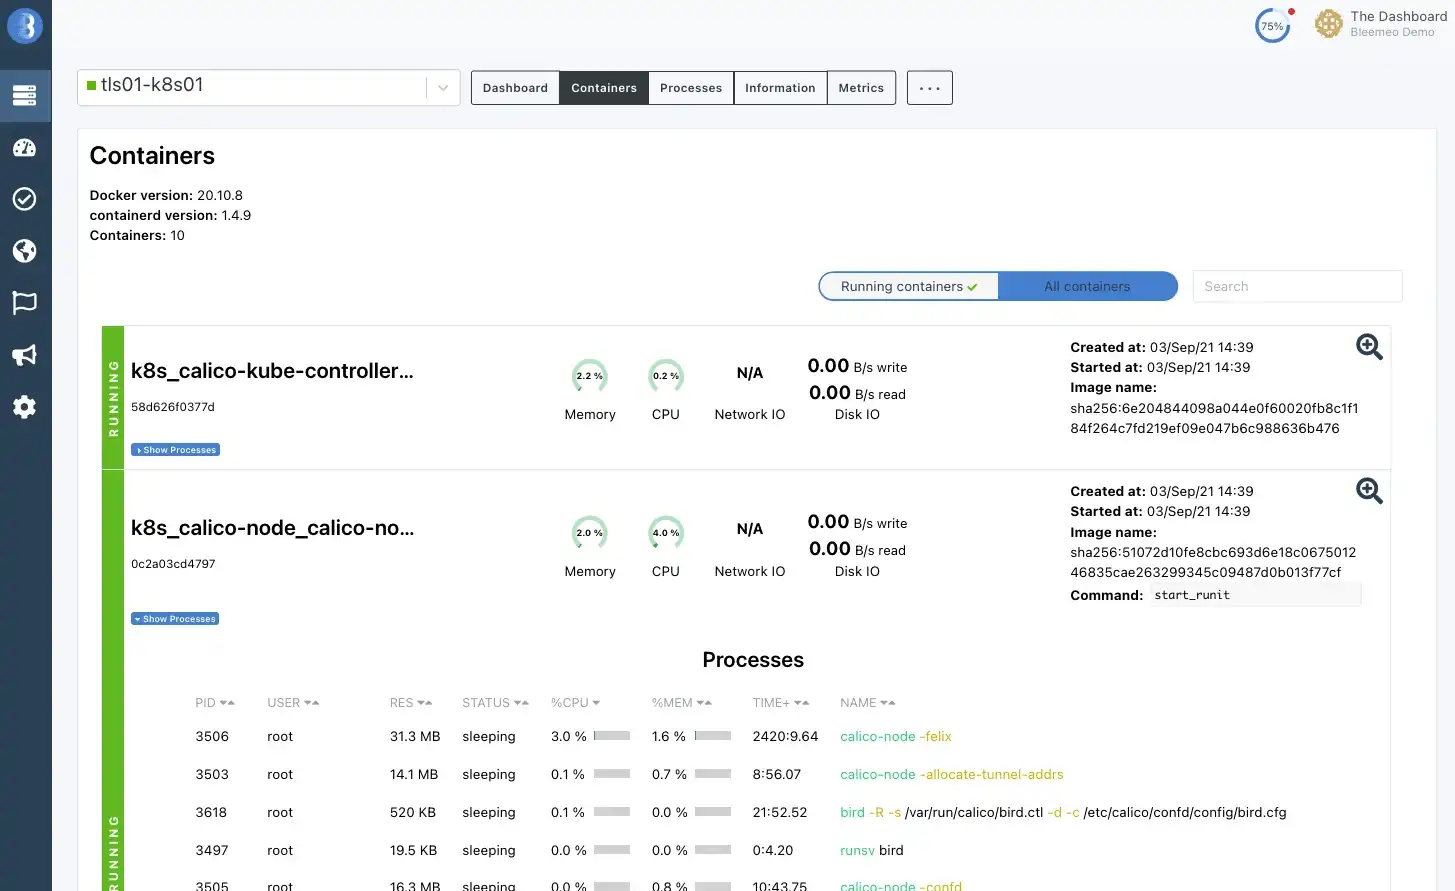
Containers
- Docker and Kubernetes support
- Container health checks and metrics
- Integrate with Kubernetes managed offers
- Elastic workload support
- Services in containers health checks and metrics


Applications
- 100+ services detected automatically: Nginx, Redis, MySQL, PostgreSQL, RabbitMQ and many others
- SDK available for most programming languages
- Instrumentalize your code, create custom metrics from your code
- Prometheus and Statsd metrics ingestion support
- Use standard Prometheus exporters from community


Network
- Use probes to check public services availability and latency
- Public probes located in 5 locations on 3 continents
- Use your hosts agent as private probes
- SSL & domains name expiration checks
- Monitor any SNMP capable device
- Collect switches, routers, SAN, Wifi access points metrics


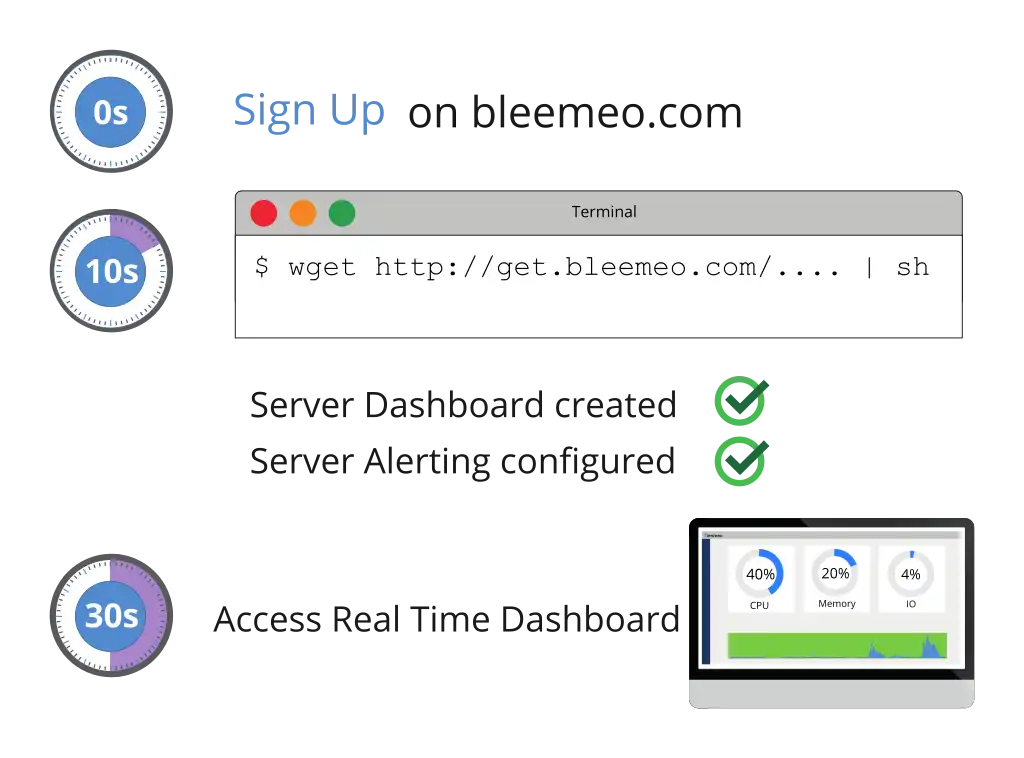
30 seconds to monitor your infrastructure
Deploying a robust, scalable monitoring solution can be time consuming. At Bleemeo, we focus on making users life easier. Common operating systems and services are auto-detected, default dashboards and notifications rules are created. All you need is to connect your agent and then customize for your needs.


Easier Setup
Bleemeo monitoring solution inspects your infrastructure at setup and automatically creates health checks, metrics and dashboards. More than 100 services are automatically detected and manual configuration is limited to strictly required configurations.
- Bleemeo monitoring agent auto-detects hosts and services, creates health checks and metrics.
- Dashboards and notifications rules are also automatically created, and can be customized for your needs.
- Bleemeo relies on monitoring standards: Prometheus, StatsD, Nagios, no vendor lock-in and transitions are easy from an existing monitoring solution.
- Monitor your servers, containers, applications, public services from a single interface.
- Use Bleemeo iOS and Android application to monitor your infrastructure from everywhere.
- Customize your monitoring to monitor your applications and network devices.
Affordable Cloud Monitoring Solution
Our pricing is smart: you pay for on the amount of data we have to process and store for your infrastructure. Our engineering team works on maintaining the costs of the solution affordable for any company.
- Multiple plans are available to match your needs.
- Plans start at 4,99€ / server / month to monitor health of your server and services and receive notifications when something goes wrong.
- Professional and Enterprise plans are here to cover more complex needs like containers and applications monitoring.
- Our Free plan is available for basic needs, up to 3 servers.


Complete Monitoring Features
Easier and affordable prices do not mean Bleemeo does not cover monitoring features!
- CPU, Memory, Network, I/O, disk metrics and health checks for main operating systems Linux, Windows.
- Monitor your containers from Docker, Kubernetes and Managed Kubernetes and services associated to those containers.
- Notify your team in case of an incident with Slack, Microsoft Teams, SMS and other integrations.
- Use our iOS and Android application to receive notifications and check your infrastructure status from anywhere.
Features Comparison
| Server heartbeat | ||
|---|---|---|
| Service healthcheck | ||
| Service metrics | - | |
| Server self-registry, no manual configuration change | - | |
| Service auto-discovery, no manual inventory | - | |
| Built-in server and service dashboards | - | |
| Custom dashboards | - | |
| Public service monitoring from multiple locations | - | |
| Scaling Monitoring seemlessly | - | |
| Monitoring high availability | - |


Simple and Smart Pricing
Bleemeo pricing is comprehensive, simple and smart. Choose the plan that suits your needs, from basic checks with low retention period to more capabilities with more data rentention.
Free Ideal for small environments
0.00€
Start monitoring for free your infrastructure up to 3 servers with key metrics and alerts on issues.
Starter Ideal for startups and smb
4.99€per month / server
Start with system metrics and alerting for your servers.
Professional Most Popular Plan
10.99€per month / server
Monitor with more granularity system and services on your servers, your containers and applications, including managed services from Cloud providers.
Enterprise For large servers fleet
Let's Discuss
If you have a custom need or a big server fleet, contact-us!