Kubernetes Monitoring with Cloud Monitoring
Start monitoring your Kubernetes infrastructure: Servers, Pods, and Applications are monitored without headache using Bleemeo Cloud Monitoring solution.
Monitor Kubernetes
- Default Kubernetes components: API, Kubelets are automatically detected and monitored.
- Kubernetes SSL certificates are automatically monitored.
- Resources from your Kubernetes hosts (worker and control plane) are automatically monitored and graphed.
- API is monitored from all workers nodes.
- Bleemeo agent is deployed as DaemonSet and can be deployed on managed Kubernetes clusters and self-installed Kubernetes clusters.
- Your monitoring is independent from your infrastructure and does not impact your performances.
- Receive notifications on Slack, Microsoft Teams, mobile application, ... when your cluster gets of resources or a service is not working as expected.


Metrics, Health Checks and Real Time Dashboards for:
Servers
- Linux and Windows hosts with agent
- Cloud, bare-metal & VPS servers
- Health checks and metrics for system and services
- Dashboards with CPU, RAM, Disk, network and services metrics
- Use thresholds and Query Language to define alarms and receive notifications


Containers
- Docker and Kubernetes support
- Container health checks and metrics
- Integrate with Kubernetes managed offers
- Elastic workload support
- Services in containers health checks and metrics


Applications
- 100+ services detected automatically: Nginx, Redis, MySQL, PostgreSQL, RabbitMQ and many others
- SDK available for most programming languages
- Instrumentalize your code, create custom metrics from your code
- Prometheus and Statsd metrics ingestion support
- Use standard Prometheus exporters from community


Network
- Use probes to check public services availability and latency
- Public probes located in 5 locations on 3 continents
- Use your hosts agent as private probes
- SSL & domains name expiration checks
- Monitor any SNMP capable device
- Collect switches, routers, SAN, Wifi access points metrics


30 seconds to monitor your infrastructure
Deploying a robust, scalable monitoring solution can be time consuming. At Bleemeo, we focus on making users life easier. Common operating systems and services are auto-detected, default dashboards and notifications rules are created. All you need is to connect your agent and then customize for your needs.
1. Signup
![Bleemeo Signup]()


2. Install agent
![Bleemeo Install Agent]()
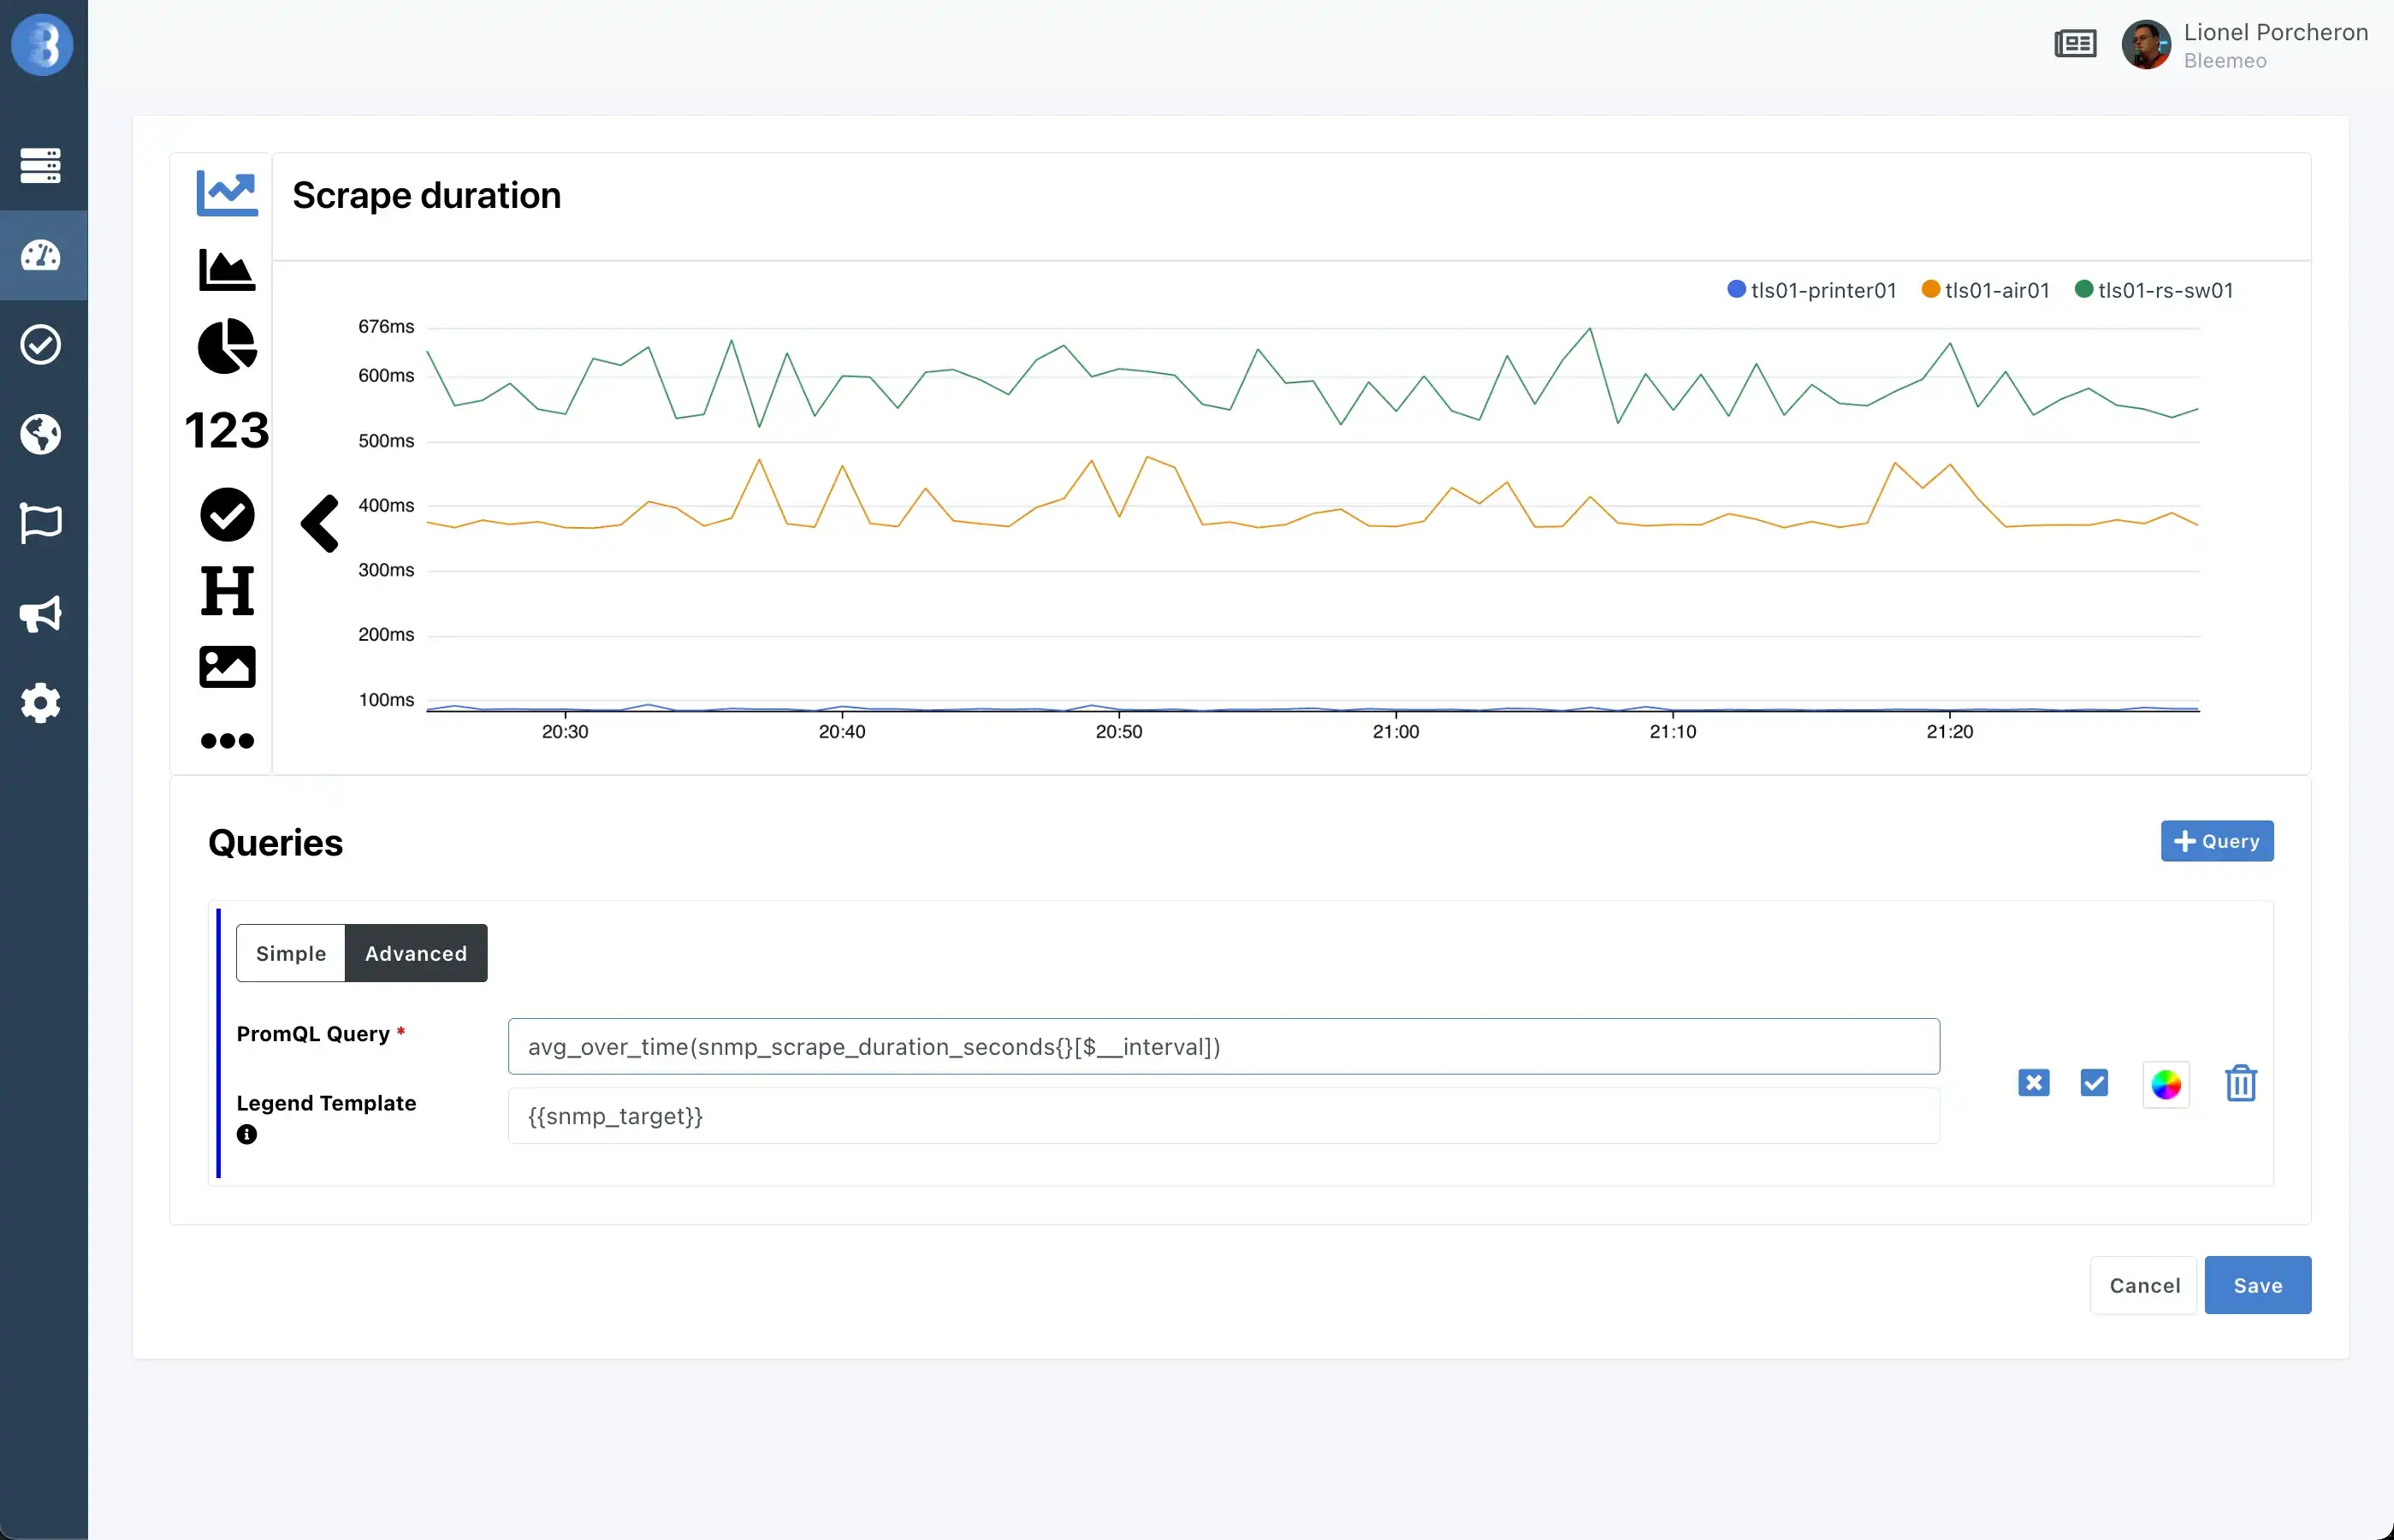
3. Browse Metrics Dashboards
![Bleemeo browse metrics dashboards]()

4. Customize
![Bleemeo customize]()


Metrics & Checks of Pods
- Services running in Pods are automatically detected
- Metrics associated to services running in Pods are created and graphed in services dashboards.
- Combine your Kubernetes deployment with any Prometheus exporter from the community to enrich your Bleemeo metrics.
- Use Prometheus SDK in your applications to ingest metrics in Bleemeo and get business metrics.
- Build custom dashboards with PromQL with your business metrics
- Use PromQL to define advanced alerting rules on a server, a group of server or your entire infrastructure.
Start Monitoring your servers, containers, and applications in 30 seconds without credit card.Start your Free Trial