Let’s discover some features of Bleemeo Cloud platform! In this article, we will define custom statsd metrics, status, Nagios check and monitor them with Bleemeo. We will use Minecraft as an example. However, this article is still relevant for you even though you are not keen on building castles. In this article we will assume you have already installed a Bleemeo Agent on your server.
Status checks
Status checks basically verify that your application is alive. Bleemeo Smart Agent currently supports 2 types of checks:
- HTTP check : verify every minute that your HTTP application returns a 2xx or a 3xx status code
- TCP check : verify every minute that a TCP connection can be opened to a given address and port.
Let’s create the file /etc/bleemeo/agent.conf.d/50-custom-check.conf
and add a check on our Minecraft server port. :
service:
  - type: minecraft
    port: 25565
    check_type: tcp
Beware: Bleemeo Smart Agent configuration files are in YAML format. Therefore, you should use whitespaces instead of tabulations.
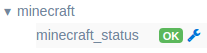
Once your agent has restarted, you should see a new metric in the Metrics view of your agent view:
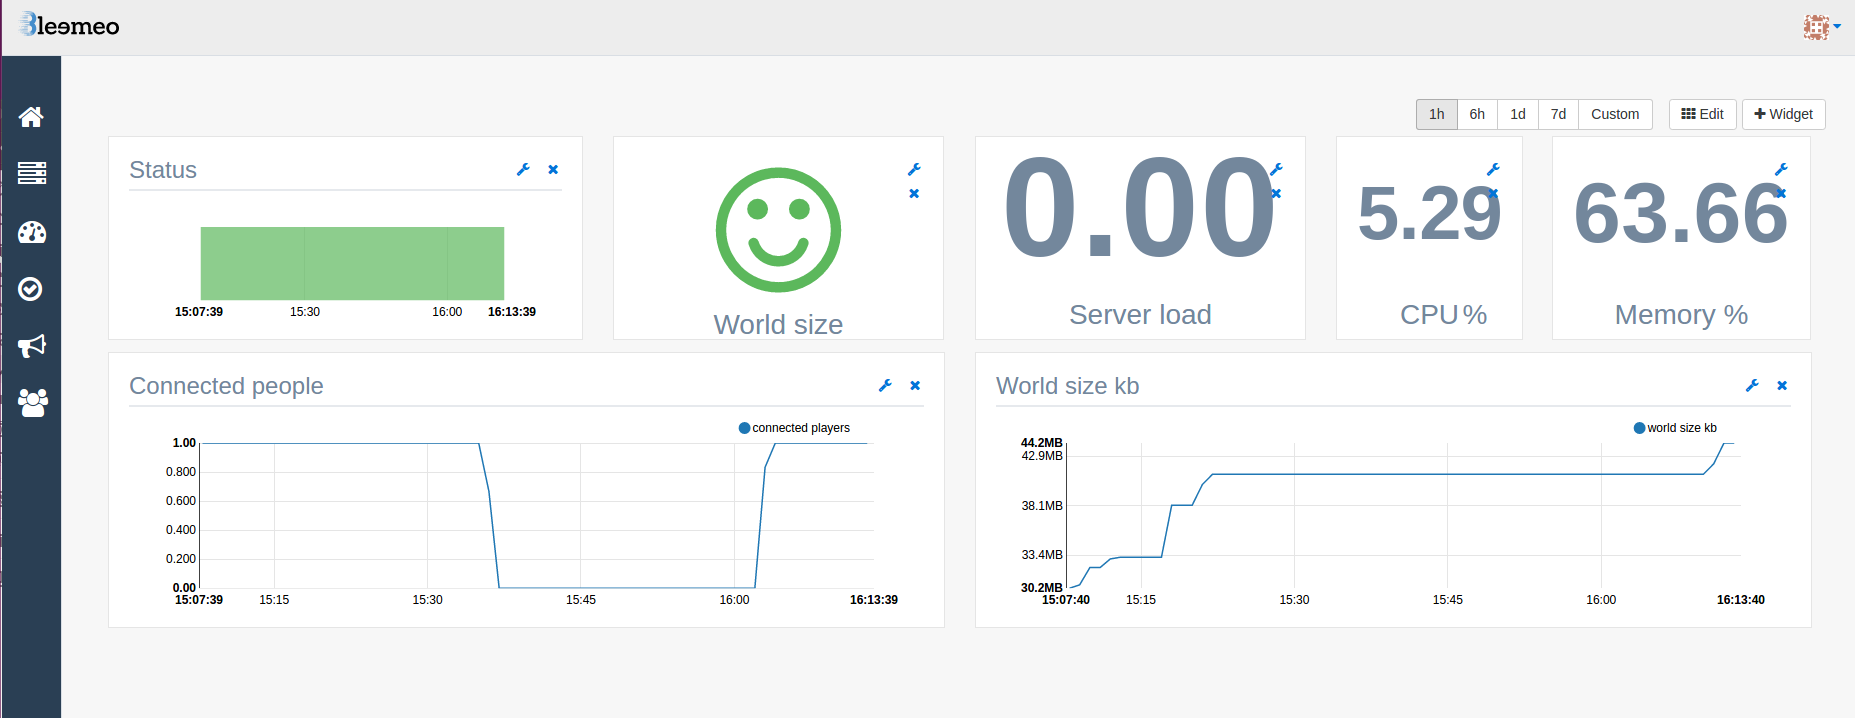
You can easily add it to a new custom dashboard and monitor your Minecraft server status, with a status history chart widget for example. If you are running a dynmap, you can monitor it by setting a HTTP check.
Nagios checks
In a few words, a Nagios checks is ternary check: if everything is ok, it returns 0. If a warning threshold is reached, it returns 1, and 2 if it is critical. Bleemeo Smart Agent can execute Nagios check commands and transfer their result to Bleemeo Platform. It is especially useful to be alerted if something exceeds a predetermined level.
Let’s add a Nagios check on Minecraft World size, thus we will get an alert if it’s becoming too large.
To begin with let’s download Nagios
check_dirsize
plugin. Be sure that Bleemeo Agent can execute it by setting an
appropriate chmod. Then add those lines to 50-custom-check.conf :
- type: worldsize
  check_type: nagios
  check_command: /var/nagios/check_dirsize.sh -d /var/minecraft/world -w 200000 -c 300000
Code explanations: each minute, Bleemeo Smart Agent will call the check_dirsize command to verify our world folder size. If it’s larger than 200M, a warning will be displayed in our dashboard and if it’s over 300M, we will get a critical alert.
Once you restarted your agent, you can see the worldsize metric in metrics view and add it to your custom dashboard.
Statsd metrics
Statsd is a daemon used for stats aggregation. Bleemeo Smart Agent uses telegraf as a statsd daemon. Thus we can use smart agent to monitor custom metrics. In our case, we will create a python script that will be launched by a cron every 5 minutes to collect several values and send them to Bleemeo Agent. You can also link statsd directly in your application to monitor daily number of login for instance.
To begin with, we have to install 2 dependencies :
pip install mcstatus to query our server and pip install statsd to
exchange with Bleemeo Agent. Then let’s create a small script.
# Python Minecraft Checker
# Called each 5 minutes by a cron. Monitor connected people and world size.

from mcstatus import MinecraftServer
import statsd
import os

# Create a connection to statsd run by bleemeo smart agent
sc = statsd.StatsClient('localhost', 8125)


server = MinecraftServer.lookup("<your_server_ip>")
status = server.status()  # get stats from server
# writes number of connected people into statsd
sc.gauge('connected_players', status.players.online)

# Monitors world size

# defines a function to get size of directory
def get_size(start_path = '.'):
    total_size = 0
    for dirpath, dirnames, filenames in os.walk(start_path):
        for f in filenames:
            fp = os.path.join(dirpath, f)
            total_size += os.path.getsize(fp)
    return total_size
# writes world size into statsd.
sc.gauge('world_size_kb', get_size('/var/minecraft/world'))
Now each time you execute that script, the number of connected people and world size value will be transmitted to Bleemeo Cloud Platform. You can then create a cron task to call it every 5 minutes.
Those metrics can of course be monitored on cloud platform and displayed in a dashboard. Here is a quick overview of our custom panel for our Minecraft server.