

This article will cover:
- How to configure RabbitMQ with Bleemeo to automatically collect metrics
- How to configure a dashboard to better understand your server and what’s going on with Custom dashboards.
What is RabbitMQ?
RabbitMQ is an open source message broker software. It’s one of the most popular with tens of thousands of users, and is used by both startups and large groups. If you want to learn more about RabbitMQ, here’s a link to their site.
How to configure RabbitMQ to Bleemeo?
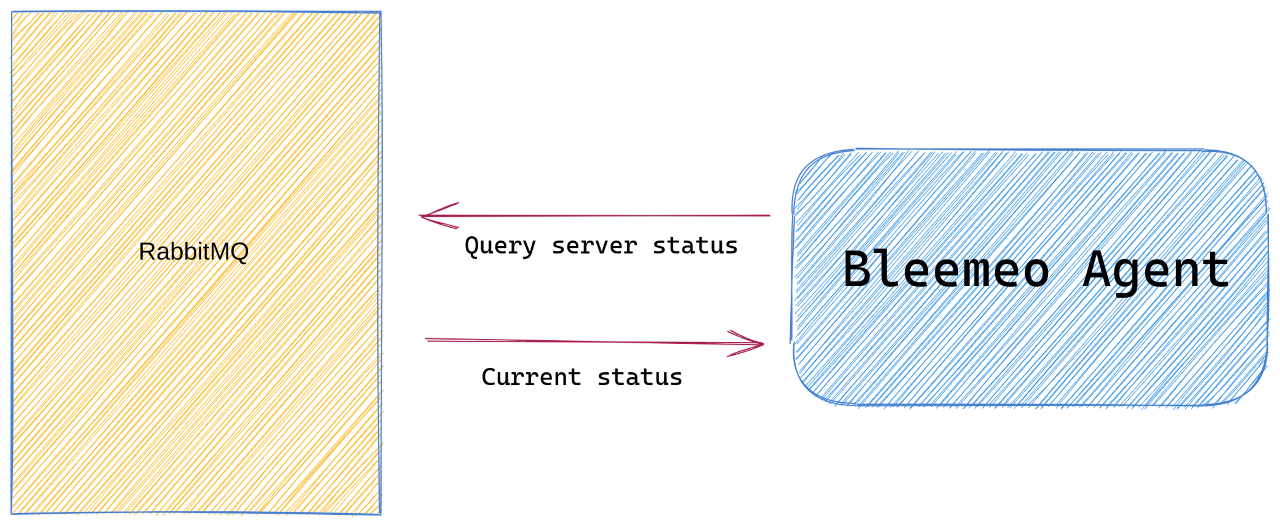
Once the agent is installed, it automatically creates a service check on port TCP 5672 and tries to gather metrics using RabbitMQ management API with user guest. If you disable the guest account, you should check our documentation so see how to configure a different user. Documentation also lists advanced options for monitoring a RabbitMQ server.
How to customize your dashboard?
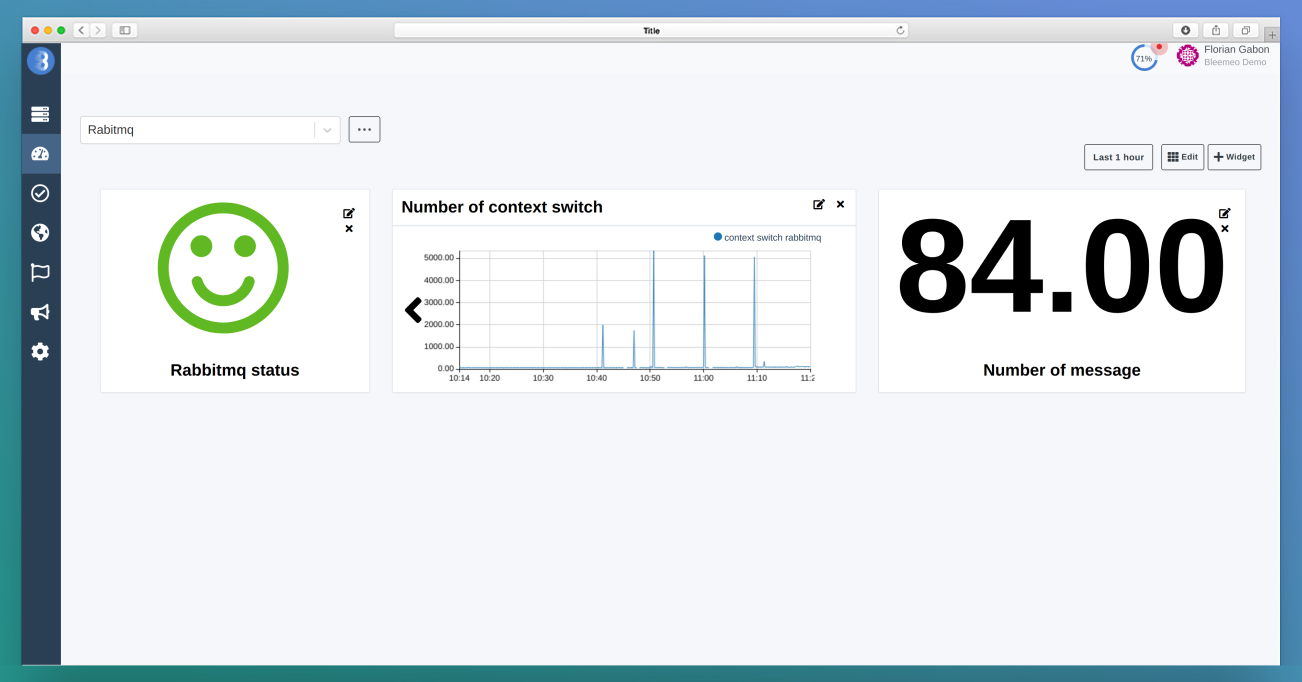
We do not create a service dashboard by default for RabbitMQ. You can configure a custom dashboards that can better fit your specific expectations. For example here, the following metrics will be monitored:
- Status of RabbitMQ
- Number of message
- Number of context switches caused by the process Rabbitmq
If you want more RabbitMQ metrics, here is a link to our documentation.
This simple type of dashboard allows you to better understand the load on your RabbitMQ server, the number of applications connected, and also what is happening on your server. You can also add other metrics, it is possible to add all the metrics you want even that of another agent or more basic metrics like:
- Memory
- Number of packets sent per second.
- CPU
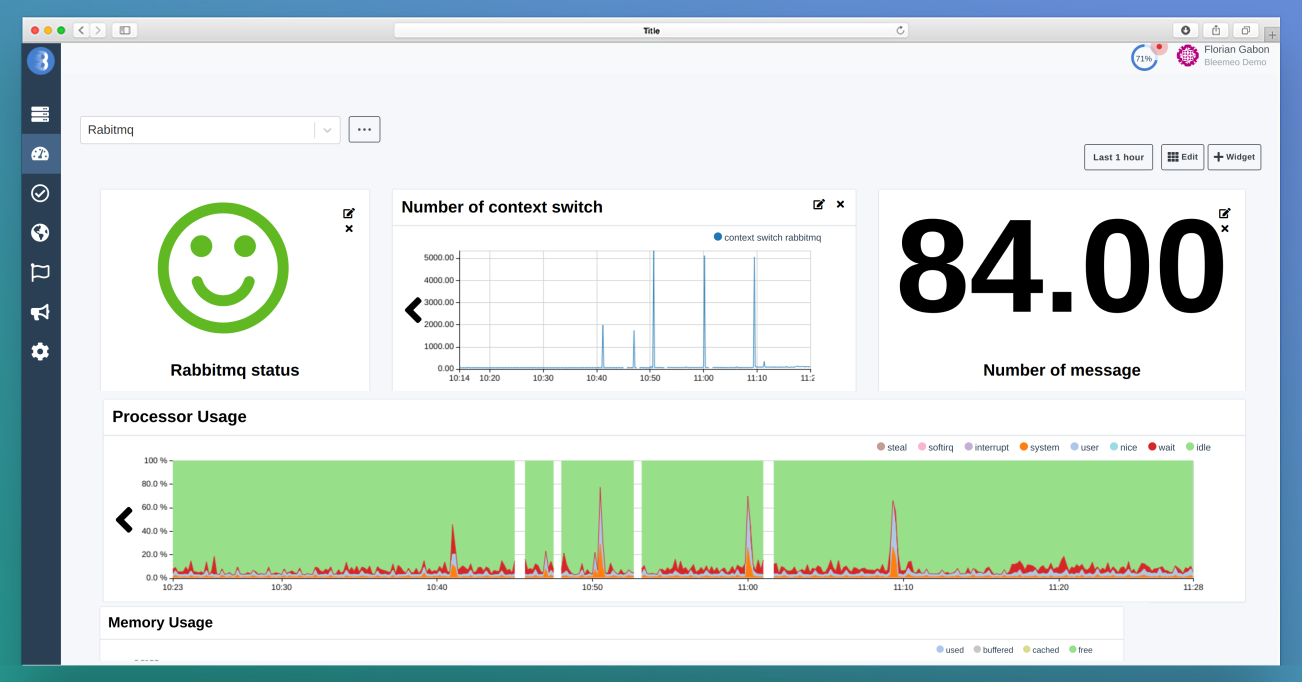
It will allow you to have a single dashboard with all required indicators.
With Bleemeo, you can start monitoring RabbitMQ metrics and create custom dashboards in a few minutes.