 Published on 02 March 2022 by Florian Gabon
As of today, Bleemeo is not ingesting logs file, but you can use some external tool to ingest logs metrics which should be pretty useful as it will help you to identify issues and trigger an alarm. You will still have to connect to the machine to check logs, but trends and alarms are centralized in your favorite monitoring tool.
We are going to use mtail here to expose Prometheus metrics that will be ingested by Bleemeo Cloud monitoring platform where metrics will be stored and dashboards will be created to visualize metrics.
What is mtail?
mtail is a Google project that "extract internal monitoring data from application logs for collection into a timeseries database". mtail ingests logs and with "programs" (the name of the rules that transform logs files into metrics) export metrics, in various formats: it can be collectd, Graphite or in our case Prometheus. This Prometheus exporter will be scraped by the Bleemeo monitoring agent and sent to the Bleemeo Cloud platform to be stored.
mtail programs can be a bit hard to write, but Google provides a good set of example in the "example" directory on the GitHub repository of the project. You will find examples for classical services like Apache, Postfix, MySQL and many other services supported by Bleemeo.
Deploying mtail
mtail is available in most Linux distributions. We are going to setup on an Ubuntu 20.04 server mtail with apt, but mtail is also available as binaries on the GitHub page of the project.
apt install mtail
In our example, we will just count lines.
Copy example from the documentation to /etc/mtail/ :
cp -a /usr/share/doc/mtail/examples/linecount.mtail /etc/mtail
Change in /etc/default/mtail to point your logs and also add an ENABLED=true to enable mtail:
ENABLED=yes

# List of files to monitor (mandatory).
#LOGS=/var/log/daemon.log,/var/log/mail.info
LOGS=/var/log/syslog
...
Now restart mtail:
/etc/init.d/mtail restart
It should listen on port 3903 and expose a /metrics Prometheus endpoint. We can request metrics with curl:
# curl -s http://localhost:3903/metrics | grep mtail
# HELP line_count defined at linecount.mtail:4:9-18
line_count{prog="linecount.mtail"} 2 1646148603389
# HELP mtail_line_count number of lines received by the program loader
# TYPE mtail_line_count untyped
mtail_line_count 2
# HELP mtail_log_lines_total number of lines read per log file
# TYPE mtail_log_lines_total untyped
mtail_log_lines_total{logfile="/var/log/syslog"} 2
# HELP mtail_log_watcher_error_count number of errors received from fsnotify
# TYPE mtail_log_watcher_error_count untyped
mtail_log_watcher_error_count 0
# HELP mtail_prog_loads_total number of program load events by program source filename
# TYPE mtail_prog_loads_total untyped
mtail_prog_loads_total{prog="linecount.mtail"} 1
Now you can send a message to syslog:
logger "This is a test message"
And check with the same curl, your counter should have increased by 1 (or more if you have other logs due to system activity).
You can add more programs to get more metrics in /etc/mtail.
How to monitor with Bleemeo?
We can add a configuration to Bleemeo agent configuration to scrape the mtail Prometheus endpoint and allow metrics to be sent to Bleemeo Cloud platform. Just add to the configuration file "/etc/glouton/conf.d/99-mtail.conf":
metric:
  prometheus:
    targets:
      url: "http://127.0.0.1:3903/metrics"
      name: mtail
      allow_metrics:
        - mtail_log_watcher_error_count
        - line_count
Remember when you want to add custom metrics to Bleemeo that you need to explicitly send them to Bleemeo. You can use wildcards to allow multiple metrics at a time.
You should now see in your agent metrics tab the new scraped metrics. Any Prometheus scraper is capable to ingest metrics produced by mtail. As we mentioned, mtail is also capable of exporting metrics to collectd or Graphite format. We will focus on Prometheus here.
You can build a custom dashboard to graph those metrics.
The dashboard below provides a detailed view of your syslog, like the number of bytes allocated and still in use or the number of errors received from fsnotify. We can know all this thanks to the following metrics:
- mtail_log_watcher_error_count (the number of errors received from fsnotify)
You can add any other metrics to a custom dashboard. It helps you to mix metric sources. In the example below, we have a dashboard mixing data:
- Container CPU used
- Memory used
- NGINX status
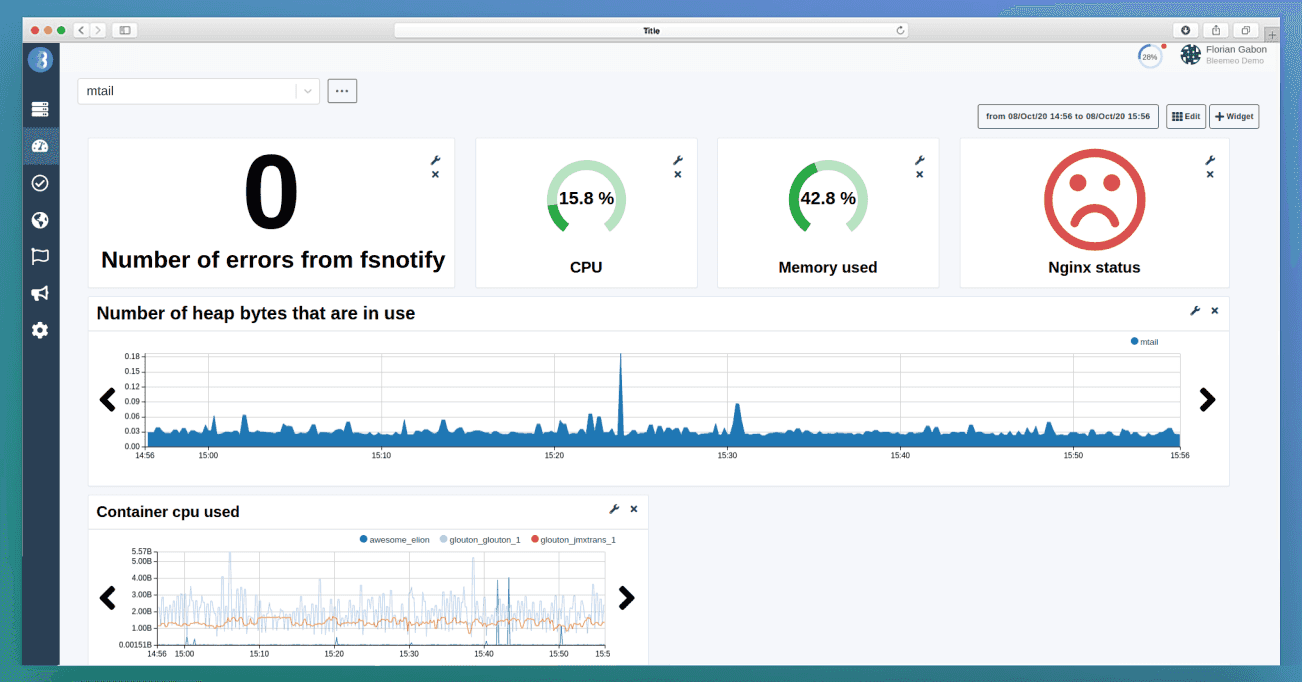
It will allow you to have a single dashboard for several types to monitor, and therefore a dashboard is infinitely customizable, which can be useful for what you need exactly to monitor.
My need is more basic, this is too complex
If you have a more basic need, and that mtail programs are too complex, you can also do shell scripts with grep and write a local file. Bleemeo monitoring agent allows reading Prometheus metrics from a flat file on the disk, just configure file path in the URL of the Prometheus endpoint:
metric:
  prometheus:
    targets:
      url: "file:///var/run/metrics_file.txt"
      name: mtail
The file must be formated like a Prometheus exporter as a simple text file with metric name, labels and value:
<metric name>{<label name>=<label value>, ...} <metric value>
With Bleemeo, you can start monitoring your logs with mtail metrics and create custom dashboards in a few minutes.
If you don't have a Bleemeo account yet, start monitoring your Infrastructure today in 30s.