 Published on 04 March 2021 by Florian Gabon
When using Nagios, the NRPE daemon has been the traditional solution to implement local checks (load, number of users, custom scripts, etc.). All other checks are performed remotely from the Nagios server. NRPE daemon has been a bit challenging as you need to keep it in sync with your Nagios server and sometimes backporting this daemon can be painful. As Glouton has been implemented in Go, when you need a Nagios NRPE daemon, you can just use the binary on any compatible system and voilà.
Let's see how to deploy Glouton as a Nagios NRPE daemon and how it can help you to transition from Nagios monitoring to a newer monitoring system (Bleemeo for example, but not only, Glouton offers plenty connectors).
What is NRPE and Glouton?
NRPE is a Nagios Remote Plugin Executor that allows remote system monitoring using scripts that are hosted on the remote systems. The scripts on the remote systems such as check_load, check_disk, check_user are unavailable normally on the local machine became allowed to monitor with the NRPE.
Glouton is the Open Source Bleemeo monitoring agent that has been designed to be a central piece of monitoring infrastructure. It gathers all information and can be connected to the monitoring system of your choice. It's primarily targeted to be connected to Bleemeo, but it can be used standalone or connected to a Nagios or InfluxDB for example. Today, we are interested in the Nagios NRPE capabilities of Glouton.
How to install Glouton?
Glouton is available as a Debian package, a RPM package and also as a standalone binary (it's implemented in Go). You can find all the details for the setup in our documentation, in a summary assuming you are not using a Bleemeo account already (otherwise it's already setup):
On Debian:
$ sudo apt-key adv --keyserver hkp://keyserver.ubuntu.com:80 --recv-keys 9B8BDA4BE10E9F2328D40077E848FD17FC23F27E
$ dist_version=focal
$ echo deb https://packages.bleemeo.com/glouton/ ${dist_version} main | sudo tee /etc/apt/sources.list.d/glouton.list
$ sudo apt-get update
$ sudo apt install glouton
On CentOS / RedHat / Fedora:
$ sudo tee /etc/yum.repos.d/bleemeo.repo << "EOF"
[bleemeo-agent-repo]
name=Bleemeo Agent Repository
baseurl=https://packages.bleemeo.com/bleemeo-agent/fedora/$releasever/$basearch/
enabled=1
gpgcheck=1
gpgkey=https://packages.bleemeo.com/bleemeo-agent/fedora/gpg
[bleemeo-jmxtrans-repo]
name=Bleemeo jmxtrans Repository
baseurl=https://packages.bleemeo.com/jmxtrans/fedora/$releasever/$basearch/
enabled=1
gpgcheck=1
gpgkey=https://packages.bleemeo.com/jmxtrans/fedora/gpg
EOF

$ sudo apt install glouton
Note: you have to replace fedora by centos when using CentOS or RedHat.
Configure Glouton as NRPE daemon
All you need is to create a local configuration file to activate the NRPE feature (it's disabled by default):
$ sudo tee /etc/glouton/conf.d/07-nrpe.conf << "EOF"
nrpe:
    address: 0.0.0.0
    enabled: true
    conf_paths:                        # Give to Glouton where the NRPE
                                       # configuration files are located
        - /etc/nagios/nrpe.cfg
        - /etc/nagios/nrpe.d/commands.cfg
        - /etc/nagios/nrpe.d/nrpe_allowed.cfg
Restart Glouton for the changes to take effect:
systemctl restart glouton
You can reuse any Nagios existing Nagios plugin from your distribution (provided by monitoring-plugins on Debian & Ubuntu systems) or from Nagios Exchange.
If you are using Bleemeo as a monitoring platform and are activating Nagios NRPE, metrics created by NRPE including customer scripts and checks can also be available as metrics in Bleemeo.
How to create custom check?
If you want to create additional checks, you have an example of how you can write personalized checks. Once the checks are created, you will also find them on the Bleemeo panel and if you add the nagios_nrpe_name field you will also expose it on the Nagios Web Interface.
$ sudo tee /etc/glouton/conf.d/08-custom-checks.conf << "EOF"
  # Additional check (TCP or HTTP) and Nagios-check could be defined to
  # monitor custom process.

  # Example of check:
  service:
    - type: the_name_of_your_service
      port: 8080                      # TCP port of your service
      address: 127.0.0                # Optional, default to 127.0.0.1
      check_type: http                # Optional, default to "tcp".
                                      # Could be either "http" or "tcp"
      nagios_nrpe_name: check_name    # Optional, exposed name for NRPE
    - type: other_name_of_service
      check_type: nagios
      check_command: /path/to/check_service --with-argument-if-applicable
      # Optionally you can specify an address and TCP port. Glouton
      # will connect to this port, if connection is closed, agent will
      # immediately call your check command instead of waiting up to
      # one minute.
      address: 127.0.0.1
      port: 1234
In this example, the first check will be available in NRPE and Bleemeo, the second only in Bleemeo.
Restart Glouton for the changes to take effect:
systemctl restart glouton
Transitioning to Bleemeo monitoring
If you have a Nagios infrastructure in place, you can easily replace the existing Nagios NRPE daemon as described above by Glouton and connect them at the same time to the Bleemeo Monitoring Platform. This will allow you to transition to a new monitoring system and when you're happy you can decommission your old Nagios infrastructure.
In Bleemeo, you can reuse the checks and what you have done directly in your dashboards, for example.
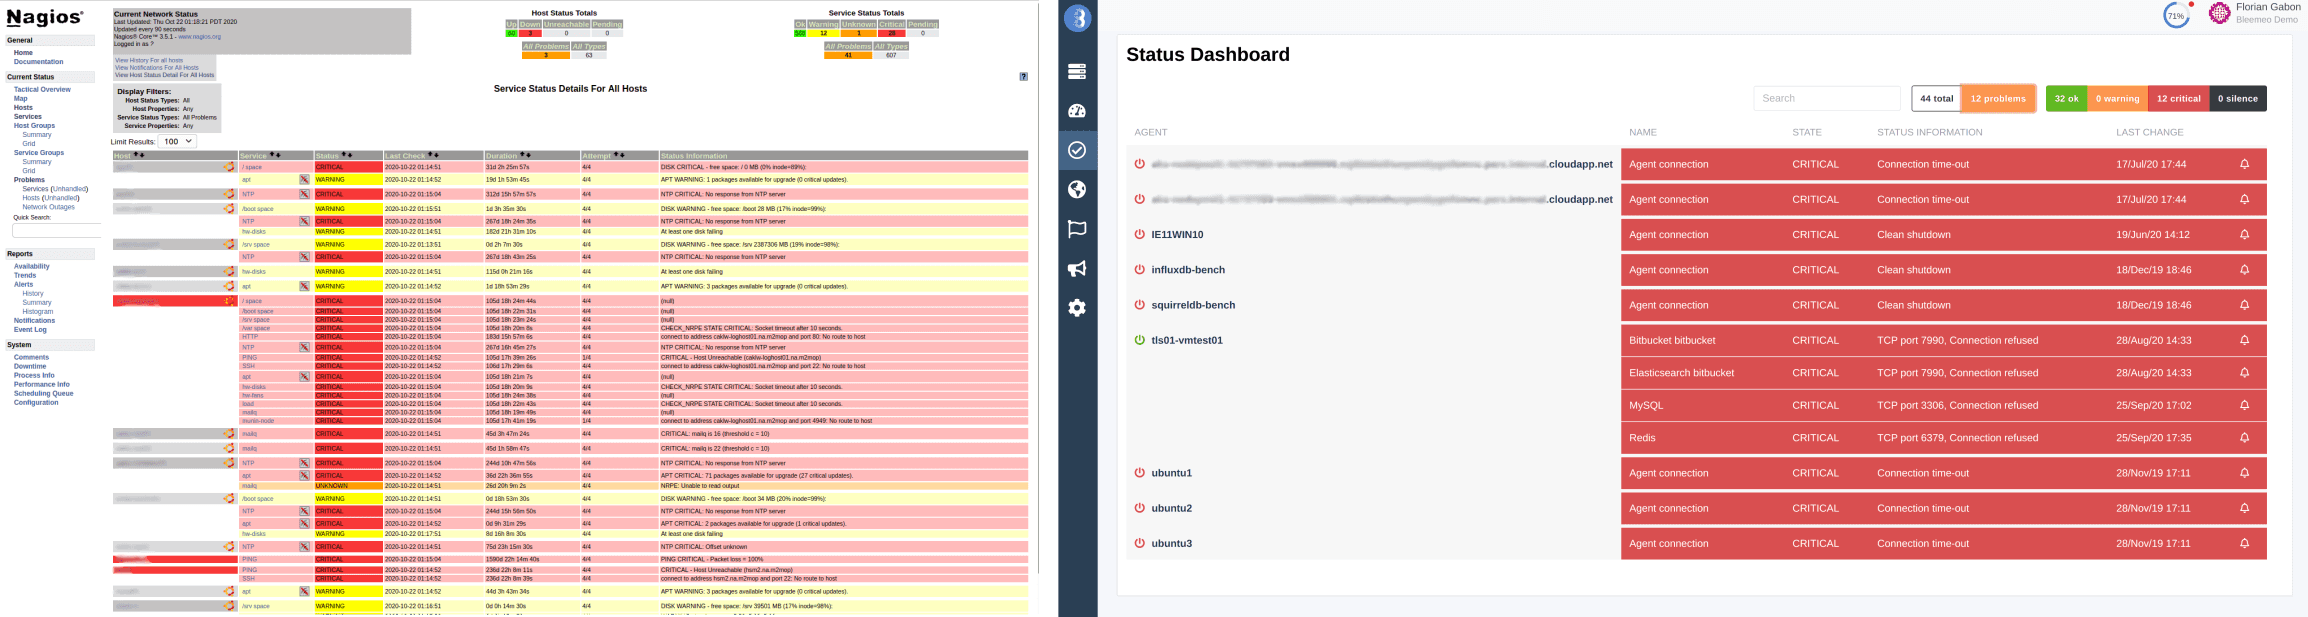
The goal is to switch from the Nagios web interface that you already know on the left to the Bleemeo web interface on the right. Using Bleemeo's web interface panel, you can easily customize your dashboard to your liking, saving you time to display different graphics, metrics and checks.
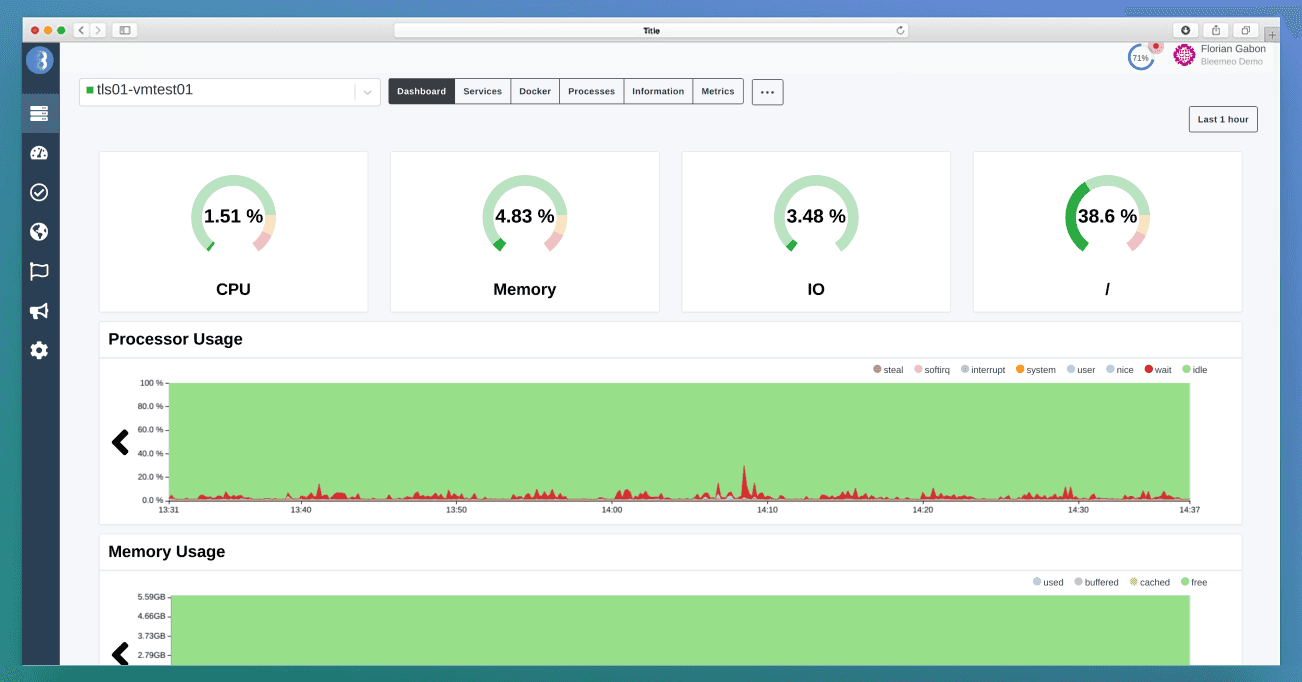
In addition to simple checks, Bleemeo will measure everything in your infrastructure. Status dashboards (like in Nagios) are available by default, but you will also have a dashboard per agent will all system and services metrics, capability to build custom dashboards with metrics and data coming from different servers and even managed services from your cloud provider. This allows you to have a real live view of your infrastructure's health and performance.
If you don't have a Bleemeo account yet, start moving your Nagios infrastructure today.