
What is the Bleemeo Community Edition
The Bleemeo Community Edition is the Open Source and self-hosted version of the Bleemeo monitoring solution.
- Prometheus compatible
Glouton exposes a Prometheus metric endpoint and SquirrelDB supports remote Prometheus storage and PromQL queries.
- Robust and horizontally scalable
SquirrelDB and the Ingestor are designed to be scalable.
- Push model
A push model instead of the Prometheus pull model makes data collection more firewall friendly and easier to scale.
- Secure
All communications can be encrypted and authenticated.
It is composed of three main components:
- Glouton: a powerful monitoring agent, that exposes relevant metrics about your system and all services and containers running on your server.
- SquirrelDB: a scalable and highly available time series database.
- SquirrelDB Ingestor: forward metrics sent by Glouton over MQTT, a standard messaging system, to SquirrelDB.
And some third party components:
- Cassandra: a distributed database used for SquirrelDB long-term storage.
- NATS: a high-performance messaging system used as a MQTT broker by Glouton to send its metrics. The MQTT protocol is much lighter in terms of resources and bandwidth than HTTP, which is commonly used in Prometheus.
- Grafana: display the metrics and provide alerting.
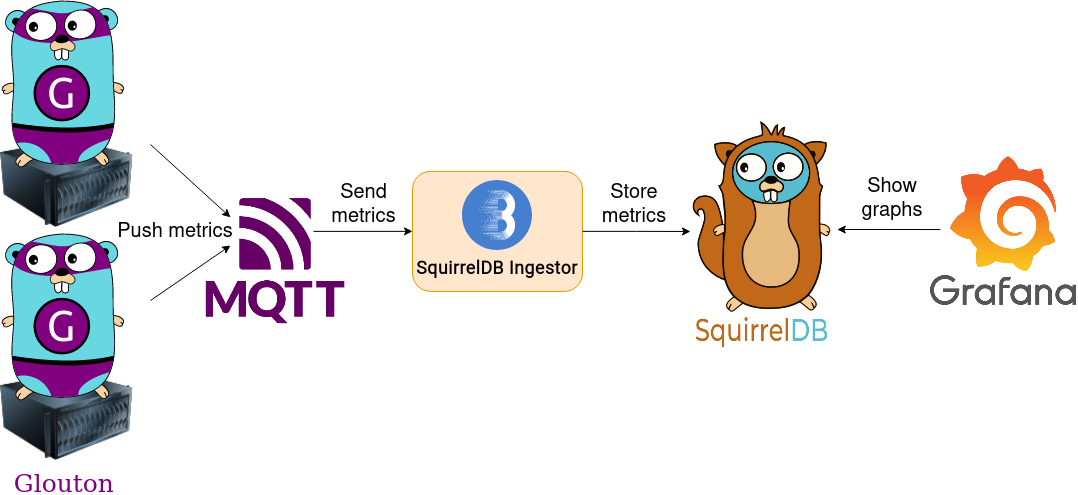
In this article, we will show you how to install and configure these components to have a fully working monitoring infrastructure.
The full architecture will look like this:
SquirrelDB
SquirrelDB is a time series database, highly optimized for storing metrics. It has several interesting features:
- Blazing fast read of recent metrics using an in-memory store for short-term storage.
- Efficient and scalable long-term storage with Cassandra.
- Expose a PromQL endpoint, making it compatible with Prometheus compatible tools, like Grafana to view your metrics.
Installing SquirrelDB is easy with Docker. First let’s create a Docker network so all our components will be able to communicate.
docker network create bleemeoNow let’s run Cassandra that will hold our long-term storage.
docker run -d --name "cassandra" --restart unless-stopped --net bleemeo \
    -v cassandra:/var/lib/cassandra \
    -e MAX_HEAP_SIZE=128M -e HEAP_NEWSIZE=24M cassandra
Then we can start SquirrelDB and connect it to Cassandra.
docker run -d --name "squirreldb" --restart unless-stopped --net bleemeo \
    -e SQUIRRELDB_CASSANDRA_ADDRESSES=cassandra:9042 bleemeo/squirreldb
MQTT
MQTT is a standard messaging protocol providing a lightweight publish/subscribe messaging transport. In this example we will use NATS as our MQTT server, it provides a high-performance and scalable messaging system. You are free to use any other MQTT server, it will work the same.
We need to write a configuration file for NATS to make it expose an MQTT endpoint.
cat > nats.conf << EOF
server_name: "bleemeo-mqtt"

jetstream {}

mqtt {
   port: 1883
}
EOF
Then we can run NATS with this configuration.
docker run -d --name "nats" --restart unless-stopped -p 1883:1883 \
    --net bleemeo -v $(pwd)/nats.conf:/etc/nats/nats.conf:ro \
    nats -c /etc/nats/nats.conf
Note that in production the MQTT port should be protected, especially if it’s exposed over the internet, NATS should be configured to use TLS and authentication. See NATS TLS documentation and the authentication setup for more information.
SquirrelDB Ingestor
We can run SquirrelDB Ingestor with some configuration to tell him where to find our database and the MQTT server.
docker run -d --name="squirreldb-ingestor" --restart unless-stopped --net bleemeo \
    -e INGESTOR_REMOTE_WRITE_URL="http://squirreldb:9201/api/v1/write" \
    -e INGESTOR_MQTT_BROKER_URL="tcp://nats:1883" \
    bleemeo/squirreldb-ingestor
Again we can check the logs to make it sure it successfully connected to MQTT.
docker logs -f squirreldb-ingestorYou should see the message MQTT connection established.
Glouton
Now let’s setup our first monitoring agent.
Glouton is a monitoring agent that makes observing your infrastructure easy. It provides a lot of features:
- gathers system metrics from Prometheus node_exporter
- automatically discovers your services to retrieve relevant metrics.
- Kubernetes native: create metrics and checks for pods
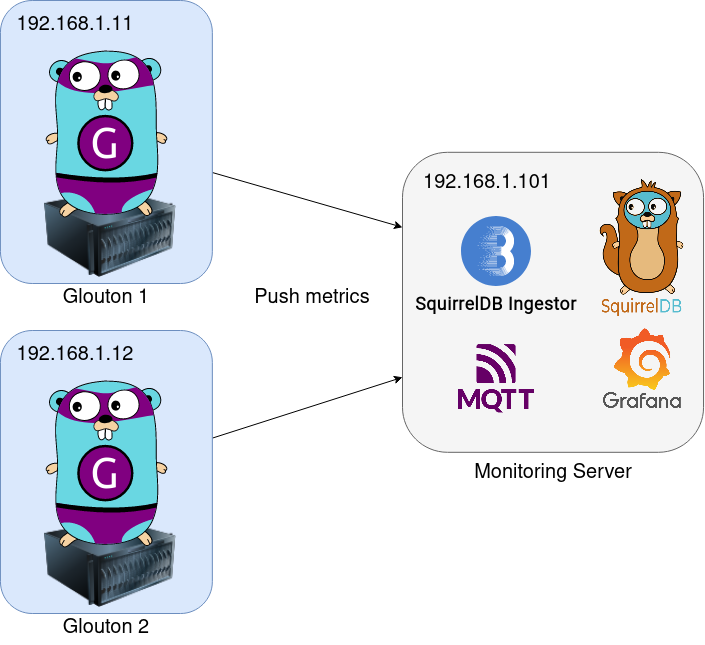
We need to configure the agent to send its metrics to NATS. We assume here that NATS is running on our monitoring server which has the IP 192.168.1.101, as in the diagram below.
The following command will create the configuration file glouton.conf to tell
the agent the address of our MQTT server and the metrics it should send.
# This should be the address where the NATS MQTT server is running
MONITORING_SERVER_ADDRESS="192.168.1.101"

cat > glouton.conf << EOF
agent:
  metrics_format: prometheus

bleemeo:
  enable: false

mqtt:
  enable: true
  hosts:
    - $MONITORING_SERVER_ADDRESS
  port: 1883

# Allow node exporter metrics.
metric:
  allow_metrics:
    - node_*
EOF
Now we can run Glouton:
docker run -d --name="glouton" --restart unless-stopped \
    -v $(pwd)/glouton.conf:/etc/glouton/conf.d/90-local.conf:ro \
    -v /var/lib/glouton:/var/lib/glouton -v /var/run/docker.sock:/var/run/docker.sock \
    -v /:/hostroot:ro --pid=host --net=host \
    --cap-add SYS_PTRACE --cap-add SYS_ADMIN bleemeo/bleemeo-agent
We can check the logs to make sure everything is working:
docker logs -f gloutonYou should see the message Open Source MQTT connection established.
To sum up what we did, we set up a working Time Series Database to store our metrics, we started a MQTT server, SquirrelDB Ingestor and a monitoring agent. The agent sends its metrics to MQTT, SquirrelDB Ingestor reads them and writes them in SquirrelDB.
Grafana
Now that our metrics are stored in our Time Series Database, we are only missing something to view them and be notified of problems. For that we can use Grafana.
docker run -d --name="grafana" --restart unless-stopped -p 127.0.0.1:3000:3000 \
    --net bleemeo grafana/grafana
After Grafana is started, you can open
http://localhost:3000 and login with the credentials
admin/admin.
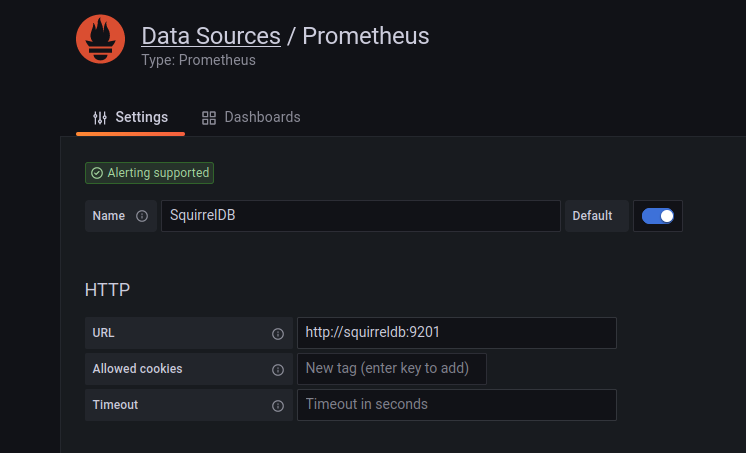
Next you need to add a Prometheus source, with the URL http://squirreldb:9201.
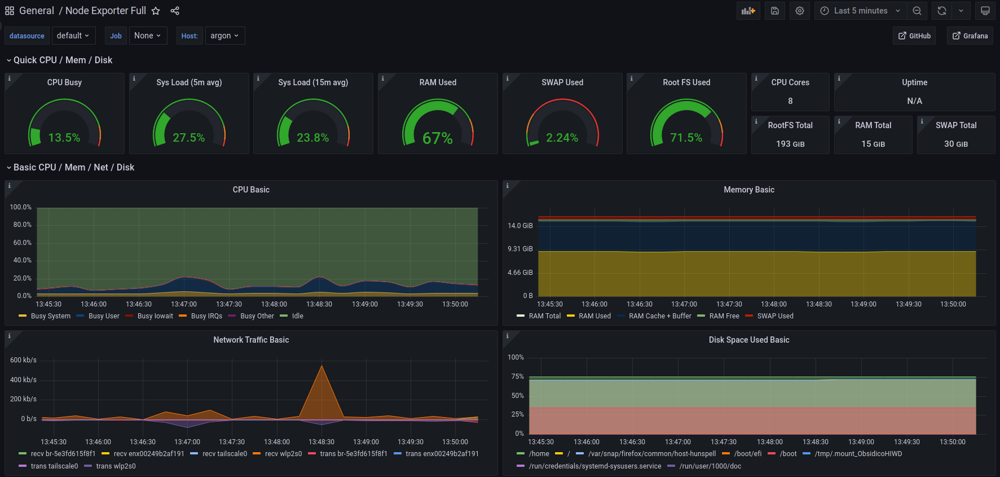
Then import the Node Exporter dashboard with the ID 1860, using the SquirrelDB data source we just configured.
You should see the system metrics gathered by the agent.
To be notified when an issue occurs, you can create alerting rules with Grafana.
Conclusion
You’ve successfully deployed the Bleemeo Community Edition!
If you want, you can install Glouton on your other servers and connect them to MQTT to be able to monitor all your infrastructure from one dashboard.
Note that we set up SquirrelDB, Cassandra and the ingestor on a single node, but all of these components can be scaled as needed. For more information, check out our high availability setup example.