Servers, Containers and Applications Monitoring made easy
With Bleemeo monitor all your infrastructure from a single Cloud Monitoring solution.
Metrics, Health Checks and Real Time Dashboards for:
Servers
- Linux and Windows hosts with agent
- Cloud, bare-metal & VPS servers
- Health checks and metrics for system and services
- Dashboards with CPU, RAM, Disk, network and services metrics
- Use thresholds and Query Language to define alarms and receive notifications


Containers
- Docker and Kubernetes support
- Container health checks and metrics
- Integrate with Kubernetes managed offers
- Elastic workload support
- Services in containers health checks and metrics


Applications
- 100+ services detected automatically: Nginx, Redis, MySQL, PostgreSQL, RabbitMQ and many others
- SDK available for most programming languages
- Instrumentalize your code, create custom metrics from your code
- Prometheus and Statsd metrics ingestion support
- Use standard Prometheus exporters from community


Network
- Use probes to check public services availability and latency
- Public probes located in 5 locations on 3 continents
- Use your hosts agent as private probes
- SSL & domains name expiration checks
- Monitor any SNMP capable device
- Collect switches, routers, SAN, Wifi access points metrics


30 seconds to monitor your infrastructure
Deploying a robust, scalable monitoring solution can be time consuming. At Bleemeo, we focus on making users life easier. Common operating systems and services are auto-detected, default dashboards and notifications rules are created. All you need is connect your agent and then customize for your needs.


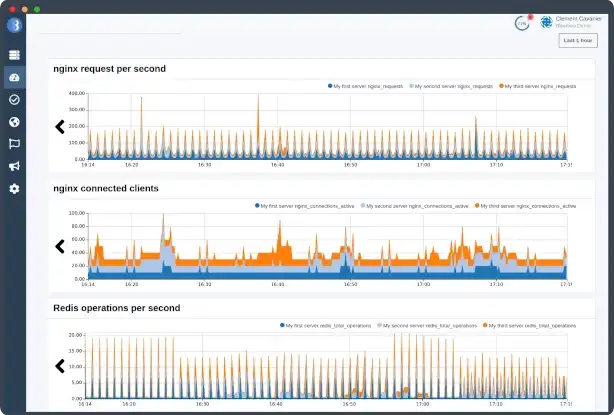
Nginx, MySQL, PostgreSQL, RabbitMQ, Redis and 100+ services monitored out of the box.
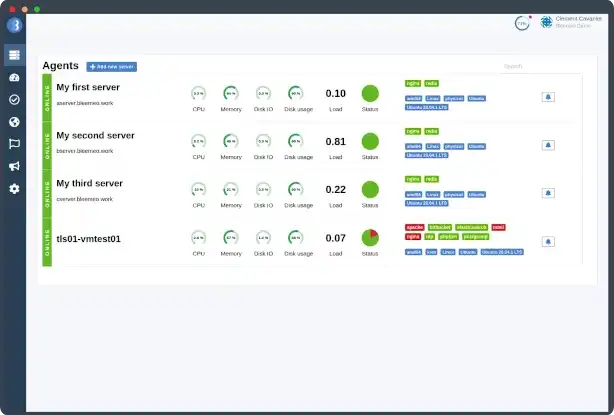
On hosts running Bleemeo monitoring agent, common services are automatically detected and dashboards with services health checks and metrics automatically generated.
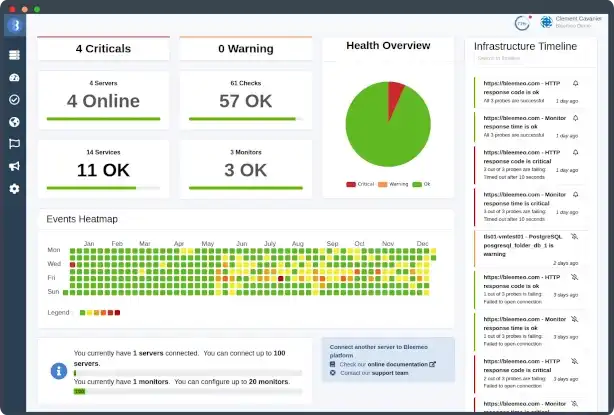
Bleemeo provides connectors to third parties to send notifications, and manage on calls. Bleemeo also integrates with all monitoring ecosystem, providing Prometheus, StatsD integrations or capability to run Nagios checks.


Build your apps, not monitoring
We know it's hard and time consuming to build a scalable and reliable monitoring solution. We provide DevOps Teams and Infrastructure Teams a Cloud based solution to monitor all your infrastructure components from server to application with monitoring standards like OpenMetrics and Prometheus and let you focus on your business.
Server Monitoring for DevOps Teams
Bleemeo Cloud Monitoring platform will help you to monitor systems, services (web servers, databases, ...), containers and applications. Bleemeo also provide connectors to ingest metrics from standard format like Prometheus, StatsD or run existing Nagios scripts.
All metrics can be graphed on custom dashboards if not graphed on default dashboards and alarms can be defined using threshold or more complex Query Language (PromQL).
- Linux, Windows hosts metrics: CPU, Memory, Disk, I/O, network, ...
- Services metrics: requests rate, memory, cache hits, ...
- Prometheus and StatsD metrics ingestion for monitoring compatible services and applications
- Real time metrics with up to 10 seconds granularity.
- Automatic Dashboards for metrics from hosts and services.
- Build Custom Dashboards with any metrics.
- Uptime Monitoring of your public services (websites and any internet facing service) from multiple locations in the world.
- Run existing Nagios scripts or any custom script for health checks or publish metrics.
- Key Process Monitoring with detailed CPU, Memory, network usage for services processes.
- Agentless monitoring for equipments supporting SNMP: network switches, routers, SAN, NAS, ...
- Receive notifications with Slack, Microsoft Teams, Bleemeo iOS & Android application, mail and others integrations.

Docker & Kubernetes Monitoring for Cloud Native environments
Modern IT environments are moving frequently. Bleemeo auto-discovery feature avoid users to manually define their services. Services can run on bare metal, on premise, on Cloud, in Containers, in Kubernetes.
Everything you do with the web interface can be automated with scripts through our REST API.
- Containers, Kubernetes clusters monitoring. Our agent discover services in containers, manage deployments, and containers rotation out of the box.
- Run Bleemeo Monitoring agent on Kubernetes managed clusters from AWS, Azure or Google to get a deep view of your infrastructure.
- Get metrics of managed services from your Cloud Provider: AWS, Azure, Google to complete the metrics you can get directly from your hosts.
- Instrumentalize your code and get metrics from your applications, combine data from hosts, services and applications in your custom dashboards.
- Build Cloud Native Dashboards using labels on your hosts and containers, no need to manually update your dashboards after changes in your stack.
- Documented REST API to integrate monitoring in your automation stack.
Why choose Bleemeo as infrastructure monitoring solution
Bleemeo Engineers focus on providing customers a Cloud based Monitoring solution as easy as possible to deploy. No need for long and complex installation, just deploy and most of the configuration is automatically built.
- Bleemeo agent auto-discovers services and automatically create health checks, metrics and dashboards.
- Bleemeo agent is Open Source and written in Go for more efficiency and avoid dependencies madness.
- Smart Pricing: pay per hour what you are monitoring.
- Mobile applications to monitor your infrastructure from anywhere.
- 100+ integrations out of the box: OS, services, notifications...
- Integrate and relies on monitoring standards: Open Metrics, Prometheus, StatsD, Nagios: no vendor lock-in.
- Monitoring independent from your infrastructure. Don't overload your infrastructure when your ops team is analyzing issue.
- Cloud Monitoring Solution on the market since 2015, serving hundreds of customers.
- Support team available by email and phone in European timezones.
- Cloud solution built and hosted in 🇪🇺 Europe.
Start Monitoring your servers, containers, and applications in 30 seconds without credit card.Start your Free Trial
Pricing
We price per server, per hour and propose several plans from Free to Enterprise to fit with your business.
Bleemeo Plans offer flexibility and smart pricing. You pay for what you use, no more, no less. Our pricing are easy to understand and adapts to your needs.


Trusted by 300+ customers
You are in a good company! Our customers use Bleemeo every day to monitor their infrastucture and receive notifications when something goes wrong.